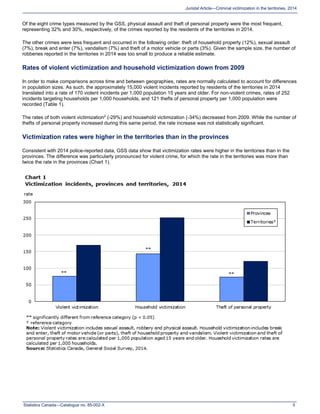
SlideShare a Scribd company logo
Juristat
Catalogue no. 85-002-X
ISSN 1209-6393
by Samuel Perreault and Laura Simpson
Canadian Centre for Justice Statistics
Criminal victimization in the territories,
2014
Release date: April 27, 2016
Standard table symbols
The following symbols are used in Statistics Canada
publications:
.	 not available for any reference period
..	 not available for a specific reference period
...	 not applicable
0	 true zero or a value rounded to zero
0s
	 value rounded to 0 (zero) where there is a meaningful
	 distinction between true zero and the value that was rounded
p
	preliminary
r
	revised
x	 suppressed to meet the confidentiality requirements
	 of the Statistics Act
E
	 use with caution
F	 too unreliable to be published
*	 significantly different from reference category (p < 0.05)
How to obtain more information
For information about this product or the wide range of services and data available from Statistics Canada, visit our website,
www.statcan.gc.ca.
You can also contact us by
email at STATCAN.infostats-infostats.STATCAN@canada.ca
telephone, from Monday to Friday, 8:30 a.m. to 4:30 p.m., at the following toll-free numbers:
•• Statistical Information Service	 1-800-263-1136
•• National telecommunications device for the hearing impaired	 1-800-363-7629
•• Fax line	 1-877-287-4369
Depository Services Program
•• Inquiries line	 1-800-635-7943
•• Fax line	 1-800-565-7757
Published by authority of the Minister responsible for Statistics Canada
© Minister of Industry, 2016
All rights reserved. Use of this publication is governed by the Statistics Canada Open Licence Agreement.
An HTML version is also available.
Cette publication est aussi disponible en français.
Note of appreciation
Canada owes the success of its statistical system to a
long‑standing partnership between Statistics Canada, the
citizens of Canada, its businesses, governments and other
institutions. Accurate and timely statistical information could not
be produced without their continued co‑operation and goodwill.
Standards of service to the public
Statistics Canada is committed to serving its clients in a prompt,
reliable and courteous manner. To this end, Statistics Canada has
developed standards of service that its employees observe. To
obtain a copy of these service standards, please contact Statistics
Canada toll-free at 1-800-263-1136. The service standards are
also published on www.statcan.gc.ca under “Contact us” >
“Standards of service to the public.”
Statistics Canada—Catalogue no. 85-002-X 3
Juristat Article—Criminal victimization in the territories, 2014
Criminal victimization in the territories, 2014: highlights
 More than one-quarter of residents of the territories (28%) reported being the victim of at least one crime in 2014. This
was down from the proportion reported in 2009 (34%), but remains higher than the figure reported in the provinces
(18%).
 Both violent victimization (-29%) and household victimization (-34%) decreased from 2009. However, the rate of theft of
personal property remained stable.
 Nunavut recorded the highest rates of both violent victimization (241E
per 1,000 population) and household victimization
(313 per 1,000 population) among the territories. On the other hand, this territory also reported the lowest rate of theft of
personal property (68E
per 1,000 population).
 Overall, the proportion of people who reported being the victim of at least one crime was higher in communities with a
population of 2,000 or more (32%) than in smaller communities (19%).
 Approximately one-third of residents of the territories (34%) reported having been the victim of abuse by an adult at least
once before the age of 15. This proportion was higher among those aged 45 to 64 years (45%) than those aged 15 to
34 years (26%).
 Among those with a spouse or common-law partner (current or ex), 12% reported at least one spousal violence incident
in the preceding five years, similar to the proportion reported in 2009. Three-quarters (75%) of victims were Aboriginal.
 Consistent with data in the provinces, Aboriginal identity was not associated with an increased risk of violent victimization
when other risk factors were taken into account.
 Approximately one-half (49%) of victims of spousal violence reported sustaining injuries due to the violence. This
proportion was higher than the proportion observed in the provinces (31%).
 Almost half (49%) of cases of spousal violence were reported to the police, and so were 36% of victimization incidents
other than spousal violence.
 About one-third (34%) of females in the territories reported feeling very safe walking alone at night, compared with almost
two-thirds (62%) of males.
 Over one-third of territorial residents (36%) reported having a great deal of confidence in the police. Aboriginal residents
were less likely to report having a great deal of confidence in the police compared to non-Aboriginal residents (30%
compared with 43%, respectively).
Statistics Canada—Catalogue no. 85-002-X4
Juristat Article—Criminal victimization in the territories, 2014
Criminal victimization in the territories, 2014
by Samuel Perreault and Laura Simpson
Statistics Canada relies on two complementary instruments to collect official data on criminal victimization in Canada: police-
reported data collected through the Uniform Crime Reporting (UCR) Survey, and self-reported data collected through the
General Social Survey (GSS). While the UCR is an annual census of all crimes that come to the attention of the police, the
GSS on victimization is a sample survey conducted every 5 years which asks Canadians to report on their personal
experiences of victimization, and as such, includes both crimes that are reported to police and those that are not.
Data collected from both the GSS and UCR show that crime rates in the Canadian territories—Yukon, the Northwest
Territories and Nunavut—are notably higher than the rest of Canada (Allen and Perreault 2015; Perreault and
Hotton Mahoney 2012).
The territories also have different social and economic conditions compared to the provinces, such as a large population of
residents reporting an Aboriginal identity, a younger population, high unemployment and remote communities. In addition, the
territories differ from one another on a variety of factors like culture and socio-demographic composition. As such, analysis
specific to the territories could help to better understand the nature of victimization in that region of the country.
This Juristat presents the first results on victimization in the territories from the 2014 GSS. The analysis provides insight on
the nature and extent of criminal victimization in Canada’s three territories. This Juristat also presents new information on
childhood victimization and post-traumatic stress disorder (PTSD) and their links to victimization in the territories.
Furthermore, information on peoples’ perceptions of the criminal justice system, including their confidence in the police, is
presented.
Text box 1
Definition of criminal victimization in Canada
The GSS on victimization surveyed Canadians on their experiences with eight types of offences, which are:
Violent victimization: Sexual assault, robbery or physical assault.
Sexual assault: Forced sexual activity, attempted forced sexual activity, unwanted sexual touching, grabbing, kissing or
fondling, or sexual relations without being able to give consent.
Robbery: Theft or attempted theft in which the offender had a weapon or there was violence or the threat of violence
against the victim.
Physical assault: An attack (victim hit, slapped, grabbed, knocked down, or beaten), a face-to-face threat of physical harm,
or an incident with a weapon present.
Theft of personal property: Theft or attempted theft of personal property such as money, credit cards, clothing, jewellery,
purse or wallet. Unlike robbery, the offender does not confront the victim.
Household victimization: Break and enter, theft of motor vehicle or parts, theft of household property or vandalism.
Break and enter: Illegal entry or attempted entry into a residence or other building on the victim’s property.
Theft of motor vehicle or parts: Theft or attempted theft of a car, truck, van, motorcycle, moped or other vehicle, or part of
a motor vehicle.
Theft of household property: Theft or attempted theft of household property such as bicycles, electronic equipment, tools
or appliances.
Vandalism: Wilful damage of personal or household property.
More than one-quarter of residents of the territories reported being the victim of a crime1
In 2014, more than one-quarter of residents of the territories (28%) reported being the victim of at least one of the eight
offences measured by the GSS in the 12 months preceding the survey. This is down from the proportion reported in 2009
(34%), but remains higher than the figure reported in the provinces (18%).
In all, close to 36,000 criminal incidents were reported to the GSS by residents of the territories in 2014. Of these, the
majority (58%) were non-violent, being either theft of personal property (30%) or household crimes (29%). The remaining
42% were violent crimes, specifically sexual assault, robbery and physical assault.
Statistics Canada—Catalogue no. 85-002-X 5
Juristat Article—Criminal victimization in the territories, 2014
Of the eight crime types measured by the GSS, physical assault and theft of personal property were the most frequent,
representing 32% and 30%, respectively, of the crimes reported by the residents of the territories in 2014.
The other crimes were less frequent and occurred in the following order: theft of household property (12%), sexual assault
(7%), break and enter (7%), vandalism (7%) and theft of a motor vehicle or parts (3%). Given the sample size, the number of
robberies reported in the territories in 2014 was too small to produce a reliable estimate.
Rates of violent victimization and household victimization down from 2009
In order to make comparisons across time and between geographies, rates are normally calculated to account for differences
in population sizes. As such, the approximately 15,000 violent incidents reported by residents of the territories in 2014
translated into a rate of 170 violent incidents per 1,000 population 15 years and older. For non-violent crimes, rates of 252
incidents targeting households per 1,000 households, and 121 thefts of personal property per 1,000 population were
recorded (Table 1).
The rates of both violent victimization2
(-29%) and household victimization (-34%) decreased from 2009. While the number of
thefts of personal property increased during this same period, the rate increase was not statistically significant.
Victimization rates were higher in the territories than in the provinces
Consistent with 2014 police-reported data, GSS data show that victimization rates were higher in the territories than in the
provinces. The difference was particularly pronounced for violent crime, for which the rate in the territories was more than
twice the rate in the provinces (Chart 1).
Statistics Canada—Catalogue no. 85-002-X6
Juristat Article—Criminal victimization in the territories, 2014
Nunavut had the highest rates of violent and household victimization
The proportion of people who reported being a victim of at least one of the eight crimes measured by the GSS was quite
similar across the territories, ranging from 27% in Nunavut to 29% in the Northwest Territories.
While the proportion of victims was similar, the nature of victimization differed from one territory to another. Specifically,
Nunavut recorded the highest rates of both violent victimization3
(241E
per 1,000 population) and household victimization4
(313 per 1,000 population) among the territories. On the other hand, this territory also reported the lowest rate of theft of
personal property (68E
per 1,000 population) (Table 2, Charts 2 and 3).
Statistics Canada—Catalogue no. 85-002-X 7
Juristat Article—Criminal victimization in the territories, 2014
Conversely, Yukon recorded the lowest violent victimization rate (120E
per 1,000 population). Yukon is also the territory that
saw the most significant decline in victimization rates from 2009, with its violent victimization rate falling by 56% and the
household victimization rate decreasing by 40%. The Northwest Territories also observed a considerable decline in its
household victimization rate (-35%) compared with 2009.
Victimization was more common in the territories’ larger communities
Overall, the proportion of people who reported being the victim of at least one of the eight offences measured by the GSS
was higher in territory communities with a population of 2,000 or more. Specifically, nearly one-third (32%) of residents in the
larger communities reported being the victims of at least one of the eight crimes measured by the GSS, compared with
one in five people (19%) in the smallest communities. However, no significant differences were found between the three
largest communities—the three capital cities—and the other communities with a population of 2,000 or more (Chart 4).
Statistics Canada—Catalogue no. 85-002-X8
Juristat Article—Criminal victimization in the territories, 2014
Among the communities, Rankin Inlet (42%) and Iqaluit (39%) had the highest proportions of victims. Nearly all communities
with a population of 2,000 or more recorded victimization rates that were higher than the average of the smallest
communities.
In general, the difference between large and small communities was mainly attributable to theft of personal property rates,
which were significantly higher in the former (164 per 1,000 compared with 28E
per 1,000). Incidentally, the tendency toward
higher rates of personal property theft in large population centres is also observed in the provinces (Perreault 2015).
In Nunavut, the difference between large and small communities was also attributable to higher household victimization rates
in larger communities compared to smaller ones.
Statistics Canada—Catalogue no. 85-002-X 9
Juristat Article—Criminal victimization in the territories, 2014
Text box 2
Childhood maltreatment
Several studies have shown a link between abuse experienced during childhood and both an increased risk of victimization in
adulthood (Parks et al. 2011; Reid and Sullivan 2009; Desai et al. 2002) and an increased likelihood of having contact with
police (Boyce 2015). For the first time, the 2014 GSS included detailed questions about respondents’ experiences of
maltreatment during childhood.
Approximately one-third of residents of the territories (34%) reported having been the victim of some form of abuse by an
adult at least once before the age of 15. This proportion was slightly higher than the one recorded in the provinces (30%).
Specifically, 6% of residents of the territories reported experiencing both physical and sexual violence, while 24%
experienced solely physical assault, and 4% experienced solely sexual violence.
The proportion of victims of childhood maltreatment was relatively similar across the territories. However, older people—
particularly those aged 45 to 64 years—were more likely than younger respondents to report being the victim of childhood
maltreatment. Approximately one-quarter (26%) of respondents between the ages of 15 and 34 years reported experiencing
childhood maltreatment, compared with 45% among those aged 45 to 64 years (Chart 5).
In approximately one-half (53%) of cases of physical violence experienced during childhood, the offender was a member of
the victim’s immediate family, most often the father (28%) or the mother (16%).5
In cases of sexual abuse, however, the
offender was more likely to be an extended family member such as an uncle or cousin (23%), a stranger (18%) or an
acquaintance (17%).
The majority (62%) of people who experienced childhood maltreatment never spoke of the abuse to anyone before the age of
15, whether to a family member, friend, neighbour or anyone else.
Males (69%) were more likely than females (53%) to report that they had never spoken about the abuse before they turned
15 years old. Older people were also less likely to have spoken about the abuse to anyone while they were under 15. More
than half (52%) of people aged 15 to 24 years who experienced childhood maltreatment told someone about it, compared to
29% of people aged 55 to 64 years and 23%E
of people aged 65 years and older who did so.
In addition to questions about maltreatment experienced during childhood, the 2014 GSS also asked respondents about
violence they may have witnessed as children. About 17% of residents of the territories reported having witnessed violence
by one of their parents toward another adult during the time that they were under the age of 15.
Statistics Canada—Catalogue no. 85-002-X10
Juristat Article—Criminal victimization in the territories, 2014
Violent victimization
The risk of being a victim of a violent crime is not the same for everyone. Lifestyle, the places people frequent or the region in
which they live can expose people to a higher risk of being the victim of a crime (Perreault 2015; Lilly et al. 2014).
Several characteristics have been shown to be associated with higher rates of victimization (Perreault 2015; Perreault and
Brennan 2010), some of which can be interrelated. For example, young people may have a higher rate of victimization than
older people, and students may have higher rates of victimization than those who are employed full-time. However, according
to a previous study, being a student may not be associated with a higher risk of violent victimization when other factors are
controlled for, mainly age (Mihorean et al. 2001).
Using the 2014 GSS data, a multivariate analysis was conducted to determine which factors had an impact on the risk of
violent victimization (Model 1). This section highlights the characteristics that were found to be associated with a higher risk
of violent victimization in the territories.
The risk of violent victimization was higher among women
Women’s rate of violent victimization was 182 violent incidents per 1,000 women, a rate not significantly different from that
reported by men (157E
per 1,000 men) (Table 3). However, when controlling for other risk factors, such as using drugs or
having a history of childhood victimization, women’s risk of violent victimization was approximately 45% higher than men’s
(Model 1). In other words, for people with similar characteristics, a female would have a greater risk of violent victimization
than her male counterpart.
A similar trend was observed in the provinces in 2014. This was mainly due to the relative stability of the sexual assault
victimization rate—of which the majority of victims are women—and a decline in the rates of other violent crimes.
The risk of victimization decreases with age
As was observed in the provinces, in the territories the risk of violent victimization decreases with age. For example, persons
aged 15 to 24 years recorded a rate of 298E
violent incidents per 1,000 population, compared with 92E
per 1,000 among
people aged 45 years and older (Table 3). Young people were more likely to report certain behaviours associated with a
higher risk of violent victimization, such as using drugs or going out at night. When other factors were taken into account,
however, age was still associated with the risk of victimization, which decreases approximately 5% with every year of age
(Model 1).
Drug use increases the risk of violent victimization
In 2014, drug use was one of the main risk factors for violent victimization in the territories. People who reported having used
drugs in the month preceding the survey recorded a rate of 333E
violent incidents per 1,000 population, a rate 2.5 times
higher than for non-users (134 per 1,000) (Table 4).
Going out in the evening frequently was another behaviour found to be associated with a higher risk of violent victimization.
For example, people who reported having 15 or more evening activities during the month preceding the survey recorded a
rate of 219 incidents per 1,000 population, compared with 132E
per 1,000 among those who reported less than 15 activities.
Moreover, people who reported engaging in at least one binge drinking episode—that is, at least five alcoholic drinks on a
single occasion—recorded a higher rate of violent victimization than those who did not engage in binge drinking
(230 per 1,000 population compared with 147E
per 1,000).
When all risk factors were taken together, drug use continued to be associated with an increased risk of victimization, while
evening activities and alcohol use were no longer factors.
A history of child maltreatment is associated with higher victimization rates
Several studies have shown a link between abuse experienced during childhood and an increased risk of victimization in
adulthood (see Text box 2). In line with these studies, data from the 2014 GSS show that childhood maltreatment was one of
the most significant risk factors for violent victimization experienced in the previous 12 months in the territories. Those who
reported experiencing childhood maltreatment recorded a violent victimization rate 2.6 times higher than those who did not
suffer abuse as a child (288 per 1,000 population compared with 111E
per 1,000) (Table 4). Moreover, this difference
persisted even when the other risk factors were taken into account (Model 1).
Statistics Canada—Catalogue no. 85-002-X 11
Juristat Article—Criminal victimization in the territories, 2014
A history of homelessness is associated with higher risk of violent victimization
People in the territories with a history of homelessness—that is, those who have been homeless or have had to live with
family, friends or in a vehicle because they had nowhere else to go— recorded a violent victimization rate that was nearly
three times higher than people with no such history (357E
per 1,000 population compared with 134 per 1,000) (Table 4).
When all risk factors were taken into account, a history of homelessness remained significantly correlated with the risk of
violent victimization (Model 1).
Low social cohesion is associated with higher rates of violent victimization
Social cohesion generally refers to a neighbourhood where people know each other, help each other and share common
values (Charron 2009; Forrest and Kearns 2001). Low social cohesion is thought to be associated with higher levels of crime,
particularly due to less social control and collective efficacy in the neighbourhood (Sampson 2012; Charron 2009).
Certain indicators suggest that this relationship was observable in the territories in 2014. For example, people who stated
their neighbourhood was not a place where neighbours helped each other recorded a violent victimization rate almost twice
as high as those who believed the opposite (291E
per 1,000 population compared with 153 per 1,000) (Table 4).
Higher violent victimization rates were also observed among those who reported social disorder in their neighbourhood
(239 per 1,000 population compared with 122E
per 1,000). The presence of social disorder—such as litter, noisy neighbours,
people who were drunk or using drugs in public places—can be considered a sign of social disorganization (Brown
et al. 2004).
However, when all risk factors were taken into account, the factor found to be most associated with risk of violent
victimization was the likelihood that neighbours would call the police if they witnessed criminal behaviour. Specifically, the risk
of victimization was more than two times higher among people who considered it unlikely that their neighbours would notify
the police if they witnessed a criminal act (Model 1).
People whose activities are limited by a physical condition are at higher risk for violent victimization
Various studies have suggested that physical or mental disabilities may be a risk factor for greater vulnerability to potential
offenders (Perreault 2009; Cantos 2006). According to data from the 2014 GSS, physical or mental disabilities were
associated with a 50% higher risk of violent victimization when other risk factors were taken into account (Model 1).
Aboriginal identity was not linked to the risk of violent victimization when all risk factors were taken into account
Data from previous GSS cycles as well as homicide data demonstrated that Aboriginal people are over-represented as
victims of crime (Miladinovic and Mulligan 2015; Perreault and Hotton Mahoney 2012). The 2014 GSS data also revealed
higher violent victimization rates for Aboriginal people living in the territories than for their non-Aboriginal counterparts
(215 incidents per 1,000 Aboriginal people compared with 121 per 1,000 non-Aboriginals) (Table 3).
However, similar to 2014 provincial findings, Aboriginal identity was no longer associated with a risk of violent victimization
when all other risk factors were taken into account (see Model 1 for significant risk factors). As such, the differences between
Aboriginal people and non-Aboriginal people may have more to do with the relatively higher presence of risk factors among
Aboriginal people.
Household victimization
As with violent victimization, certain characteristics of households can be associated with relatively high rates of household
victimization, that is break and enter, theft of motor vehicle or parts, theft of household property or vandalism. This section
highlights the main household characteristics that were linked with higher victimization rates in the territories. It should be
noted that no multivariate analysis was performed for household victimization. As such some of these characteristics may not
be risk factors if all other risk factors were controlled for.6
Low social cohesion was associated with higher rates of household victimization
As was observed with violent victimization, higher household victimization rates in the territories were associated with certain
indicators of low social cohesion. For example, the household victimization rate was nearly double in households located in
neighbourhoods where people do not help each other (417 per 1,000 households compared with 223 per 1,000).
Statistics Canada—Catalogue no. 85-002-X12
Juristat Article—Criminal victimization in the territories, 2014
Similarly, the victimization rate was higher among households located in an area where neighbours are unlikely to call the
police if they witness a criminal act (411E
incidents per 1,000 households) and among those that report social disorder
(416 per 1,000 households) (Table 5).
Renters recorded higher rates of household victimization
In 2014, tenant households reported higher victimization rates than those who owned their dwelling. Specifically, the
household victimization rate was 309 per 1,000 tenant households, compared with 205 per 1,000 owner households
(Table 5). The same trend was observed in the provinces.
Moreover, households that had occupied their dwelling for less than three years reported a higher victimization rate than
those who had lived in their dwelling longer (299 per 1,000 households compared with 232 per 1,000).7
Text box 3
Differences between GSS data on victimization and police-reported data
Although the data from the GSS on Victimization and the Uniform Crime Reporting (UCR) Survey both capture information on
crime in Canada, the two surveys have many differences including survey type, scope, coverage and source of information.
As such, numbers from these two surveys should not be directly compared and trends should be compared with caution.
The GSS is a sample survey which, in 2014, collected data from more than 2,000 (in addition to about 33,000 in the
provinces) non-institutionalized individuals aged 15 years and older living in the three territories. The GSS collects data on
eight types of offences but excludes crimes targeting businesses or institutions. One of the main advantages of the GSS is
that it captures information on criminal incidents that do not come to the attention of the police, which is sometimes referred
to as the “dark figure” of crime (see the Survey description section for more information on the GSS). In comparison, the UCR
is an annual census of all offences under the Criminal Code and certain other federal laws that come to the attention of the
police and are reported by them to Statistics Canada.
Spousal violence
In the 2014 GSS on victimization, respondents who were married or living in a common-law relationship at the time of the
survey, or who had been in contact with their ex-spouse or ex-common-law partner during the five years preceding the
survey, were asked a series of questions about their experiences with spousal violence in the past five years.
The questions measure both physical and sexual violence, as defined by the Criminal Code and which could be acted upon
by police. This includes threats of violence against the victim or the act of being pushed, grabbed, shoved, slapped, kicked,
bitten, hit, beaten, choked, threatened with a gun or knife or forced into sexual activity.
Unlike most violent crime, spousal violence may be part of a pattern of ongoing abuse. As such, incident characteristics, risk
factors and consequences for the victims may differ along with the type of violence (Douglas and Otto 2010). While the rates
presented in the previous sections included both spousal8
and non-spousal violence, the remainder of this report examines
them separately.
More than one in ten people with a current or former spouse or partner living in the territories reported spousal
violence in the previous five years
According to the 2014 GSS, nearly two-thirds of residents of the territories aged 15 and over—approximately 58,000
people—were either married or in a common-law relationship or had been in contact with their ex-partner in the previous five
years. Of these people, just over 1 in 10 (12%) reported being the victim of some form of spousal violence on at least one
occasion in the five years preceding the survey, representing approximately 7,000 victims (Table 6).
The proportion of spousal violence victims in the territories is relatively similar to that observed in 2009 (10%) (Chart 6),
which contrasts with the situation observed in the provinces, where the rate of spousal violence was lower for the same
period (from 6% in 2009 to 4% in 2014). The proportion of spousal violence victims varied from 7%E
in Yukon to 16% in
Nunavut.9
Statistics Canada—Catalogue no. 85-002-X 13
Juristat Article—Criminal victimization in the territories, 2014
In addition to physical or sexual violence, nearly one-quarter (23%) of the territories’ spousal population reported having been
the victim of psychological or financial abuse. While this form of abuse is not used to calculate rates of spousal violence, it
nonetheless provides a better understanding of the context in which spousal violence occurs, since 81% of spousal violence
victims also reported being the victims of psychological and financial abuse.
Almost one-third of victims suffered the most severe types of spousal violence
Half of spousal violence victims in the territories (50%) reported experiencing more than one incident of spousal violence
during the previous five years, and close to one victim in five (18%E
) reported being the victim of at least 10 incidents during
this same period.
The violence reported by victims took various forms, from those that could be considered to be less severe (such as being
threatened, having an object thrown at oneself, or being pushed or slapped) to the most severe forms (such as being beaten,
choked, threatened with a gun or knife or sexually assaulted). Just over 4 out of 10 victims (43%) reported having
experienced solely the less severe forms of spousal violence. However, approximately 3 in 10 (32%E
) reported having been
the victim of the most severe types of violence (Chart 7).
Statistics Canada—Catalogue no. 85-002-X14
Juristat Article—Criminal victimization in the territories, 2014
Those who were the victims of several incidents of spousal violence were more likely to report having experienced the most
severe types of violence. For example, close to two-thirds (66%E
) of those who were victims at least 10 times reported
experiencing the most severe forms of spousal violence, compared with less than one-quarter (24%E
) of the victims who
reported three or fewer incidents.
Aboriginal people over-represented among spousal violence victims in the territories
As in 2009, Aboriginal people were over-represented among victims of spousal violence in the territories, particularly with
respect to its most severe forms. In 2014, Aboriginal people represented just under half (49%) of the spousal population of
the territories, but three-quarters (75%) of victims of spousal violence in the previous five years. Further, Aboriginal people
represented 93% of victims of the most severe forms of spousal violence, that is, having been beaten, choked, threatened
with a weapon or sexually assaulted.
Drug use associated with risk of spousal violence
Drug use, either by the victim or the spouse, was strongly associated with spousal violence in the territories. People who
stated that they used drugs during the month preceding the survey were more than three times more likely than non-drug
users to have experienced spousal violence in the previous five years (29% compared with 9%) (Table 6).
Similarly, nearly one-third (32%E
) of those whose current spouse used drugs in the previous month were victims of spousal
violence in the past five years, compared with 6%E
of those whose spouse did not use drugs.
Alcohol use was also associated with spousal violence, but to a lesser extent. Among those who reported engaging in at
least one binge drinking episode—that is, at least five alcoholic drinks on a single occasion—during the previous month, one
in six (16%) had been a victim of spousal violence during the past five years, compared with 10% of those who did not
engage in binge drinking.
Statistics Canada—Catalogue no. 85-002-X 15
Juristat Article—Criminal victimization in the territories, 2014
People who suffered childhood maltreatment were more likely to be victims of spousal violence
In 2014, the GSS included questions about abuse that Canadians may have suffered when they were under the age of 15
(see Text box 2). Several studies have shown a link between abuse experienced during childhood and victimization in
adulthood, particularly spousal violence (Franklin and Kercher 2012; Parks et al. 2011; Desai et al. 2002).
Those who had been victims of violence during their childhood were more likely to report having experienced spousal
violence in the five years preceding the survey. In the territories, nearly one-quarter (24%E
) of those who suffered sexual
abuse during childhood reported being a victim of spousal violence in the five years preceding the survey. This proportion
was 19% for those who experienced physical abuse during childhood, and 8% for those who suffered no abuse during
childhood (Table 6). Overall, more than half (56%) of victims of spousal violence were victims of child abuse.
One-half of spousal violence cases in the territories witnessed by children
In addition to direct violence suffered in childhood, indirect violence—that is, witnessing violence as a child—is thought to be
associated with a greater risk of experiencing spousal violence in adulthood (Franklin and Kercher 2012). Data from the 2014
GSS indicate an association between witnessing violence in childhood and experiencing spousal violence. People who,
during their childhood, witnessed parental violence toward another parent or adult were more than twice as likely to have
been a victim of spousal violence (22%E
compared with 9%).
Research has shown that children who have witnessed violence are more likely to develop certain psychological disorders
(Levendosky et al. 2013; Ellonen et al. 2013), display anti-social behaviours in adolescence (Sousa et al. 2011; Johnson and
Dauvergne 2001) or become offenders themselves in adulthood (Franklin and Kercher 2012). For these reasons, it is
important to not only consider the direct victims of spousal violence, but also the children who may have witnessed it.
According to the 2014 GSS data, this is all the more important since spousal violence was more prevalent in couples with
children. In 2014, 10% of people who were married or living common-law and had children under the age of 15 in the
household were victims of spousal violence, compared with 6%E 10
of those without children. Similarly, 40% of those who had
children with their ex-spouse or common-law partner were the victims of violence at the hands of that person, compared with
14%E
of those who had no children with their ex-spouse or common-law partner.
In approximately half of the cases of spousal violence in which there were children in the household, the victim reported that
at least one child had witnessed the violence.
One-half of spousal violence victims suffered injuries
Approximately one-half (49%) of victims of spousal violence in the five years preceding the survey reported sustaining
injuries on at least one occasion due to the violence, a proportion higher than that recorded in the provinces (31%) (Chart 8).
Statistics Canada—Catalogue no. 85-002-X16
Juristat Article—Criminal victimization in the territories, 2014
The proportion of victims sustaining injuries ranged from 56% among female victims to 42%E
among male victims. However,
this difference was not statistically significant.
There were also variations among the territories in the proportions of victims who sustained injuries. For example, Nunavut
was the territory where residents with a spouse or common-law partner (current or ex) were the most likely to report being
victim of spousal violence causing injuries.11
The majority of spousal violence victims were affected emotionally
In addition to physical injuries, spousal violence victims can be affected emotionally or psychologically. The majority of
victims reported being affected emotionally in some way, while only 12%E
said they were not much affected or not at all
affected. The most common reactions were feeling upset (32%E
), angry (27%) or hurt or disappointed (24%E
) (Chart 9).
Statistics Canada—Catalogue no. 85-002-X 17
Juristat Article—Criminal victimization in the territories, 2014
In 2014, victims who reported being affected emotionally by violence were asked a series of four questions on the long-term
effects of violence. These questions were taken from the Primary Care PTSD Screen (PC-PTSD) tool (see Text box 4). In the
territories, more than one-third of victims of spousal violence reported feeling at least one of these effects in the month
preceding the survey.
Text box 4
Post-Traumatic Stress Disorder
Some research to date has found that victims of violence may experience Post Traumatic Stress Disorder (PTSD), which can
affect individuals that have experienced physical and/or psychological trauma, and is characterized by feelings of
detachment, being constantly on guard, nightmares and avoidance behaviors. Studies of those affected have found that
PTSD is associated with impaired physical health, decreased quality of life and increased mortality (Prins et al. 2003).
Victims were asked whether they had experienced the following as a result of their victimization:
In the past month have you:
1. Had nightmares about it or thought about it when you did not want to?
2. Tried hard not to think about it or went out of your way to avoid situations that reminded you of it?
3. Felt constantly on guard, watchful or easily startled?
4. Felt numb or detached from others, activities or your surroundings?
These new questions included in the GSS are from the Primary Care PTSD Screen (PC-PTSD) tool, a front-line assessment
tool used to identify individuals who should be referred to further psychological and psychiatric treatment for the disorder
(Prins et al. 2003). The tool is designed to assess whether an individual demonstrates key affects related to the core PTSD
symptoms of re-experiencing, numbing, avoidance and hyperarousal. If an individual answers ‘yes’ to any three of the four
questions, the presence of PTSD is suspected. It is crucial to note that the PC-PTSD is not a diagnostic tool, and a suspicion
of PTSD is not the same as a diagnosis. In a clinical setting, a positive score on the PC-PTSD would indicate that the patient
should be referred for more in-depth assessment and possible diagnosis.
Statistics Canada—Catalogue no. 85-002-X18
Juristat Article—Criminal victimization in the territories, 2014
Close to half of spousal violence cases in the territories were reported to police
In almost half (49%) of cases of spousal violence, the abuse was reported to the police. This proportion was almost twice as
high as what was recorded in the provinces (29%).
Contrary to non-spousal violence, the police were almost as likely to have been alerted personally by the victim (25%) rather
than through another means (24%). On average, the police were notified after the fourth incident of spousal violence.
Spousal violence was more likely to be brought to the attention of police in the Northwest Territories (61%) or Nunavut (50%)
than in Yukon (23%E
).
Nearly one-quarter of spousal violence victims used victim assistance services
In addition to assistance from the police, victims of spousal violence may be able to turn to a number of services for victims,
including crisis centres, shelters, victim assistance programs, psychologists and social workers. Just under one-quarter
(23%) of spousal violence victims in the territories used at least one of these services. About two-thirds of victims who did not
make use of these services stated that they did not want or need assistance.
Characteristics of violent incidents
In the 2014 GSS, violent crime victims were asked to provide details on the nature of the incidents they had experienced.
This information can provide a better understanding of the context in which violent incidents occur. Spousal violence is
excluded from the analysis below, as it was addressed in the previous section.
Most offenders were men
Similar to what was observed in the provinces and to findings from police-reported data, the majority of offenders (77%) were
male. For the most part, the offenders were also relatively young; according to the victims, 80% of the offenders were under
the age of 45 and 33%E
were under 25 years (Table 7).
Violence is often related to alcohol or drug use by the offender
Not only are alcohol and drug use associated with an increased risk of violent victimization, but according to the victims,
violent incidents are often linked to alcohol or drug use by the offender. Close to two-thirds (63%) of victims of violent crime
said this was the case in their situation (Table 7).
Most violent incidents do not involve a weapon
The presence of a weapon is an element that can be used to measure the seriousness of a crime. For example, the presence
of a weapon is one of the criteria used to classify the different levels of physical assault and sexual assault under the
Criminal Code. In 2014, just over one-quarter (27%E
) of victims of non-spousal violent crimes reported the presence of a
weapon during the incident (Table 7). This proportion is relatively similar to that observed in 2009.
Less than one-third of violent incidents occurred in a private residence
Less than one-third (31%E
) of violent incidents occurred in a private residence, either the victim’s or another person’s. Most
incidents (65%) occurred in a commercial or institutional establishment or in a public place. Furthermore, one violent incident
in five (20%E
) occurred at the victim’s place of work (Table 7).
Consequences of victimization
Victimization can have multiple consequences, from physical injury to psychological effects and financial loss. The scope of
the consequences can, in fact, help assess the seriousness of a crime. Information on the consequences of victimization is
also helpful in determining victims’ needs. The consequences of spousal violence are excluded from the following analysis
since they were addressed previously.
Statistics Canada—Catalogue no. 85-002-X 19
Juristat Article—Criminal victimization in the territories, 2014
Decrease in the proportion of violent crimes causing injury
According to the 2014 GSS in the territories, approximately one in six (16%E
) victims of violent crime, excluding spousal
violence, reported having sustained injuries as a result of the incident. Five years earlier, this proportion was more than
double (36%). Yukon residents were the least likely to report injuries, with the majority (93%) having sustained none
(Table 7). By comparison, this proportion was 73% in Nunavut. In addition to the presence of a weapon, causing injury is
another criterion that can be used to classify the different levels of physical assault and sexual assault under the
Criminal Code.
Nearly two-thirds of victims reported being affected emotionally
Nearly two-thirds of the victims (63%) reported having been affected emotionally by the incident. This proportion was
somewhat higher for household crime (68%) than it was for theft of personal property (58%).12
The most common emotional reactions included feeling angry (26%), upset, confused or frustrated (21%), annoyed (8%E
) or
hurt or disappointed (8%E
) (Chart 10).
A quarter of victims experienced long-term effects
In 2014, victims who said that they had been emotionally affected were asked subsequent questions on the long-term effects
of victimization (see Text box 4). Nearly one-quarter (24%) of all victims in the territories reported experiencing at least one of
these effects. However, this proportion was higher among violent crime victims (37%) than household crime victims (21%E
).
Just over 1 victim in 20 reported experiencing at least three of these effects, indicating that post-traumatic stress disorder is
suspected (Chart 11).
Statistics Canada—Catalogue no. 85-002-X20
Juristat Article—Criminal victimization in the territories, 2014
Overall, the long-term effect mentioned most often was being on guard and easily startled (16%E
). However, among violent
crime victims, the effect mentioned most often was trying hard not to think about the incident and going out of their way to
avoid situations that reminded them of it (28%E
).
More than one in six victims had to take time off from their daily activities due to the incident
As a result of the incident they experienced, some victims were unable to continue their daily activities for at least one day,
because they needed to receive care for an injury, recover emotionally, replace stolen property, take legal action or for some
other reason. This was the case for 17% of victims in the territories in 2014.
Women (22%) were more likely than men (13%) to be unable to continue their daily activities. The same could be said for
Aboriginal people (23%) compared with non-Aboriginal people (12%). Overall, the median time that victims were absent from
daily activities was three days, but this increased to seven days for victims of violent crimes.
Six in ten victims suffered financial loss
Financial loss is another consequence that victims often experience. In 2014, 6 in 10 victims (60%) in the territories reported
financial losses. Victims of household crime (87%) and of theft of personal property (84%) were the most likely to report
losses.
Among those victims who reported losses and who were able to establish the amounts, most (82%) reported losses of under
$1,000.
Statistics Canada—Catalogue no. 85-002-X 21
Juristat Article—Criminal victimization in the territories, 2014
Reporting to police
Reporting to police increased in the territories
In 2009, less than one-third (30%) of criminal incidents in the territories were reported to the police. However, by 2014, this
proportion had risen to 36%. By comparison, in the provinces the overall rate of reporting to the police remained relatively
stable during the same period.
The increase in reporting in the territories was mainly attributable to a rise in the reporting rate for incidents of household
victimization, which increased from 30% in 2009 to 38% in 2014. The rate of reporting violent incidents, which rose from 31%
to 42%, also contributed to the overall increase, though the difference from 2009 was not statistically significant. The rate of
reporting thefts of personal property remained stable (Table 8 and Chart 12).
Reporting rates varied slightly from one territory to another, without any statistically significant differences.
Most incidents not reported to the police were considered by the victim as being too minor to report
Several reasons can lead a person to decide whether to report a criminal incident to the police. In the GSS, respondents who
did not report an incident were asked about their reasons for not doing so.
The most common reason cited (78%) for not reporting an incident to the police in the territories was that it was too minor to
be worth reporting. This proportion was lower in Nunavut (70%), though it was still the most frequently cited reason by victims
in that territory (Table 9).
The other most common reasons were that the police would not consider the incident important enough (68%), that it was a
personal matter (50%), that no one was harmed or there was no financial loss (49%), that there was a lack of evidence (47%)
or that they would not be able to find the property or identify the offender (46%).
Statistics Canada—Catalogue no. 85-002-X22
Juristat Article—Criminal victimization in the territories, 2014
Conversely, the most common reasons cited for reporting to police was because of a sense of duty (61%), to arrest and
punish the offender (45%) or to receive protection or stop the incident (43%).13
Few victims in the territories used victim services
Very few victims made use of formal victim services, such as shelters, crisis centres, help lines, support programs for victims
or those who have witnessed criminal acts or social workers. Victims made use of this type of service in only 5%E
of cases.
The most common reasons cited by victims for not using formal victim services was that they thought they didn’t need or
didn’t want help (61%), the incident was too minor (23%), they didn’t know about any of these services (5%E
) or because
none were available (4%E
).14
Conversely, the majority (92%) of victims confided in someone, most often a friend or neighbour (72%), family member (70%)
or colleague (47%).
Perception of safety, crime and the justice system
Most residents of the territories satisfied with their personal safety from crime
In addition to the study of victims, the 2014 GSS looked at perceptions of personal safety among the residents in the
territories, whether or not they had been the victim of a crime. Overall, the majority (87%) of residents reported that they were
either very satisfied or satisfied with their personal safety from crime, while 4% reported that they were either dissatisfied or
very dissatisfied. Yukon residents were slightly more likely to report being very satisfied with their personal safety from crime
when compared with Nunavut residents (38% and 31%, respectively) (Table 10).
Research has found that women report a greater fear of victimization relative to men, usually stemming from feelings of
vulnerability (Ambrey et al. 2014; Snedker 2015). The 2014 GSS asked respondents about their feelings of safety in specific
situations, such as when walking alone at night.
The results show even greater differences between females and males when asked those specific questions. For example,
about one-third (34%) of females residing in the territories reported feeling very safe walking alone at night, compared with
almost two-thirds (62%) of males. Of note, when respondents were asked about their overall satisfaction with their personal
safety, 90% of males reported being satisfied with their personal safety, compared to 83% of females.
Those victimized during childhood were less likely to report being satisfied with their personal safety
Research has shown a relationship between childhood abuse and long-term adverse consequences for victims, such as
lower feelings of safety (Cashmore and Shackel 2013; Desai et al. 2002; Walsh et al. 2010). Results from the 2014 GSS are
in line with these studies, especially with regard to satisfaction with personal safety from crime. People in the territories who
had been victimized during childhood were less likely to report feeling very satisfied with their personal safety (28%)
compared to those who had not been victimized during childhood (38%).
When asked about their perception of how well their local police were doing in ensuring the safety of citizens in their area,
those who had been both physically and sexually victimized during childhood were more likely than those who had not been
victimized to report that their local police were doing a poor job (17% and 7%, respectively).
Aboriginal residents in the territories less satisfied with their personal safety from crime
Overall, Aboriginal people living in the territories were somewhat less likely than non-Aboriginal people to report feeling very
satisfied with their personal safety from crime (31% and 36%, respectively).15
This difference was the largest for Yukon
residents, with 28% of Aboriginal people reporting feeling very satisfied with their personal safety from crime compared to
42% of non-Aboriginal people.
Some research has found that a weaker sense of belonging to the community is associated with increased fear of
victimization (Mason et al. 2013). However, this did not appear to be the case in the territories, where Aboriginal people were
more likely to report a very strong sense of belonging to their local community in comparison to non-Aboriginal people (40%
compared to 24%, respectively).
Despite reporting lower feelings of safety and higher rates of victimization (Perreault 2015; Perreault 2011; Brennan 2011),
Aboriginal people in the territories were less likely than non-Aboriginal people to think that crime was higher in their
Statistics Canada—Catalogue no. 85-002-X 23
Juristat Article—Criminal victimization in the territories, 2014
neighbourhood than elsewhere in Canada (6% compared to 10%). This was particularly true in Nunavut, where 8% of
Aboriginal people thought crime in their neighbourhood was higher than elsewhere in Canada, compared to 47% of non-
Aboriginal people.
Majority of territorial residents believed crime in their community was lower than elsewhere in Canada
Neighbourhood characteristics may play a role in shaping residents’ perceptions of crime (Wu et al. 2009). Respondents to
the 2014 GSS were asked a series of questions about the characteristics of their community, including whether they thought
that crime in their community was higher or lower than other communities in Canada, whether they thought that their
neighbours would call the police if they witnessed criminal behaviour, their level of trust in their neighbours, and their sense of
belonging to their local community.
There were some differences in the perception of neighbourhood crime across the territories. Three-quarters of residents of
Yukon thought crime was lower in their community than elsewhere in Canada, a proportion similar to that observed in the
provinces (74%) but higher than that recorded in Nunavut (53%) (Table 10).
Respondents who reported that they thought their community had a higher amount of crime than elsewhere in Canada were
less likely to report feeling very safe when walking alone at night compared to respondents who thought that their community
had a lower amount of crime (18%E
versus 55%).
Half of Nunavut residents report signs of social disorder in their community
Fear of victimization can be linked to residents’ perceptions of social disorder in their communities (Ross and Jang 2000).
Respondents to the 2014 GSS were asked a series of questions about their perception of social disorder in their community.
Overall, 41% of residents of the territories reported that at least one type of social disorder was a big or moderate problem in
their neighbourhood. More specifically, residents of Nunavut were the most likely to report at least one sign of social disorder,
while residents of Yukon were the least likely (50% versus 28%, respectively) (Table 10).
Of the seven types of social disorder measured by the GSS, the most commonly reported by territorial residents included:
people being drunk or rowdy in public places (26%), people dealing or using drugs (22%), garbage or litter lying around
(16%) and vandalism, graffiti and other deliberate damage to property or vehicles (15%).
Confidence in the police increased since 2009
As part of the 2014 GSS, respondents were asked a series of questions about their confidence in the criminal justice system,
such as the police or the criminal courts.
Overall, 83% of territorial residents reported having confidence in their local police, up from 71% in 2009. More precisely over
one-third (36%) reported having a great deal of confidence, up from 22% in 2009, and 46% reported having some confidence
(Table 11).
The largest increases were found in Yukon, where 85% reported having confidence in their police in 2014, compared to 69%
in 2009, and in the Northwest Territories (85% compared to 74%). Residents of Nunavut were the least likely to report having
confidence in their local police (76% compared to 85% in both Yukon and the Northwest Territories).16
In addition to the question on overall confidence in the police, the GSS on victimization also asked Canadians whether they
believe their local police are doing a good job, an average job, or a poor job at a number of specific activities. In general,
most people in the territories thought their police were doing a good or average job. This was particularly true for being
approachable and easy to talk to, where 64% of residents thought their police were doing a good job and 22% thought they
were doing an average job.
However, 17% thought their local police were doing a poor job at informing the public on prevention and 16% thought local
police were doing a poor job at promptly responding to calls. In addition, 12% of residents in Canada’s territories reported
that they thought their local police were doing a poor job in treating people fairly, down from 15% in 2009.
Confidence in police lower among Aboriginal people
In general, Aboriginal people in the territories were less likely to have positive opinions of their local police. For example,
those who identified as being Aboriginal were less likely to report having a great deal of confidence in the police compared to
those who did not identify as being Aboriginal (30% compared with 43%, respectively).
Statistics Canada—Catalogue no. 85-002-X24
Juristat Article—Criminal victimization in the territories, 2014
Moreover, less than half (49%) of Aboriginal people thought that the police were doing a good job of treating people fairly,
compared with 56% of non-Aboriginal people. Similar differences were found with respect to the enforcing of laws, promptly
responding to calls, being approachable and easy to talk to, and ensuring the safety of the citizens in the neighbourhood
(Table 11).
In the past, it has been found that people who have had, for any reason, a contact with the police tended to have a more
negative perception of police (Perreault and Hotton Mahoney 2012). Overall, 43% of Aboriginal people in the territories
reported that they had, for one reason or another, contact with the police in the preceding 12 months. This proportion was
similar among non-Aboriginal people living in the territories (40 %).
Compared to their non-Aboriginal counterparts, Aboriginal people in the territories were more likely to report having had
contact with the police for being arrested or for problems with their emotions, mental health or alcohol or drug use or for a
family member’s experiences with these issues (19% compared to 3%).
Summary
For many years, police data have indicated that police-reported crime is higher in the territories than in the provinces. Data
from the 2014 GSS on victimization, which include crimes reported to the police as well as unreported crimes also shows
higher victimization rates in the territories.
Nonetheless, victimization rates in the territories fell between 2009 and 2014, with a 29% decrease in violent victimization
and a 34% decrease in household victimization. These decreases were mainly attributable to the decreases recorded in
Yukon, the territory that also recorded the lowest victimization rates in 2014. However, contrary to what was observed in the
provinces, where the rate of spousal violence dropped from 6% in 2009 to 4% in 2014, the spousal violence rate in the
territories remained relatively stable during this time period.
Despite relatively high victimization rates, most residents of the territories reported being satisfied with their personal safety
and generally had a positive opinion of their police service. As well, the rate of reporting to the police recorded in 2014 (36%)
was higher than the rate observed in 2009 (30%).
Survey description
In 2014, Statistics Canada conducted the victimization cycle of the General Social Survey (GSS) for the sixth time in the
provinces. Previous cycles were conducted in 1988, 1993, 1999, 2004 and 2009. The purpose of the survey is to provide
data on Canadians’ personal experiences with eight offences, examine the risk factors associated with victimization, examine
rates of reporting to the police, assess the nature and extent of spousal violence, measure fear of crime, and examine public
perceptions of crime and the criminal justice system.
The 2014 survey on victimization was also conducted in Yukon, Northwest Territories and Nunavut using a different sampling
design. The GSS on victimization was also conducted in the territories in 2009 and was preceded by test collections in 1999
and 2004.
The target population included all persons 15 years and older in the three territories, excluding full-time residents of
institutions. Once a household was contacted, an individual 15 years or older was randomly selected to respond to the
survey.
In 2014, the sample size was 2,040 respondents, about twice the number of respondents in 2009 (1,094).
Data collection
Data collection took place from August 2014 to January 2015 inclusively.
The method of collection was a mixture of telephone (CATI) and personal interviews (CAPI). Most cases started as CATI at
the regional office and could be transferred to a CAPI-interviewer depending on the community and collection constraints.
Respondents were interviewed in the official language of their choice.
Statistics Canada—Catalogue no. 85-002-X 25
Juristat Article—Criminal victimization in the territories, 2014
Response rates
The overall response rate was 58.7%, up from 50.7% in 2009. Non-respondents included people who refused to participate,
could not be reached, or could not speak English or French. Respondents in the sample were weighted so that their
responses represent the non-institutionalized territories population aged 15 and older.
Data limitations
As with any household survey, there are some data limitations. The results are based on a sample and are therefore subject
to sampling errors. Somewhat different results might have been obtained if the entire population had been surveyed. This
article uses the coefficient of variation (CV) as a measure of the sampling error. Estimates with a high CV (over 33.3%) were
not published because they were too unreliable. In these cases, the symbol “F” is used in place of an estimate in the figures
and data tables. Estimates with a CV between 16.6 and 33.3 should be used with caution and the symbol “E” is used. Where
descriptive statistics and cross-tabular analyses were used, statistically significant differences were determined using 95%
and 90% confidence intervals.
References
Allen, M. and S. Perreault. 2015. “Police-reported crime in Canada's Provincial North and Territories, 2013.” Juristat. Vol. 35,
no. 1. Statistics Canada Catalogue no. 85-002-X.
Ambrey, C.L., Fleming C.M. and M. Manning. 2014. “Perceptions or reality, what matters most when it comes to crime in your
neighbourhood?” Social Indicators Research. Vol. 119, no. 2. p. 877-896.
Boyce, J. 2015. “Mental health and contact with police in Canada, 2012.” Juristat. Vol. 35, no. 1. Statistics Canada
Catalogue no. 85-002-X.
Brennan, S. 2011. “Violent victimization of Aboriginal women in the Canadian provinces, 2009.” Juristat. Vol. 30, no. 2.
Statistics Canada Catalogue no. 85-002-X.
Brown, B.B., Perkins D.D. and G. Brown. 2004. “Incivilities, place attachment and crime: Block and individual effects.” Journal
of Environmental Psychology. Vol. 24. p. 359- 371.
Cantos VII, O.D. 2006. “We can do better: Supporting crime victims with disabilities.” Networks. Summer/Fall 2006. National
Center for Victims of Crime. USA.
Cashmore, J. and R. Shackel. 2013. “The long-term effects of child sexual abuse.” Child family Community Australia.
Paper no. 11. Australian Institute of Family Studies.
Charron, M. 2009. “Neighbourhood characteristics and the distribution of police-reported crime in the city of Toronto.” Crime
and Justice Research Paper Series. No. 18. Statistics Canada Catalogue no. 85-561-M.
Desai, S., Arias I., Thompson M.P. and K.C. Basile. 2002. “Childhood victimization and subsequent adult revictimization
assessed in a nationally representative sample of women and men.” Violence and Victims. Vol. 17, no. 6. p. 639-653.
Douglas, K.S. and R.K Otto. 2010. Handbook of Violence Risk Assessment. Routledge.
Ellonen, N., Piispa M., Peltronen K. and M. Oranen. 2013. “Exposure to parental violence and outcomes of child psychosocial
adjustment.” Violence and Victims. Vol. 28, no. 1. p. 3-15.
Forrest, R. and A. Kearns. 2001. “Social cohesion, social capital and the neighborhood.” Urban Studies. Vol. 38. p. 2125-2143.
Franklin, C.A. and G.A. Kercher. 2012. “The intergenerational transmission of intimate partner violence: Differentiating
correlates in a random community sample.” Journal of Family Violence. Vol. 27, no. 3. p. 187-199.
Johnson, H. and M. Dauvergne. 2001. “Children witnessing family violence.” Juristat. Vol. 21, no. 6. Statistics Canada
Catalogue no. 85-002-X.
Levendosky, A.A., Bogat G.A. and C. Martinez-Torteya. 2013. “PTSD symptoms in young children exposed to intimate
partner violence.” Violence Against Women. February.
Lilly, J.R., Cullen F.T. and R.A. Ball. 2014. Criminological Theory, Context and Consequences. Sage publications. London.
Mason, P., Kearns A. and M. Livingston. 2013. “Safe going: The influence of crime rates and perceived crime and safety in
deprived neighbourhoods.” Social Science & Medicine. Vol. 91. August. p. 15-24.
Mihorean, K., Besserer S., Hendrick D., Brzozowski J., Trainor C. and S. Ogg. 2001. A Profile of Criminal Victimization:
Results of the 1999 General Social Survey. Statistics Canada Catalogue no. 85-553-X.
Miladinovic, Z. and L. Mulligan 2015. “Homicide in Canada, 2014.” Juristat. Vol. 35, no. 1. Statistics Canada Catalogue no. 85-002-X.
Statistics Canada—Catalogue no. 85-002-X26
Juristat Article—Criminal victimization in the territories, 2014
Parks, S.E., Kim K.H., Day N.L., Garza M.A. and C.A. Larkby. 2011. “Lifetime self-reported victimization among low-income,
urban women: The relationship between childhood maltreatment and adult violent victimization.” Journal of Interpersonal
Violence. Vol. 6, no. 6. p. 1111-1128.
Perreault, S. 2009. “Criminal victimization and health: A profile of victimization among persons with activity limitations or other
health problems.” Canadian Centre for Justice Statistics Profile Series. No. 21. Statistics Canada Catalogue no. 85-033-X.
Perreault, S. 2011. “Violent victimization of Aboriginal people in the Canadian provinces, 2009.” Juristat. Vol. 31, no. 1.
Statistics Canada Catalogue no. 85-002-X.
Perreault, S. 2015. “Criminal victimization in Canada, 2014.” Juristat. Vol. 35, no. 1. Statistics Canada Catalogue no. 85-002-X.
Perreault, S. and S. Brennan. 2010. “Criminal victimization in Canada, 2009.” Juristat. Vol. 30, no. 2. Statistics Canada
Catalogue no. 85-002-X.
Perreault, S. and T. Hotton Mahoney. 2012. “Criminal victimization in the territories, 2009.” Juristat. Vol. 32, no. 1. Statistics
Canada Catalogue no. 85-002-X.
Prins, A., Ouimette P., Kimberling R., Cameron R.P., Hugelshofer D.S., Shaw-Hegwer J., Thraikill A., Gusman F.D. and J.I.
Sheikh. 2003. “The Primary Care PTSD screen (PC-PTSD): Development and operating characteristics.” Primary Care
Psychiatry. Vol. 9, no. 1. p. 9-14.
Reid, J.A. and C.J. Sullivan. 2009. “A model of vulnerability for adult sexual victimization: The impact of attachment, child
maltreatment and scarred sexuality.” Violence and Victims. Vol. 24, no. 4. p. 485-501.
Ross C.E. and S.J. Jang. 2000. “Neighborhood disorder, fear, and mistrust: the buffering role of social ties with neighbors.”
American Journal of Community Psychology. Vol. 28, no. 4. p. 401-420.
Sampson, R.J. 2012. The Great American City: Chicago and the Enduring Neighborhood Effect. University of Chicago Press.
Snedker, K.A. 2015. “Neighborhood conditions and fear of crime: a reconsideration of sex differences.” Crime & Delinquency.
Vol. 61, no. 1. p. 45-70.
Sousa C., Herrenkohl T.I., Moylan C.A., Tajiman E.A., Klika J.B., Herrenkohl R.C. and M.J. Russo. 2011. “Longitudinal study
on the effects of child abuse and children’s exposure to domestic violence, parent-child attachments, and antisocial behavior
in adolescence.” Journal of Interpersonal Violence. Vol. 26, no. 11. p. 111-136.
Walsh, K., Fortier M.A. and D. DiLillo. 2010. “Adult coping with childhood sexual abuse: A theoretical and empirical review.”
Aggression and Violent Behavior. Vol. 15, no. 1. p. 1-13.
Wu, Y., Sun I.Y. and R.A. Triplett. 2009. “Race, class or neighborhood context: Which matters more in measuring satisfaction
with police?” Justice Quarterly. Vol. 26, no. 1. p. 125-156.
Notes
E
use with caution
1. Unless otherwise indicated, the differences presented in the text of this report are statistically significant at p < 0.05.
2. The difference from 2009 was only significant at p < 0.1.
3. The difference compared to the overall territorial rate was only significant at p < 0.1.
4. The difference compared to the overall territorial rate was only significant at p < 0.1.
5. For victims reporting more than one incident of abuse, the relationship to the person who committed the most serious
incident was requested.
6.Given the limited number of household characteristics associated with higher household victimization rates—particularly
due to the fact that some questions, like those pertaining to the type of housing, were not asked in the territories—a
multivariate analysis was not conducted on household victimization. As such, some factors may not be directly linked to risk
of victimization if other factors were to be considered.
7. Difference significant at p < 0.1.
8. Data in previous sections included sexual assaults and physical assaults between spouses in the 12 months preceding the
survey.
9. The rate of spousal violence in Nunavut was significantly higher only when compared to Yukon. The differences compared
to the Northwest Territories or the territories’ average were not statistically significant (p < 0.1).
10. Difference significant at p < 0.1.
11. In Nunavut, 10% of residents with a spouse or common-law partner (current or ex) were victims of spousal violence
causing injuries (16% of the spousal population having been victims of spousal violence and 62%E
of those victims having
Statistics Canada—Catalogue no. 85-002-X 27
Juristat Article—Criminal victimization in the territories, 2014
been injured). This proportion is statistically different from the corresponding proportion for the territories as a whole (6%E
).
When considering the proportion of those injured among victims rather than among the spousal population, as in Chart 8, no
differences were found to be statistically significant (p < 0.1) between territories.
12. Difference significant at p < 0.1.
13. Respondents were able to give more than one reason.
14. Respondents were able to give more than one reason.
15. Difference was significant at p < 0.1.
16. Due to rounding, categories in Table 11 may not exactly add up to numbers presented in the text.
Statistics Canada—Catalogue no. 85-002-X28
Juristat Article—Criminal victimization in the territories, 2014
Detailed data tables
Table 1
Victimization incidents, by type of offence and territory, 2009 and 2014
Type of offence
Yukon Northwest Territories Nunavut1
All territories
2009 2014 2009 2014 2009 2014 2009 2014
number
Violent victimization
Sexual assault2
F F F F F F 3,637E
2,647E
Robbery F F F F F F 2,141E
F
Physical assault 3,393E
2,662E
5,270E
3,950E
3,222E
4,734E
11,885 11,346
Total 7,236E
3,583E
6,848E
5,377E
3,579E
6,002E
17,663 14,961
Household victimization
Break and enter F 702E
1,470E
828E
694E
1,048E
3,223 2,579
Motor vehicle/parts theft F F F F F 425E
1,358E
986
Theft of household property 2,218 1,412E
2,215 1,929E
953E
804E
5,386 4,145
Vandalism 1,556E
982E
1,449E
870E
F 709E
3,395 2,561
Total 5,234 3,362 5,758 3,922 2,370 2,987 13,362 10,271
Theft of personal property F 4,417 4,212E
4,540E
F 1,688E
7,135 10,645
Type of offence
Yukon Northwest Territories Nunavut1
All territories
2009 2014† 2009 2014† 2009 2014† 2009 2014†
rate
Violent victimization3
Sexual assault2
F F F F F F 50E
30E
Robbery F F F F F F 29E
F
Physical assault 127E
89E
162E
118E
227E
190E
162 129
Total 271E*
120E
210E
161E
252E
241E
240**
170
Household victimization4
Break and enter F 45E
98E*
52E
120E
110 91*
63
Motor vehicle/parts theft F F F F F 45E
39E*
24
Theft of household property 154E*
91E
147 122 164E*
84E
153**
102
Vandalism 108E
64E
96E*
55E
F 74E
96**
63
Total 362**
218 383**
248 409 313 379**
252
Theft of personal property3
F 148 129E
136E
F 68E
97 121
E use with caution
F too unreliable to be published
* significantly different from reference category (p < 0.1)
** significantly different from reference category (p < 0.05)
† reference category
1. In 2009, collection was limited to Nunavut's ten largest communities and resulted in under-coverage of the Inuit population and lower response rates than
those in Yukon and the Northwest Territories. Results from 2009 for Nunavut, therefore, should be used with caution.
2. As of 2014, this category includes having had non-consensual sexual relations because the victim was drugged, manipulated or forced in some way other
than physically.
3. Rates are calculated per 1,000 population aged 15 years and older.
4. Rates are calculated per 1,000 households.
Source: Statistics Canada, General Social Survey, 2009 et 2014.
Statistics Canada—Catalogue no. 85-002-X 29
Juristat Article—Criminal victimization in the territories, 2014
Table 2
Victimization incidents, by selected community, territories, 2014
Territory or community
Total violent victimization Total household victimization Theft of personal property
number rate1
number rate2
number rate1
Yukon
Whitehorse 2,919E
129E
2,520 218 4,281 189**
Other communities F F 843 218 F F
Total 3,583E
120E**
3,362 218 4,417 148
Northwest Territories
Yellowknife 2,822E
177E
1,990 264 3,413E
214E**
Other communities 2,555E
146E
1,932 234 F F
Total 5,377E
161E
3,922 248 4,540E
136E
Nunavut
Iqaluit F F 977E
355E*
F F
Rankin Inlet F F 401E
469E*
F F
Other communities 3,547E
213E
1,608E
271E
F F
Total 6,002E
241E*
2,987 313*
1,688E
68E**
All territories†
14,961 170 10,271 252 10,645 121
E use with caution
F too unreliable to be published
* significantly different from reference category (p < 0.1)
** significantly different from reference category (p < 0.05)
† reference category
1. Rates are calculated per 1,000 population aged 15 years and older.
2. Rates are calculated per 1,000 households.
Source: Statistics Canada, General Social Survey, 2014.
Statistics Canada—Catalogue no. 85-002-X30
Juristat Article—Criminal victimization in the territories, 2014
Table 3
Violent victimization incidents, by selected victim's sociodemographic characteristics and territory, 2014
Characteristics
Yukon Northwest Territories Nunavut All territories
number rate number rate number rate number rate
Sex
Male†
1,337E
90E
2,442E
141E
3,288E
258E
7,066E
157E
Female 2,245E
150E
2,935E
182E
2,714E
223E
7,895 182
Age
15 to 24†
F F F F 2,912E
460E
5,184E
298E
25 to 44 1,822E
173E
2,517E
186E
2,112E
199E
6,450 186
45 and over 853E
57E
1,495E
113E
F F 3,327E
92E**
Aboriginal identity
Non-Aboriginal people†
2,209E
96E
2,469E
154E
F F 5,087 121
Aboriginal people1
F F 2,908E
169E
5,593E
256E
9,839 215**
Inuk (Inuit) F F F F 5,433E
254E
6,274E
261E**
First Nations F F F F F F 2,544E
157E
Marital status
Married, common-law or widowed†
1,434E
80E
2,707E
139E
2,373E
157E
6,514 124E
Single 1,853E
194E**
2,209E
195E
F 383E*
7,536E
251E**
Separated/divorced F F F F F F 910E
165E
Living arrangement of household
Alone or couple without children2, †
1,276E
102E
1,731E
160E
410E
122E
3,417 128
Couple with children F F 2,254E
142E
3,906E
246E*
7,286E
169E
Lone-parent family F F F F F F 2,822E
231E*
Other living arrangement3
F F F F F F F F
Highest level of schooling (highest degree)
High school or less4, †
1,863E
125E
2,902E
149E
4,673E
244E
9,437 176
College/university 1,623E
109E
2,475E
180E
1,218E
234E
5,316E
157E
Main activity
Employed†
2,371E
120E
4,226E
185E
3,114E
228E
9,711E
172
Other F F 1,150E
110E
F F 5,250E
165E
Personal income
Less than $60,000†
1,815E
127E
F F 2,737E
F 6,413E
167E
$60,000 or more F F 2,374E
193E
F F 5,601E
205E
E use with caution
F too unreliable to be published
* significantly different from reference category (p < 0.1)
**significantly different from reference category (p < 0.05)
† reference category
1. Includes those who self-identified as First Nations, Métis or Inuit.
2. Includes couples living with unrelated persons.
3. Includes unrelated persons (e.g., roommates) and/or related persons who are neither spouses nor children living with their parents.
4. Includes trades.
Note: Rates are calculated per 1,000 population aged 15 years and older.
Source: Statistics Canada, General Social Survey, 2014.
Statistics Canada—Catalogue no. 85-002-X 31
Juristat Article—Criminal victimization in the territories, 2014
Table 4
Violent victimization incidents, by selected health, lifestyle and dwelling characteristics and
territory, 2014
Characteristics
Yukon Northwest Territories Nunavut All territories
number rate number rate number rate number rate
Physically or sexually assaulted by an adult before age 15
No†
1,797E
95E
1,350E
68E
F F 6,102E
111E
Yes – physically and/or sexually assaulted1
1,751E
169E*
4,008E
330E**
2,990E
381E
8,749 288**
Physical violence 1,630E
183E*
3,813E
349E**
2,886E
427E
8,329 313**
Sexual violence F F F F F F 2,501E
267E**
Self-rated mental health
Excellent or very good†
2,063E
99E
2,749 128E
2,375 172E
7,187 128
Good 1,201E
167E
F F F F 6,000E
230E*
Poor or fair F F F F F F 1,712E
320E**
Disability status
No disability†
2,746E
128E
2,802E
108E
4,351E
224E
9,898 148
Mental-health condition or learning disability F F F F F F 1,581E
251E
Physical disability F F 1,834E
358E**
F F 3,412E
236E
Used drugs during the month preceding the survey
No†
2,511E
101E
3,472 123E
3,541E
195E
9,524 134
Yes F F F F 2,400E
366E
5,376E
333E**
5 or more alcoholic drinks in one sitting (binge drinking) during the month preceding the survey
None†
1,756E
88E
2,806E
126E
4,386E
234E
8,947E
147E
At least once 1,827E
196E*
2,523E
236E
1,547E
274E
5,897E
230*
Number of evening activities during the month preceding the survey
0 to 14†
1,432E
88E
2,596E
151E
1,974E
165E
6,001E
132E
15 or more 2,151E
165E*
2,712E
177E
3,917E
334E**
8,780 219**
Ever been homeless
No†
2,598E
108E
2,929E
107E
4,258E
197E
9,785 134
Yes F F F 428E**
1,744E
550E**
5,176E
357E**
Residential mobility – number of moves in past 5 years
None†
1,569E
83E
F F F F 7,482E
139E
1 or 2 F F 2,138E
266E
831E
139E
3,690E
178E
3 or more 1,292E
304E*
F F F F 3,789E
280E**
Social disorder in the neighbourhood
No†
1,911E
89E
2,313E
127E
F F 6,357E
122E
Yes2
1,671E
198E
3,064E
201E
3,870 313 8,605 239**
See notes at the end of the table.
Statistics Canada—Catalogue no. 85-002-X32
Juristat Article—Criminal victimization in the territories, 2014
Table 4 — continued
Violent victimization incidents, by selected health, lifestyle and dwelling characteristics and
territory, 2014
Characteristics
Yukon Northwest Territories Nunavut All territories
number rate number rate number rate number rate
People in neighbourhood help each other
No†
F F F F F F 3,031E
291E
Yes 2,528E
99E
4,200E
150E
4,821E
221E
11,548 153*
Likelihood that neighbours call the police if witness what seems like criminal behaviour
Likely†
2,639E
100E
4,529E
154E
4,155E
220E
11,324 152
Unlikely F F F F F F 3,354E
320E
E
use with caution
F too unreliable to be published
* significantly different from reference category (p < 0.1)
**significantly different from reference category (p < 0.05)
† reference category
1. This total is not equal to the sum of its sub-categories, as some victims were the victims of both physical and sexual abuse.
2. Includes persons who responded that at least one of the following situations was a big or moderate problem in their neighbourhood: noisy neighbours or loud parties;
people hanging around on the streets; garbage or litter lying around; vandalism; people being attacked because of their skin colour, ethnic origin or religion; people using
or dealing drugs; people being drunk or rowdy in public places.
Note: Rates are calculated per 1,000 population aged 15 years and older.
Source: Statistics Canada, General Social Survey, 2014.
Statistics Canada—Catalogue no. 85-002-X 33
Juristat Article—Criminal victimization in the territories, 2014
Table 5
Household victimization incidents, by selected household and neighbourhood characteristics and
territory, 2014
Characteristics
Yukon Northwest Territories Nunavut All territories
number rate number rate number rate number rate
Household size
1 or 2 people†
2,252E
234 1,887E
236 F F 5,210 253
3 or 4 people 746E
165E
1,499E
264E
1,198E
397 3,444 261
5 people or more F F F F 718 199 1,618E
230
Living arrangement of household
Alone†
1,219E
277E
762E
206E
F F 2,620E
276E
Couple1
679E
171E
703E
220E
F F 1,646 205
Couple with children 823E
198E
1,346E
234E
1,557 313 3,726 251
Lone-parent family F F 848E
388E*
438E
255E
1,830 304
Other living arrangement2
F F F F F F F F
Aboriginal identity3
Non-Aboriginal households†
2,396E
223 1,457 218 468E
380E
4,321 232
Aboriginal households 755E
264E
1,965E
298E
2,282E
299 5,003 293
Other households F F 5,000E
197E
F F 948E
188E
Household income
Less than $40,000†
F F F F F 216E
1,619E
270E
$40,000 to $79,999 727E
207E
F 255E
F 533E
1,855E
272E
$80,000 to $149,999 825E
205E
750E
196E
951E
526E**
2,526 261
$150,000 or more F F 1,163E
315E
642E
420E**
2,292 319
Dwelling ownership
Owned†
1,823E
177E
1,841E
204 808E
334E
4,472 205
Rented 1,539E
304**
2,081 311*
2,179E
310E
5,799 309**
Living in the dwelling
Less than 3 years†
1,259E
334E
1,543E
255 912E
354E
3,713 299
3 years or more 2,104E
180E*
2,379 245 2,075E
301E
6,558 232*
Residential mobility – number of moves in past 5 years
None†
1,694E
176E
1,976E
237E
1,581 277 5,251 222
1 or 2 1,132E
316E
1,014E
247E
729E
274E
2,875 278
3 or more 536E
240E
933E
278E
F F 2,145E
321E
Social disorder in the neighbourhood4
No†
1,359E
125E
1,255E
152E
519E
114E
3,134 132
Yes 2,003E
435E**
2,667 353**
2,467 494E**
7,138 416**
See notes at the end of the table.
Statistics Canada—Catalogue no. 85-002-X34
Juristat Article—Criminal victimization in the territories, 2014
Table 5 — continued
Household victimization incidents, by selected household and neighbourhood characteristics and
territory, 2014
Characteristics
Yukon Northwest Territories Nunavut All territories
number rate number rate number rate number rate
People in neighbourhood help each other
No†
850E
462E
902E
392E
F 391E
2,172 417
Yes 2,345E
180**
2,822 218*
2,479E
299E
7,647 223**
Likelihood that neighbours call the police if witness what seems like criminal behaviour
Very likely 1,037E
105 2,196 241 1,099 268E
4,332 187
Somewhat likely 1,302E
363E**
1,228E
261E
1,201E
367 3,731 322**
Unlikely 935E
587E**
F F F F 1,965E
411E**
E
use with caution
F too unreliable to be published
* significantly different from reference category (p < 0.1)
** significantly different from reference category (p < 0.05)
† reference category
1. Includes couples living with unrelated persons.
2. Includes unrelated persons (e.g., roommates) and/or related persons who are neither spouses nor children living with their parents.
3. Non-Aboriginal households consist of households in which both spouses do not have Aboriginal identity; lone-parent families in which the parent does not have an
Aboriginal identity; single people with no Aboriginal identity; and other households in which the respondent reported having no Aboriginal identity and living with related
people only. Aboriginal households consist of households in which both spouses have Aboriginal identity; lone-parent families in which the parent has Aboriginal identity;
single people with Aboriginal identity; and other households in which the respondent reported having Aboriginal identity and living with related people only. All other
households are included in the "other households" category.
4. Includes persons who responded that at least one of the following situations was a big or moderate problem in their neighbourhood: noisy neighbours or loud parties;
people hanging around on the streets; garbage or litter lying around; vandalism; people being attacked because of their skin colour, ethnic origin or religion; people using
or dealing drugs; people being drunk or rowdy in public places.
Note: Rates are calculated per 1,000 households.
Source: Statistics Canada, General Social Survey, 2014.
Statistics Canada—Catalogue no. 85-002-X 35
Juristat Article—Criminal victimization in the territories, 2014
Table 6
Spousal violence victims, by selected characteristics, territories, 2014
Characteristics
Current
relationship1
Previous
relationship2
Current or previous
relationship
number percent number percent number percent
Territory
All territories†
4,136 8 2,859 23 6,956 12
Yukon F F 886E
18E
1,369E
7E**
Northwest Territories 1,644E
9E
1,262E
26E
2,906E
13E
Nunavut 1,979 13**
710E
27E
2,681 16**
Sex
Male†
2,148E
8E
1,336E
21E
3,453 12
Female 1,988E
8E
1,523 25 3,503 12
Age
15 to 24 F F F F F F
25 to 34†
1,532E
14E
1,337E
49E
2,869E
22E
35 to 44 1,509E
13E
665E
26E**
2,144E
16E
45 to 54 634E
6E**
F F 1,077E
8E**
55 and over F F F F F F
Highest level of schooling (highest degree)
Less than high school†
1,366E
11E
897E
44E
2,232E
15
High school/trade 1,703E
11E
832E
22E*
2,527E
14
College/university 1,066E
5E*
1,130E
17E**
2,197E
8E**
Main activity
Employed†
3,227E
9E
1,568E
17E
4,764 11
Student F F F F F F
Household work 482E
9E
F 58E**
1,025E
18E
Other F F F F 678E
8E
Personal income
Less than $30,000†
707E
8E
1,296E
48E
1,995E
17E
$30,000 to $79,999 2,021E
13E
449E
11E**
2,470E
14E
$80,000 or more 843E
6E
F F 1,121E
7E**
Aboriginal identity
Non-Aboriginal people†
853E
3E
888E
13E
1,741E
6E
Aboriginal people 3,283 13**
1,971E
36E**
5,215 18**
First Nation F F x x 1,655E
17E**
Inuit 2,301E
17E**
F 36E**
3,010 20E**
Métis x x F F F F
See notes at the end of the table.
Statistics Canada—Catalogue no. 85-002-X36
Juristat Article—Criminal victimization in the territories, 2014
Table 6 — continued
Spousal violence victims, by selected characteristics, territories, 2014
Characteristics
Current
relationship1
Previous
relationship2
Current or previous
relationship
number percent number percent number percent
Physically or sexually assaulted by an adult before age 15
Never†
1,433E
5E
1,452E
23E
2,855 8
At least once 2,563E
14E**
1,372E
24E
3,928 18**
Physical violence 2,287E
15E**
1,233E
24E
3,520 19**
Sexual violence 1,317E
23E**
F F 1,716E
24E**
Witnessed violence during childhood
No†
2,343E
6E
2,010E
23E
4,323 9
Yes3
1,719E
19E**
F 22E
2,389E
22E**
Self-rated mental health
Excellent†
F F 959E
22E
1,390E
7E
Very good 1,568E
9E
599E
16E
2,876E
12E
Good 1,943E
13E
F 26E
2,159E
16E**
Poor or fair F F F F 474E
23E**
Used drugs during the month preceding the survey
Yes†
1,760E
24E
F 34E
2,719E
29
No 2,368E
6E**
1,861E
20 4,198 9**
Spouse/partner used drugs during the month preceding the survey
Yes†
1,611E
32E
... ... ... ...
No 2,476E
6E**
... ... ... ...
5 or more alcoholic drinks in one sitting (binge drinking) during the month preceding the survey
Yes†
1,169E
9E
1,494E
31E
2,663E
16E
No 2,919E
8E
1,275E
17E*
4,155 10**
Spouse/partner had 5 or more alcoholic drinks in one sitting (binge drinking) during the month preceding the survey
Yes†
2,812E
11E
... ... ... ...
No 1,174E
8E
... ... ... ...
... not applicable
x suppressed to meet the confidentiality requirements of the Statistics Act
E
use with caution
F too unreliable to be published
* significantly different from reference category (p < 0.1)
** significantly different from reference category (p < 0.05)
† reference category
1. Includes legally married and common-law spouses.
2. Includes those separated or divorced from a legal marriage or common-law union and had contact with ex-partner in the 5 years preceding the survey.
3. Includes people who witnessed violence committed by a parent, step-parent or guardian against another adult at least once before age 15.
Source: Statistics Canada, General Social Survey, 2014.
Statistics Canada—Catalogue no. 85-002-X 37
Juristat Article—Criminal victimization in the territories, 2014
Table 7
Characteristics of violent victimization incidents, by territory, 2014
Characteristics
Yukon Northwest Territories Nunavut All territories†
percent
Location of the incident
Private residence F 35E
29E
31
Commercial or institutional establishment or public place 67 59 70 65
Other F F F F
Location of the incident is the victim's place of work1
Yes F F F 20E
No 70 78 74 74
Don't know/refusal F F F F
Sex of offender2
Male 68E
81 80 77
Female F F F 23E
Age of offender2
Under 25 years old F F F 33E
25 to 44 F 53 47E
47
45 years or older F F F 17E
Relationship of offender to the victim3
Stranger F 50 F 41E
Known to victim 64 50E
65 59
Don't know/refusal F F F F
Number of offenders
One 87 84 85 85
Two or more F F F F
Incident related to the offender's alcohol or drug use
Yes 63 72 54E
63
No F F F 26E
Don't know/refusal F F F F
Presence of a weapon
Yes F F F 27E
No 71 67 70 69
Caused injuries
Yes F F F 16E
No 93**
86 73**
84
See notes at the end of the table.
Statistics Canada—Catalogue no. 85-002-X38
Juristat Article—Criminal victimization in the territories, 2014
Table 7 — continued
Characteristics of violent victimization incidents, by territory, 2014
Characteristics
Yukon Northwest Territories Nunavut All territories†
percent
Victim reports effects consistent with post-traumatic stress disorder symptoms4
Yes F F F F
No 91 86 86 88
E
use with caution
F too unreliable to be published
** significantly different from reference category (p < 0.05)
† reference category
1. Due to an error in the survey application, victims who reported the location of the incident as “Other” were not asked the place of work question. Approximately one-
third of these incidents were recoded based on other information provided. The proportions on place of work presented in this table were calculated solely for incidents for
which there was a valid response.
2. Excludes incidents for which there was more than one offender.
3. Includes incidents for which the victim identified the number of offenders. If there was more than one offender, the relationship is that of the offender with the closest
relationship to the victim.
4. Based on the Primary Care Post-Traumatic Stress Disorder Screen. Includes people who reported at least three of the four symptoms evaluated.
Note: Excludes incidents of sexual assault and physical assault between spouses. The answers “Don't know” and “Refusal” are included in the calculation of the
percentages, but may not appear in the table when they represent less than 5% of responses. Because of the inclusion of the answers “Don’t know” and “Refusal” and of
rounding, percentages may not add up to 100.
Source: Statistics Canada, General Social Survey, 2014.
Statistics Canada—Catalogue no. 85-002-X 39
Juristat Article—Criminal victimization in the territories, 2014
Table 8
Victimization incidents, by reporting to police and territory, 2009 and 2014
Type of offence
Yukon
Northwest
Territories Nunavut All territories
Not
reported Reported
Not
reported Reported
Not
reported Reported
Not
reported Reported
Not
reported Reported
2014 2009 2014†
percent
Total victimization1
63 36 63 36 65 34 66 30*
64 36
Violent victimization incidents1
Sexual assault2
F F F F F F F F 90 F
Robbery F F F F F F F F F F
Physical assault F F F F 60 40E
54 39E
50 50
Total F 45E
52 47E
66 33E
62 31E
58 42
Household victimization incidents
Break and enter F F F F 41E
59 62*
31E**
46 54
Motor vehicle/parts
theft
F F F F F F F F 65 F
Theft of household
property
73 F 82 F 84 F 81 18 79 20E
Vandalism F F F F F F 57 42E
46 53
Total 60 39 65 35 58 42 68 30**
61 38
Theft of personal
property
72 F 72 F 76 F 72 27E
73 27
E
use with caution
F too unreliable to be published
* significantly different from reference category (p < 0.1)
** significantly different from reference category (p < 0.05)
† reference category
1. Excludes incidents of sexual assault and physical assault between spouses.
2. As of 2014, this category includes having had non-consensual sexual relations because the victim was drugged, manipulated or forced in some way other than
physically.
Source: Statistics Canada, General Social Survey, 2009 and 2014.
Statistics Canada—Catalogue no. 85-002-X40
Juristat Article—Criminal victimization in the territories, 2014
Table 9
Reasons for not reporting victimization incidents to the police, by territory, 2014
Reason for not reporting
Yukon
Northwest
Territories Nunavut All territories†
percent
Crime was minor and not worth taking the time to report 81 82 70*
78
Police wouldn't have considered the incident important enough 74 67 62 68
Incident was a private or personal matter and was handled informally 48 51 51 50
No one was harmed/no financial loss 53 49 46E
49
Lack of evidence 45 53 42 47
Police wouldn’t have found property/offender 46 50 41E
46
Did not want the hassle of dealing with the police 38 48 40 42
Police would not have been effective 36 38 39E
37
Offender would not be convicted or adequately punished 31 42 40E
38
No harm was intended 33E
37 34E
35
Feared or did not want the hassle of dealing with the court process 20E
33E
F 25
Did not want to get the offender in trouble F F F 15E
Unsatisfactory service (from police) in the past 15E
18E
10E*
14E
Didn’t want others to know F F F 8E
Reported to another official F F F 8E
Police would be biased F F F 7E
Insurance wouldn’t cover it F F F 7E
Nothing was taken/all items were recovered F F F 6E
Did not need a police report to file claim F F F 4E
E use with caution
F too unreliable to be published
* significantly different from reference category (p < 0.1)
† reference category
Note: Respondents were able to give more than one reason. Excludes incidents of sexual assault and physical assault between spouses.
Source: Statistics Canada, General Social Survey, 2014.
Statistics Canada—Catalogue no. 85-002-X 41
Juristat Article—Criminal victimization in the territories, 2014
Table 10
Perceptions of safety, crime and neighbourhood, by gender and territory, 2014
Perceptions of safety, crime and neighbourhood
Yukon
Northwest
Territories Nunavut
All territories
Males Females Total†
percent
Satisfaction with personal safety from crime
Very satisfied 38**
33 31 39**
29 34
Satisfied 51 52 57*
52 55 53
Neither satisfied nor dissatisfied 7E
10*
7E
6**
10 8
Dissatisfied or very dissatisfied 3E
5E
3E
2E**
5E
4
No opinion/don't know/refusal F F F 1E
1E
1E
Compared to other areas in Canada, do you think crime in your neighbourhood is...
... Higher? 4E**
8E
12**
9 7 8
... About the same? 18**
23 29**
21 25 23
... Lower 75**
64 53**
67*
62 65
... Don't know/refusal 3E**
4E
6**
3E**
5 4
During the last 5 years, do you think that crime in your neighbourhood has...
... Increased? 13 19*
15 12**
20 16
... Decreased? 9E
9E
9E
11*
8 9
... Remained about the same 71 65*
72 72**
66 69
... Just moved/has not lived in neighbourhood
long enough/refusal
7 7E
4E**
5E
7 6
Feeling of safety when walking alone at night in the neighbourhood
Very safe 54**
41**
51 62**
34 48
Reasonably safe 31 32 27*
27**
34 30
Somewhat unsafe or very unsafe 6E**
14**
10E
8**
12 10
Do not walk alone 9**
14*
12 3E**
20 11
Don't know/refusal F F F F F F
Social disorder – following situations represent a big or moderate problem in the neighbourhood:
Noisy neighbours or loud parties 9**
14**
12 9**
15 12
People hanging around on the streets 8**
17**
12E
11 14 13
Garbage or litter lying around 6**
16 27**
13**
19 16
Vandalism, graffiti 11**
16 19**
14 16 15
People being attacked or harassed because of their ethnic
origin or religion
5E
5E
6E
5E
6 6
People using or dealing drugs 14**
25*
26**
20 23 22
People being drunk or rowdy in public places 16**
32**
28 25 26 26
At least one of the above situations (total) 28**
46*
50**
37**
44 41
See notes at the end of the table.
Statistics Canada—Catalogue no. 85-002-X42
Juristat Article—Criminal victimization in the territories, 2014
Table 10 — continued
Perception of safety, crime and neighbourhood, by gender and territory, 2014
Perception of safety, crime and neighbourhood
Yukon
Northwest
Territories Nunavut
All territories
Males Females Total†
percent
Trust people in the neighbourhood1
Cannot be trusted 9**
16*
15 10**
17 13
Can be somewhat trusted 28 29 31 31 28 29
Can be trusted 36**
32 26**
34 30 32
Can be trusted a lot 26 21**
26 24 24 24
No opinion/don't know/refusal 2E
F F 2E
2E
2E
Likelihood that neighbours call the police if witness what seems like criminal behaviour
Very likely 65**
61**
40**
57 55 56
Somewhat likely 24**
27 35**
29 27 28
Somewhat unlikely or unlikely 9**
9**
19**
11 12 12
No opinion/don't know/refusal 3E
3E
5E**
2E**
5E
3
Sense of belonging to local community
Very strong 27**
27**
45**
31 33 32
Somewhat strong 50 53**
39**
48 48 48
Somewhat weak or very weak 19*
16 12**
16 15 16
No opinion/don't know/refusal 4E
3E
F 4E
3E
4E
E
use with caution
F too unreliable to be published
* significantly different from reference category (p < 0.1)
**significantly different from reference category (p < 0.05)
† reference category (except for gender comparisons, for which the reference category is “females”)
1. Respondents were asked to assess their trust level using a scale ranging from 1 (cannot be trusted at all) to 5 (can be trusted a lot). In this table, those who answered
1 or 2 are combined in "cannot be trusted".
Source: Statistics Canada, General Social Survey, 2014.
GSS
GSS
GSS

More Related Content

What's hot

LGBT Domestic Violence Report
LGBT Domestic Violence ReportLGBT Domestic Violence Report
LGBT Domestic Violence ReportSkyler Saunders
 
Violent Crimes Report for Continental U.S. (1980 - 2009)
Violent Crimes Report for Continental U.S. (1980 - 2009)Violent Crimes Report for Continental U.S. (1980 - 2009)
Violent Crimes Report for Continental U.S. (1980 - 2009)
Afroxl87
 
Lack of Communication, Resources, Trust As Well As Political Interference And...
Lack of Communication, Resources, Trust As Well As Political Interference And...Lack of Communication, Resources, Trust As Well As Political Interference And...
Lack of Communication, Resources, Trust As Well As Political Interference And...
AJHSSR Journal
 
Victims of Crime Survey, 2018
Victims of Crime Survey, 2018Victims of Crime Survey, 2018
Victims of Crime Survey, 2018
Statistics South Africa
 
Safestats data
Safestats dataSafestats data
Safestats datarjf298
 
Safestats data
Safestats dataSafestats data
Safestats datarjf298
 
HIV Prevention Report Card for SW May 2014
HIV Prevention Report Card for SW May 2014HIV Prevention Report Card for SW May 2014
HIV Prevention Report Card for SW May 2014Karinka Sagitova
 
Crimes in pakistan sociology assingment
Crimes in pakistan sociology assingmentCrimes in pakistan sociology assingment
Crimes in pakistan sociology assingment
tahaamir4
 
Research Methods Final Paper Jay
Research Methods Final Paper JayResearch Methods Final Paper Jay
Research Methods Final Paper JayJay Bhargava
 
Secondary evidence
Secondary evidenceSecondary evidence
Secondary evidence
karrass1
 
Secondary evidence task 4
Secondary evidence task 4Secondary evidence task 4
Secondary evidence task 4
nikonmedia
 
Strengthening legal referral mechanisms on cases of gender
Strengthening legal referral mechanisms on cases of genderStrengthening legal referral mechanisms on cases of gender
Strengthening legal referral mechanisms on cases of gender
Dwight Sabio
 
Ch06 Measuring Crime
Ch06 Measuring CrimeCh06 Measuring Crime
Ch06 Measuring Crime
yxl007
 
Increasingly non partisan, South Africans willing to trade elections for secu...
Increasingly non partisan, South Africans willing to trade elections for secu...Increasingly non partisan, South Africans willing to trade elections for secu...
Increasingly non partisan, South Africans willing to trade elections for secu...
SABC News
 
Unit 8 project identifying crime patterns e hall
Unit 8 project identifying  crime patterns e hallUnit 8 project identifying  crime patterns e hall
Unit 8 project identifying crime patterns e hallElizabeth Hall
 
Stategic_Crime_Report_Crime_Analyses_340[1]
Stategic_Crime_Report_Crime_Analyses_340[1]Stategic_Crime_Report_Crime_Analyses_340[1]
Stategic_Crime_Report_Crime_Analyses_340[1]Erasmo Skylar Ruiz
 
Street crimes in urban areas
Street crimes in urban areas Street crimes in urban areas
Street crimes in urban areas
mahee tori
 
Units 4, 5, 24, 31 task 4 secondary evidence (3)
Units 4, 5, 24, 31   task 4 secondary evidence (3)Units 4, 5, 24, 31   task 4 secondary evidence (3)
Units 4, 5, 24, 31 task 4 secondary evidence (3)
bentheman21
 

What's hot (20)

LGBT Domestic Violence Report
LGBT Domestic Violence ReportLGBT Domestic Violence Report
LGBT Domestic Violence Report
 
Violent Crimes Report for Continental U.S. (1980 - 2009)
Violent Crimes Report for Continental U.S. (1980 - 2009)Violent Crimes Report for Continental U.S. (1980 - 2009)
Violent Crimes Report for Continental U.S. (1980 - 2009)
 
Lack of Communication, Resources, Trust As Well As Political Interference And...
Lack of Communication, Resources, Trust As Well As Political Interference And...Lack of Communication, Resources, Trust As Well As Political Interference And...
Lack of Communication, Resources, Trust As Well As Political Interference And...
 
Victims of Crime Survey, 2018
Victims of Crime Survey, 2018Victims of Crime Survey, 2018
Victims of Crime Survey, 2018
 
Safestats data
Safestats dataSafestats data
Safestats data
 
Safestats data
Safestats dataSafestats data
Safestats data
 
Why Mission Matters- Journal Article
Why Mission Matters- Journal ArticleWhy Mission Matters- Journal Article
Why Mission Matters- Journal Article
 
Crime statistics
Crime statisticsCrime statistics
Crime statistics
 
HIV Prevention Report Card for SW May 2014
HIV Prevention Report Card for SW May 2014HIV Prevention Report Card for SW May 2014
HIV Prevention Report Card for SW May 2014
 
Crimes in pakistan sociology assingment
Crimes in pakistan sociology assingmentCrimes in pakistan sociology assingment
Crimes in pakistan sociology assingment
 
Research Methods Final Paper Jay
Research Methods Final Paper JayResearch Methods Final Paper Jay
Research Methods Final Paper Jay
 
Secondary evidence
Secondary evidenceSecondary evidence
Secondary evidence
 
Secondary evidence task 4
Secondary evidence task 4Secondary evidence task 4
Secondary evidence task 4
 
Strengthening legal referral mechanisms on cases of gender
Strengthening legal referral mechanisms on cases of genderStrengthening legal referral mechanisms on cases of gender
Strengthening legal referral mechanisms on cases of gender
 
Ch06 Measuring Crime
Ch06 Measuring CrimeCh06 Measuring Crime
Ch06 Measuring Crime
 
Increasingly non partisan, South Africans willing to trade elections for secu...
Increasingly non partisan, South Africans willing to trade elections for secu...Increasingly non partisan, South Africans willing to trade elections for secu...
Increasingly non partisan, South Africans willing to trade elections for secu...
 
Unit 8 project identifying crime patterns e hall
Unit 8 project identifying  crime patterns e hallUnit 8 project identifying  crime patterns e hall
Unit 8 project identifying crime patterns e hall
 
Stategic_Crime_Report_Crime_Analyses_340[1]
Stategic_Crime_Report_Crime_Analyses_340[1]Stategic_Crime_Report_Crime_Analyses_340[1]
Stategic_Crime_Report_Crime_Analyses_340[1]
 
Street crimes in urban areas
Street crimes in urban areas Street crimes in urban areas
Street crimes in urban areas
 
Units 4, 5, 24, 31 task 4 secondary evidence (3)
Units 4, 5, 24, 31   task 4 secondary evidence (3)Units 4, 5, 24, 31   task 4 secondary evidence (3)
Units 4, 5, 24, 31 task 4 secondary evidence (3)
 

Viewers also liked

P19 raquel chaves
P19 raquel chavesP19 raquel chaves
P19 raquel chaves
Raquel Ch
 
FAC
FACFAC
Consultancy Assignments_1991-97
Consultancy Assignments_1991-97Consultancy Assignments_1991-97
Consultancy Assignments_1991-97Carlos (Bodequin)
 
Claudio l
Claudio lClaudio l
Claudio l
Lisseth Claudio
 
Devoxx UK: Reliability & Scale in AWS while letting you sleep through the night
Devoxx UK: Reliability & Scale in AWS while letting you sleep through the night Devoxx UK: Reliability & Scale in AWS while letting you sleep through the night
Devoxx UK: Reliability & Scale in AWS while letting you sleep through the night
Jos Boumans
 
ぬくもり - LT駆動開発19
ぬくもり - LT駆動開発19ぬくもり - LT駆動開発19
ぬくもり - LT駆動開発19
niconicoumauma
 
Manual de funciones de excel (Función SI y función BuscarV)
Manual de funciones de excel (Función SI y función BuscarV)Manual de funciones de excel (Función SI y función BuscarV)
Manual de funciones de excel (Función SI y función BuscarV)
Sebastián Paúl Pardo Jaramillo
 
Get started with dropbox
Get started with dropboxGet started with dropbox
Get started with dropboxmandrik766
 

Viewers also liked (13)

newsletter2
newsletter2newsletter2
newsletter2
 
Int. sema 7
Int. sema 7Int. sema 7
Int. sema 7
 
Semana dos (2)
Semana dos (2)Semana dos (2)
Semana dos (2)
 
TG new cv
TG new cvTG new cv
TG new cv
 
LOGO
LOGOLOGO
LOGO
 
P19 raquel chaves
P19 raquel chavesP19 raquel chaves
P19 raquel chaves
 
FAC
FACFAC
FAC
 
Consultancy Assignments_1991-97
Consultancy Assignments_1991-97Consultancy Assignments_1991-97
Consultancy Assignments_1991-97
 
Claudio l
Claudio lClaudio l
Claudio l
 
Devoxx UK: Reliability & Scale in AWS while letting you sleep through the night
Devoxx UK: Reliability & Scale in AWS while letting you sleep through the night Devoxx UK: Reliability & Scale in AWS while letting you sleep through the night
Devoxx UK: Reliability & Scale in AWS while letting you sleep through the night
 
ぬくもり - LT駆動開発19
ぬくもり - LT駆動開発19ぬくもり - LT駆動開発19
ぬくもり - LT駆動開発19
 
Manual de funciones de excel (Función SI y función BuscarV)
Manual de funciones de excel (Función SI y función BuscarV)Manual de funciones de excel (Función SI y función BuscarV)
Manual de funciones de excel (Función SI y función BuscarV)
 
Get started with dropbox
Get started with dropboxGet started with dropbox
Get started with dropbox
 

Similar to GSS

1-measuring_crime.ppt
1-measuring_crime.ppt1-measuring_crime.ppt
1-measuring_crime.ppt
MaryamShahzadi40
 
Justice on the Street The Police and Racial and Ethnic Minoritie.docx
Justice on the Street The Police and Racial and Ethnic Minoritie.docxJustice on the Street The Police and Racial and Ethnic Minoritie.docx
Justice on the Street The Police and Racial and Ethnic Minoritie.docx
DIPESH30
 
Project Narrative for Juvenile Re-Entry Grant
Project Narrative for Juvenile Re-Entry GrantProject Narrative for Juvenile Re-Entry Grant
Project Narrative for Juvenile Re-Entry GrantCereta Gibbons
 
Корупція 2017
Корупція 2017Корупція 2017
Корупція 2017
Nastya Korinovska
 
Crime Surge and Institutional Weakness: are They Associated? Evidence from a ...
Crime Surge and Institutional Weakness: are They Associated? Evidence from a ...Crime Surge and Institutional Weakness: are They Associated? Evidence from a ...
Crime Surge and Institutional Weakness: are They Associated? Evidence from a ...
International Journal of World Policy and Development Studies
 
Public Services Access and Domestic Violence Lessons from a Randomized Contro...
Public Services Access and Domestic Violence Lessons from a Randomized Contro...Public Services Access and Domestic Violence Lessons from a Randomized Contro...
Public Services Access and Domestic Violence Lessons from a Randomized Contro...
Stockholm Institute of Transition Economics
 
Crime And Prevention Trends 2006
Crime And Prevention Trends 2006Crime And Prevention Trends 2006
Crime And Prevention Trends 2006
National Crime Prevention Council
 
SexualAssaultInternshipproject (1) (1)
SexualAssaultInternshipproject (1) (1)SexualAssaultInternshipproject (1) (1)
SexualAssaultInternshipproject (1) (1)Quinlan Cummings
 
3Victimization inthe United StatesAn OverviewCHAPTE.docx
3Victimization inthe United StatesAn OverviewCHAPTE.docx3Victimization inthe United StatesAn OverviewCHAPTE.docx
3Victimization inthe United StatesAn OverviewCHAPTE.docx
lorainedeserre
 
11 Sex Offenders Assessment and TreatmentShahid M. Shahidullah an.docx
11 Sex Offenders Assessment and TreatmentShahid M. Shahidullah an.docx11 Sex Offenders Assessment and TreatmentShahid M. Shahidullah an.docx
11 Sex Offenders Assessment and TreatmentShahid M. Shahidullah an.docx
paynetawnya
 
Crim methods2
Crim methods2Crim methods2
Crim methods2
University of Dayton
 
Walker-8-chapter-12
Walker-8-chapter-12Walker-8-chapter-12
Walker-8-chapter-12glickauf
 
Crime and the poverty penalty in urban Ghana - draft 7 4 16
Crime and the poverty penalty in urban Ghana - draft 7 4 16Crime and the poverty penalty in urban Ghana - draft 7 4 16
Crime and the poverty penalty in urban Ghana - draft 7 4 16Mayssam Zaaroura
 
3Victimization inthe United StatesAn OverviewCHAPTE.docx
3Victimization inthe United StatesAn OverviewCHAPTE.docx3Victimization inthe United StatesAn OverviewCHAPTE.docx
3Victimization inthe United StatesAn OverviewCHAPTE.docx
tamicawaysmith
 
Ethics in Criminal Data Collection
Ethics in Criminal Data CollectionEthics in Criminal Data Collection
Ethics in Criminal Data Collection
Ayodele Odubela
 
Controlling or Coercive Behaviour in Relationships: Making Legislation Work M...
Controlling or Coercive Behaviour in Relationships: Making Legislation Work M...Controlling or Coercive Behaviour in Relationships: Making Legislation Work M...
Controlling or Coercive Behaviour in Relationships: Making Legislation Work M...
IBB Law
 
The Factors which Influence National Crime_5A
The Factors which Influence National Crime_5AThe Factors which Influence National Crime_5A
The Factors which Influence National Crime_5ATal Fisher
 

Similar to GSS (20)

1-measuring_crime.ppt
1-measuring_crime.ppt1-measuring_crime.ppt
1-measuring_crime.ppt
 
SociologyExchange.co.uk Shared Resource
SociologyExchange.co.uk Shared ResourceSociologyExchange.co.uk Shared Resource
SociologyExchange.co.uk Shared Resource
 
Justice on the Street The Police and Racial and Ethnic Minoritie.docx
Justice on the Street The Police and Racial and Ethnic Minoritie.docxJustice on the Street The Police and Racial and Ethnic Minoritie.docx
Justice on the Street The Police and Racial and Ethnic Minoritie.docx
 
Project Narrative for Juvenile Re-Entry Grant
Project Narrative for Juvenile Re-Entry GrantProject Narrative for Juvenile Re-Entry Grant
Project Narrative for Juvenile Re-Entry Grant
 
Корупція 2017
Корупція 2017Корупція 2017
Корупція 2017
 
Crime Surge and Institutional Weakness: are They Associated? Evidence from a ...
Crime Surge and Institutional Weakness: are They Associated? Evidence from a ...Crime Surge and Institutional Weakness: are They Associated? Evidence from a ...
Crime Surge and Institutional Weakness: are They Associated? Evidence from a ...
 
Public Services Access and Domestic Violence Lessons from a Randomized Contro...
Public Services Access and Domestic Violence Lessons from a Randomized Contro...Public Services Access and Domestic Violence Lessons from a Randomized Contro...
Public Services Access and Domestic Violence Lessons from a Randomized Contro...
 
Crime And Prevention Trends 2006
Crime And Prevention Trends 2006Crime And Prevention Trends 2006
Crime And Prevention Trends 2006
 
SexualAssaultInternshipproject (1) (1)
SexualAssaultInternshipproject (1) (1)SexualAssaultInternshipproject (1) (1)
SexualAssaultInternshipproject (1) (1)
 
3Victimization inthe United StatesAn OverviewCHAPTE.docx
3Victimization inthe United StatesAn OverviewCHAPTE.docx3Victimization inthe United StatesAn OverviewCHAPTE.docx
3Victimization inthe United StatesAn OverviewCHAPTE.docx
 
11 Sex Offenders Assessment and TreatmentShahid M. Shahidullah an.docx
11 Sex Offenders Assessment and TreatmentShahid M. Shahidullah an.docx11 Sex Offenders Assessment and TreatmentShahid M. Shahidullah an.docx
11 Sex Offenders Assessment and TreatmentShahid M. Shahidullah an.docx
 
SociologyExchange.co.uk Shared Resource
SociologyExchange.co.uk Shared ResourceSociologyExchange.co.uk Shared Resource
SociologyExchange.co.uk Shared Resource
 
Walker, Chapter 12
Walker, Chapter 12Walker, Chapter 12
Walker, Chapter 12
 
Crim methods2
Crim methods2Crim methods2
Crim methods2
 
Walker-8-chapter-12
Walker-8-chapter-12Walker-8-chapter-12
Walker-8-chapter-12
 
Crime and the poverty penalty in urban Ghana - draft 7 4 16
Crime and the poverty penalty in urban Ghana - draft 7 4 16Crime and the poverty penalty in urban Ghana - draft 7 4 16
Crime and the poverty penalty in urban Ghana - draft 7 4 16
 
3Victimization inthe United StatesAn OverviewCHAPTE.docx
3Victimization inthe United StatesAn OverviewCHAPTE.docx3Victimization inthe United StatesAn OverviewCHAPTE.docx
3Victimization inthe United StatesAn OverviewCHAPTE.docx
 
Ethics in Criminal Data Collection
Ethics in Criminal Data CollectionEthics in Criminal Data Collection
Ethics in Criminal Data Collection
 
Controlling or Coercive Behaviour in Relationships: Making Legislation Work M...
Controlling or Coercive Behaviour in Relationships: Making Legislation Work M...Controlling or Coercive Behaviour in Relationships: Making Legislation Work M...
Controlling or Coercive Behaviour in Relationships: Making Legislation Work M...
 
The Factors which Influence National Crime_5A
The Factors which Influence National Crime_5AThe Factors which Influence National Crime_5A
The Factors which Influence National Crime_5A
 

GSS

  • 1. Juristat Catalogue no. 85-002-X ISSN 1209-6393 by Samuel Perreault and Laura Simpson Canadian Centre for Justice Statistics Criminal victimization in the territories, 2014 Release date: April 27, 2016
  • 2. Standard table symbols The following symbols are used in Statistics Canada publications: . not available for any reference period .. not available for a specific reference period ... not applicable 0 true zero or a value rounded to zero 0s value rounded to 0 (zero) where there is a meaningful distinction between true zero and the value that was rounded p preliminary r revised x suppressed to meet the confidentiality requirements of the Statistics Act E use with caution F too unreliable to be published * significantly different from reference category (p < 0.05) How to obtain more information For information about this product or the wide range of services and data available from Statistics Canada, visit our website, www.statcan.gc.ca. You can also contact us by email at STATCAN.infostats-infostats.STATCAN@canada.ca telephone, from Monday to Friday, 8:30 a.m. to 4:30 p.m., at the following toll-free numbers: •• Statistical Information Service 1-800-263-1136 •• National telecommunications device for the hearing impaired 1-800-363-7629 •• Fax line 1-877-287-4369 Depository Services Program •• Inquiries line 1-800-635-7943 •• Fax line 1-800-565-7757 Published by authority of the Minister responsible for Statistics Canada © Minister of Industry, 2016 All rights reserved. Use of this publication is governed by the Statistics Canada Open Licence Agreement. An HTML version is also available. Cette publication est aussi disponible en français. Note of appreciation Canada owes the success of its statistical system to a long‑standing partnership between Statistics Canada, the citizens of Canada, its businesses, governments and other institutions. Accurate and timely statistical information could not be produced without their continued co‑operation and goodwill. Standards of service to the public Statistics Canada is committed to serving its clients in a prompt, reliable and courteous manner. To this end, Statistics Canada has developed standards of service that its employees observe. To obtain a copy of these service standards, please contact Statistics Canada toll-free at 1-800-263-1136. The service standards are also published on www.statcan.gc.ca under “Contact us” > “Standards of service to the public.”
  • 3. Statistics Canada—Catalogue no. 85-002-X 3 Juristat Article—Criminal victimization in the territories, 2014 Criminal victimization in the territories, 2014: highlights  More than one-quarter of residents of the territories (28%) reported being the victim of at least one crime in 2014. This was down from the proportion reported in 2009 (34%), but remains higher than the figure reported in the provinces (18%).  Both violent victimization (-29%) and household victimization (-34%) decreased from 2009. However, the rate of theft of personal property remained stable.  Nunavut recorded the highest rates of both violent victimization (241E per 1,000 population) and household victimization (313 per 1,000 population) among the territories. On the other hand, this territory also reported the lowest rate of theft of personal property (68E per 1,000 population).  Overall, the proportion of people who reported being the victim of at least one crime was higher in communities with a population of 2,000 or more (32%) than in smaller communities (19%).  Approximately one-third of residents of the territories (34%) reported having been the victim of abuse by an adult at least once before the age of 15. This proportion was higher among those aged 45 to 64 years (45%) than those aged 15 to 34 years (26%).  Among those with a spouse or common-law partner (current or ex), 12% reported at least one spousal violence incident in the preceding five years, similar to the proportion reported in 2009. Three-quarters (75%) of victims were Aboriginal.  Consistent with data in the provinces, Aboriginal identity was not associated with an increased risk of violent victimization when other risk factors were taken into account.  Approximately one-half (49%) of victims of spousal violence reported sustaining injuries due to the violence. This proportion was higher than the proportion observed in the provinces (31%).  Almost half (49%) of cases of spousal violence were reported to the police, and so were 36% of victimization incidents other than spousal violence.  About one-third (34%) of females in the territories reported feeling very safe walking alone at night, compared with almost two-thirds (62%) of males.  Over one-third of territorial residents (36%) reported having a great deal of confidence in the police. Aboriginal residents were less likely to report having a great deal of confidence in the police compared to non-Aboriginal residents (30% compared with 43%, respectively).
  • 4. Statistics Canada—Catalogue no. 85-002-X4 Juristat Article—Criminal victimization in the territories, 2014 Criminal victimization in the territories, 2014 by Samuel Perreault and Laura Simpson Statistics Canada relies on two complementary instruments to collect official data on criminal victimization in Canada: police- reported data collected through the Uniform Crime Reporting (UCR) Survey, and self-reported data collected through the General Social Survey (GSS). While the UCR is an annual census of all crimes that come to the attention of the police, the GSS on victimization is a sample survey conducted every 5 years which asks Canadians to report on their personal experiences of victimization, and as such, includes both crimes that are reported to police and those that are not. Data collected from both the GSS and UCR show that crime rates in the Canadian territories—Yukon, the Northwest Territories and Nunavut—are notably higher than the rest of Canada (Allen and Perreault 2015; Perreault and Hotton Mahoney 2012). The territories also have different social and economic conditions compared to the provinces, such as a large population of residents reporting an Aboriginal identity, a younger population, high unemployment and remote communities. In addition, the territories differ from one another on a variety of factors like culture and socio-demographic composition. As such, analysis specific to the territories could help to better understand the nature of victimization in that region of the country. This Juristat presents the first results on victimization in the territories from the 2014 GSS. The analysis provides insight on the nature and extent of criminal victimization in Canada’s three territories. This Juristat also presents new information on childhood victimization and post-traumatic stress disorder (PTSD) and their links to victimization in the territories. Furthermore, information on peoples’ perceptions of the criminal justice system, including their confidence in the police, is presented. Text box 1 Definition of criminal victimization in Canada The GSS on victimization surveyed Canadians on their experiences with eight types of offences, which are: Violent victimization: Sexual assault, robbery or physical assault. Sexual assault: Forced sexual activity, attempted forced sexual activity, unwanted sexual touching, grabbing, kissing or fondling, or sexual relations without being able to give consent. Robbery: Theft or attempted theft in which the offender had a weapon or there was violence or the threat of violence against the victim. Physical assault: An attack (victim hit, slapped, grabbed, knocked down, or beaten), a face-to-face threat of physical harm, or an incident with a weapon present. Theft of personal property: Theft or attempted theft of personal property such as money, credit cards, clothing, jewellery, purse or wallet. Unlike robbery, the offender does not confront the victim. Household victimization: Break and enter, theft of motor vehicle or parts, theft of household property or vandalism. Break and enter: Illegal entry or attempted entry into a residence or other building on the victim’s property. Theft of motor vehicle or parts: Theft or attempted theft of a car, truck, van, motorcycle, moped or other vehicle, or part of a motor vehicle. Theft of household property: Theft or attempted theft of household property such as bicycles, electronic equipment, tools or appliances. Vandalism: Wilful damage of personal or household property. More than one-quarter of residents of the territories reported being the victim of a crime1 In 2014, more than one-quarter of residents of the territories (28%) reported being the victim of at least one of the eight offences measured by the GSS in the 12 months preceding the survey. This is down from the proportion reported in 2009 (34%), but remains higher than the figure reported in the provinces (18%). In all, close to 36,000 criminal incidents were reported to the GSS by residents of the territories in 2014. Of these, the majority (58%) were non-violent, being either theft of personal property (30%) or household crimes (29%). The remaining 42% were violent crimes, specifically sexual assault, robbery and physical assault.
  • 5. Statistics Canada—Catalogue no. 85-002-X 5 Juristat Article—Criminal victimization in the territories, 2014 Of the eight crime types measured by the GSS, physical assault and theft of personal property were the most frequent, representing 32% and 30%, respectively, of the crimes reported by the residents of the territories in 2014. The other crimes were less frequent and occurred in the following order: theft of household property (12%), sexual assault (7%), break and enter (7%), vandalism (7%) and theft of a motor vehicle or parts (3%). Given the sample size, the number of robberies reported in the territories in 2014 was too small to produce a reliable estimate. Rates of violent victimization and household victimization down from 2009 In order to make comparisons across time and between geographies, rates are normally calculated to account for differences in population sizes. As such, the approximately 15,000 violent incidents reported by residents of the territories in 2014 translated into a rate of 170 violent incidents per 1,000 population 15 years and older. For non-violent crimes, rates of 252 incidents targeting households per 1,000 households, and 121 thefts of personal property per 1,000 population were recorded (Table 1). The rates of both violent victimization2 (-29%) and household victimization (-34%) decreased from 2009. While the number of thefts of personal property increased during this same period, the rate increase was not statistically significant. Victimization rates were higher in the territories than in the provinces Consistent with 2014 police-reported data, GSS data show that victimization rates were higher in the territories than in the provinces. The difference was particularly pronounced for violent crime, for which the rate in the territories was more than twice the rate in the provinces (Chart 1).
  • 6. Statistics Canada—Catalogue no. 85-002-X6 Juristat Article—Criminal victimization in the territories, 2014 Nunavut had the highest rates of violent and household victimization The proportion of people who reported being a victim of at least one of the eight crimes measured by the GSS was quite similar across the territories, ranging from 27% in Nunavut to 29% in the Northwest Territories. While the proportion of victims was similar, the nature of victimization differed from one territory to another. Specifically, Nunavut recorded the highest rates of both violent victimization3 (241E per 1,000 population) and household victimization4 (313 per 1,000 population) among the territories. On the other hand, this territory also reported the lowest rate of theft of personal property (68E per 1,000 population) (Table 2, Charts 2 and 3).
  • 7. Statistics Canada—Catalogue no. 85-002-X 7 Juristat Article—Criminal victimization in the territories, 2014 Conversely, Yukon recorded the lowest violent victimization rate (120E per 1,000 population). Yukon is also the territory that saw the most significant decline in victimization rates from 2009, with its violent victimization rate falling by 56% and the household victimization rate decreasing by 40%. The Northwest Territories also observed a considerable decline in its household victimization rate (-35%) compared with 2009. Victimization was more common in the territories’ larger communities Overall, the proportion of people who reported being the victim of at least one of the eight offences measured by the GSS was higher in territory communities with a population of 2,000 or more. Specifically, nearly one-third (32%) of residents in the larger communities reported being the victims of at least one of the eight crimes measured by the GSS, compared with one in five people (19%) in the smallest communities. However, no significant differences were found between the three largest communities—the three capital cities—and the other communities with a population of 2,000 or more (Chart 4).
  • 8. Statistics Canada—Catalogue no. 85-002-X8 Juristat Article—Criminal victimization in the territories, 2014 Among the communities, Rankin Inlet (42%) and Iqaluit (39%) had the highest proportions of victims. Nearly all communities with a population of 2,000 or more recorded victimization rates that were higher than the average of the smallest communities. In general, the difference between large and small communities was mainly attributable to theft of personal property rates, which were significantly higher in the former (164 per 1,000 compared with 28E per 1,000). Incidentally, the tendency toward higher rates of personal property theft in large population centres is also observed in the provinces (Perreault 2015). In Nunavut, the difference between large and small communities was also attributable to higher household victimization rates in larger communities compared to smaller ones.
  • 9. Statistics Canada—Catalogue no. 85-002-X 9 Juristat Article—Criminal victimization in the territories, 2014 Text box 2 Childhood maltreatment Several studies have shown a link between abuse experienced during childhood and both an increased risk of victimization in adulthood (Parks et al. 2011; Reid and Sullivan 2009; Desai et al. 2002) and an increased likelihood of having contact with police (Boyce 2015). For the first time, the 2014 GSS included detailed questions about respondents’ experiences of maltreatment during childhood. Approximately one-third of residents of the territories (34%) reported having been the victim of some form of abuse by an adult at least once before the age of 15. This proportion was slightly higher than the one recorded in the provinces (30%). Specifically, 6% of residents of the territories reported experiencing both physical and sexual violence, while 24% experienced solely physical assault, and 4% experienced solely sexual violence. The proportion of victims of childhood maltreatment was relatively similar across the territories. However, older people— particularly those aged 45 to 64 years—were more likely than younger respondents to report being the victim of childhood maltreatment. Approximately one-quarter (26%) of respondents between the ages of 15 and 34 years reported experiencing childhood maltreatment, compared with 45% among those aged 45 to 64 years (Chart 5). In approximately one-half (53%) of cases of physical violence experienced during childhood, the offender was a member of the victim’s immediate family, most often the father (28%) or the mother (16%).5 In cases of sexual abuse, however, the offender was more likely to be an extended family member such as an uncle or cousin (23%), a stranger (18%) or an acquaintance (17%). The majority (62%) of people who experienced childhood maltreatment never spoke of the abuse to anyone before the age of 15, whether to a family member, friend, neighbour or anyone else. Males (69%) were more likely than females (53%) to report that they had never spoken about the abuse before they turned 15 years old. Older people were also less likely to have spoken about the abuse to anyone while they were under 15. More than half (52%) of people aged 15 to 24 years who experienced childhood maltreatment told someone about it, compared to 29% of people aged 55 to 64 years and 23%E of people aged 65 years and older who did so. In addition to questions about maltreatment experienced during childhood, the 2014 GSS also asked respondents about violence they may have witnessed as children. About 17% of residents of the territories reported having witnessed violence by one of their parents toward another adult during the time that they were under the age of 15.
  • 10. Statistics Canada—Catalogue no. 85-002-X10 Juristat Article—Criminal victimization in the territories, 2014 Violent victimization The risk of being a victim of a violent crime is not the same for everyone. Lifestyle, the places people frequent or the region in which they live can expose people to a higher risk of being the victim of a crime (Perreault 2015; Lilly et al. 2014). Several characteristics have been shown to be associated with higher rates of victimization (Perreault 2015; Perreault and Brennan 2010), some of which can be interrelated. For example, young people may have a higher rate of victimization than older people, and students may have higher rates of victimization than those who are employed full-time. However, according to a previous study, being a student may not be associated with a higher risk of violent victimization when other factors are controlled for, mainly age (Mihorean et al. 2001). Using the 2014 GSS data, a multivariate analysis was conducted to determine which factors had an impact on the risk of violent victimization (Model 1). This section highlights the characteristics that were found to be associated with a higher risk of violent victimization in the territories. The risk of violent victimization was higher among women Women’s rate of violent victimization was 182 violent incidents per 1,000 women, a rate not significantly different from that reported by men (157E per 1,000 men) (Table 3). However, when controlling for other risk factors, such as using drugs or having a history of childhood victimization, women’s risk of violent victimization was approximately 45% higher than men’s (Model 1). In other words, for people with similar characteristics, a female would have a greater risk of violent victimization than her male counterpart. A similar trend was observed in the provinces in 2014. This was mainly due to the relative stability of the sexual assault victimization rate—of which the majority of victims are women—and a decline in the rates of other violent crimes. The risk of victimization decreases with age As was observed in the provinces, in the territories the risk of violent victimization decreases with age. For example, persons aged 15 to 24 years recorded a rate of 298E violent incidents per 1,000 population, compared with 92E per 1,000 among people aged 45 years and older (Table 3). Young people were more likely to report certain behaviours associated with a higher risk of violent victimization, such as using drugs or going out at night. When other factors were taken into account, however, age was still associated with the risk of victimization, which decreases approximately 5% with every year of age (Model 1). Drug use increases the risk of violent victimization In 2014, drug use was one of the main risk factors for violent victimization in the territories. People who reported having used drugs in the month preceding the survey recorded a rate of 333E violent incidents per 1,000 population, a rate 2.5 times higher than for non-users (134 per 1,000) (Table 4). Going out in the evening frequently was another behaviour found to be associated with a higher risk of violent victimization. For example, people who reported having 15 or more evening activities during the month preceding the survey recorded a rate of 219 incidents per 1,000 population, compared with 132E per 1,000 among those who reported less than 15 activities. Moreover, people who reported engaging in at least one binge drinking episode—that is, at least five alcoholic drinks on a single occasion—recorded a higher rate of violent victimization than those who did not engage in binge drinking (230 per 1,000 population compared with 147E per 1,000). When all risk factors were taken together, drug use continued to be associated with an increased risk of victimization, while evening activities and alcohol use were no longer factors. A history of child maltreatment is associated with higher victimization rates Several studies have shown a link between abuse experienced during childhood and an increased risk of victimization in adulthood (see Text box 2). In line with these studies, data from the 2014 GSS show that childhood maltreatment was one of the most significant risk factors for violent victimization experienced in the previous 12 months in the territories. Those who reported experiencing childhood maltreatment recorded a violent victimization rate 2.6 times higher than those who did not suffer abuse as a child (288 per 1,000 population compared with 111E per 1,000) (Table 4). Moreover, this difference persisted even when the other risk factors were taken into account (Model 1).
  • 11. Statistics Canada—Catalogue no. 85-002-X 11 Juristat Article—Criminal victimization in the territories, 2014 A history of homelessness is associated with higher risk of violent victimization People in the territories with a history of homelessness—that is, those who have been homeless or have had to live with family, friends or in a vehicle because they had nowhere else to go— recorded a violent victimization rate that was nearly three times higher than people with no such history (357E per 1,000 population compared with 134 per 1,000) (Table 4). When all risk factors were taken into account, a history of homelessness remained significantly correlated with the risk of violent victimization (Model 1). Low social cohesion is associated with higher rates of violent victimization Social cohesion generally refers to a neighbourhood where people know each other, help each other and share common values (Charron 2009; Forrest and Kearns 2001). Low social cohesion is thought to be associated with higher levels of crime, particularly due to less social control and collective efficacy in the neighbourhood (Sampson 2012; Charron 2009). Certain indicators suggest that this relationship was observable in the territories in 2014. For example, people who stated their neighbourhood was not a place where neighbours helped each other recorded a violent victimization rate almost twice as high as those who believed the opposite (291E per 1,000 population compared with 153 per 1,000) (Table 4). Higher violent victimization rates were also observed among those who reported social disorder in their neighbourhood (239 per 1,000 population compared with 122E per 1,000). The presence of social disorder—such as litter, noisy neighbours, people who were drunk or using drugs in public places—can be considered a sign of social disorganization (Brown et al. 2004). However, when all risk factors were taken into account, the factor found to be most associated with risk of violent victimization was the likelihood that neighbours would call the police if they witnessed criminal behaviour. Specifically, the risk of victimization was more than two times higher among people who considered it unlikely that their neighbours would notify the police if they witnessed a criminal act (Model 1). People whose activities are limited by a physical condition are at higher risk for violent victimization Various studies have suggested that physical or mental disabilities may be a risk factor for greater vulnerability to potential offenders (Perreault 2009; Cantos 2006). According to data from the 2014 GSS, physical or mental disabilities were associated with a 50% higher risk of violent victimization when other risk factors were taken into account (Model 1). Aboriginal identity was not linked to the risk of violent victimization when all risk factors were taken into account Data from previous GSS cycles as well as homicide data demonstrated that Aboriginal people are over-represented as victims of crime (Miladinovic and Mulligan 2015; Perreault and Hotton Mahoney 2012). The 2014 GSS data also revealed higher violent victimization rates for Aboriginal people living in the territories than for their non-Aboriginal counterparts (215 incidents per 1,000 Aboriginal people compared with 121 per 1,000 non-Aboriginals) (Table 3). However, similar to 2014 provincial findings, Aboriginal identity was no longer associated with a risk of violent victimization when all other risk factors were taken into account (see Model 1 for significant risk factors). As such, the differences between Aboriginal people and non-Aboriginal people may have more to do with the relatively higher presence of risk factors among Aboriginal people. Household victimization As with violent victimization, certain characteristics of households can be associated with relatively high rates of household victimization, that is break and enter, theft of motor vehicle or parts, theft of household property or vandalism. This section highlights the main household characteristics that were linked with higher victimization rates in the territories. It should be noted that no multivariate analysis was performed for household victimization. As such some of these characteristics may not be risk factors if all other risk factors were controlled for.6 Low social cohesion was associated with higher rates of household victimization As was observed with violent victimization, higher household victimization rates in the territories were associated with certain indicators of low social cohesion. For example, the household victimization rate was nearly double in households located in neighbourhoods where people do not help each other (417 per 1,000 households compared with 223 per 1,000).
  • 12. Statistics Canada—Catalogue no. 85-002-X12 Juristat Article—Criminal victimization in the territories, 2014 Similarly, the victimization rate was higher among households located in an area where neighbours are unlikely to call the police if they witness a criminal act (411E incidents per 1,000 households) and among those that report social disorder (416 per 1,000 households) (Table 5). Renters recorded higher rates of household victimization In 2014, tenant households reported higher victimization rates than those who owned their dwelling. Specifically, the household victimization rate was 309 per 1,000 tenant households, compared with 205 per 1,000 owner households (Table 5). The same trend was observed in the provinces. Moreover, households that had occupied their dwelling for less than three years reported a higher victimization rate than those who had lived in their dwelling longer (299 per 1,000 households compared with 232 per 1,000).7 Text box 3 Differences between GSS data on victimization and police-reported data Although the data from the GSS on Victimization and the Uniform Crime Reporting (UCR) Survey both capture information on crime in Canada, the two surveys have many differences including survey type, scope, coverage and source of information. As such, numbers from these two surveys should not be directly compared and trends should be compared with caution. The GSS is a sample survey which, in 2014, collected data from more than 2,000 (in addition to about 33,000 in the provinces) non-institutionalized individuals aged 15 years and older living in the three territories. The GSS collects data on eight types of offences but excludes crimes targeting businesses or institutions. One of the main advantages of the GSS is that it captures information on criminal incidents that do not come to the attention of the police, which is sometimes referred to as the “dark figure” of crime (see the Survey description section for more information on the GSS). In comparison, the UCR is an annual census of all offences under the Criminal Code and certain other federal laws that come to the attention of the police and are reported by them to Statistics Canada. Spousal violence In the 2014 GSS on victimization, respondents who were married or living in a common-law relationship at the time of the survey, or who had been in contact with their ex-spouse or ex-common-law partner during the five years preceding the survey, were asked a series of questions about their experiences with spousal violence in the past five years. The questions measure both physical and sexual violence, as defined by the Criminal Code and which could be acted upon by police. This includes threats of violence against the victim or the act of being pushed, grabbed, shoved, slapped, kicked, bitten, hit, beaten, choked, threatened with a gun or knife or forced into sexual activity. Unlike most violent crime, spousal violence may be part of a pattern of ongoing abuse. As such, incident characteristics, risk factors and consequences for the victims may differ along with the type of violence (Douglas and Otto 2010). While the rates presented in the previous sections included both spousal8 and non-spousal violence, the remainder of this report examines them separately. More than one in ten people with a current or former spouse or partner living in the territories reported spousal violence in the previous five years According to the 2014 GSS, nearly two-thirds of residents of the territories aged 15 and over—approximately 58,000 people—were either married or in a common-law relationship or had been in contact with their ex-partner in the previous five years. Of these people, just over 1 in 10 (12%) reported being the victim of some form of spousal violence on at least one occasion in the five years preceding the survey, representing approximately 7,000 victims (Table 6). The proportion of spousal violence victims in the territories is relatively similar to that observed in 2009 (10%) (Chart 6), which contrasts with the situation observed in the provinces, where the rate of spousal violence was lower for the same period (from 6% in 2009 to 4% in 2014). The proportion of spousal violence victims varied from 7%E in Yukon to 16% in Nunavut.9
  • 13. Statistics Canada—Catalogue no. 85-002-X 13 Juristat Article—Criminal victimization in the territories, 2014 In addition to physical or sexual violence, nearly one-quarter (23%) of the territories’ spousal population reported having been the victim of psychological or financial abuse. While this form of abuse is not used to calculate rates of spousal violence, it nonetheless provides a better understanding of the context in which spousal violence occurs, since 81% of spousal violence victims also reported being the victims of psychological and financial abuse. Almost one-third of victims suffered the most severe types of spousal violence Half of spousal violence victims in the territories (50%) reported experiencing more than one incident of spousal violence during the previous five years, and close to one victim in five (18%E ) reported being the victim of at least 10 incidents during this same period. The violence reported by victims took various forms, from those that could be considered to be less severe (such as being threatened, having an object thrown at oneself, or being pushed or slapped) to the most severe forms (such as being beaten, choked, threatened with a gun or knife or sexually assaulted). Just over 4 out of 10 victims (43%) reported having experienced solely the less severe forms of spousal violence. However, approximately 3 in 10 (32%E ) reported having been the victim of the most severe types of violence (Chart 7).
  • 14. Statistics Canada—Catalogue no. 85-002-X14 Juristat Article—Criminal victimization in the territories, 2014 Those who were the victims of several incidents of spousal violence were more likely to report having experienced the most severe types of violence. For example, close to two-thirds (66%E ) of those who were victims at least 10 times reported experiencing the most severe forms of spousal violence, compared with less than one-quarter (24%E ) of the victims who reported three or fewer incidents. Aboriginal people over-represented among spousal violence victims in the territories As in 2009, Aboriginal people were over-represented among victims of spousal violence in the territories, particularly with respect to its most severe forms. In 2014, Aboriginal people represented just under half (49%) of the spousal population of the territories, but three-quarters (75%) of victims of spousal violence in the previous five years. Further, Aboriginal people represented 93% of victims of the most severe forms of spousal violence, that is, having been beaten, choked, threatened with a weapon or sexually assaulted. Drug use associated with risk of spousal violence Drug use, either by the victim or the spouse, was strongly associated with spousal violence in the territories. People who stated that they used drugs during the month preceding the survey were more than three times more likely than non-drug users to have experienced spousal violence in the previous five years (29% compared with 9%) (Table 6). Similarly, nearly one-third (32%E ) of those whose current spouse used drugs in the previous month were victims of spousal violence in the past five years, compared with 6%E of those whose spouse did not use drugs. Alcohol use was also associated with spousal violence, but to a lesser extent. Among those who reported engaging in at least one binge drinking episode—that is, at least five alcoholic drinks on a single occasion—during the previous month, one in six (16%) had been a victim of spousal violence during the past five years, compared with 10% of those who did not engage in binge drinking.
  • 15. Statistics Canada—Catalogue no. 85-002-X 15 Juristat Article—Criminal victimization in the territories, 2014 People who suffered childhood maltreatment were more likely to be victims of spousal violence In 2014, the GSS included questions about abuse that Canadians may have suffered when they were under the age of 15 (see Text box 2). Several studies have shown a link between abuse experienced during childhood and victimization in adulthood, particularly spousal violence (Franklin and Kercher 2012; Parks et al. 2011; Desai et al. 2002). Those who had been victims of violence during their childhood were more likely to report having experienced spousal violence in the five years preceding the survey. In the territories, nearly one-quarter (24%E ) of those who suffered sexual abuse during childhood reported being a victim of spousal violence in the five years preceding the survey. This proportion was 19% for those who experienced physical abuse during childhood, and 8% for those who suffered no abuse during childhood (Table 6). Overall, more than half (56%) of victims of spousal violence were victims of child abuse. One-half of spousal violence cases in the territories witnessed by children In addition to direct violence suffered in childhood, indirect violence—that is, witnessing violence as a child—is thought to be associated with a greater risk of experiencing spousal violence in adulthood (Franklin and Kercher 2012). Data from the 2014 GSS indicate an association between witnessing violence in childhood and experiencing spousal violence. People who, during their childhood, witnessed parental violence toward another parent or adult were more than twice as likely to have been a victim of spousal violence (22%E compared with 9%). Research has shown that children who have witnessed violence are more likely to develop certain psychological disorders (Levendosky et al. 2013; Ellonen et al. 2013), display anti-social behaviours in adolescence (Sousa et al. 2011; Johnson and Dauvergne 2001) or become offenders themselves in adulthood (Franklin and Kercher 2012). For these reasons, it is important to not only consider the direct victims of spousal violence, but also the children who may have witnessed it. According to the 2014 GSS data, this is all the more important since spousal violence was more prevalent in couples with children. In 2014, 10% of people who were married or living common-law and had children under the age of 15 in the household were victims of spousal violence, compared with 6%E 10 of those without children. Similarly, 40% of those who had children with their ex-spouse or common-law partner were the victims of violence at the hands of that person, compared with 14%E of those who had no children with their ex-spouse or common-law partner. In approximately half of the cases of spousal violence in which there were children in the household, the victim reported that at least one child had witnessed the violence. One-half of spousal violence victims suffered injuries Approximately one-half (49%) of victims of spousal violence in the five years preceding the survey reported sustaining injuries on at least one occasion due to the violence, a proportion higher than that recorded in the provinces (31%) (Chart 8).
  • 16. Statistics Canada—Catalogue no. 85-002-X16 Juristat Article—Criminal victimization in the territories, 2014 The proportion of victims sustaining injuries ranged from 56% among female victims to 42%E among male victims. However, this difference was not statistically significant. There were also variations among the territories in the proportions of victims who sustained injuries. For example, Nunavut was the territory where residents with a spouse or common-law partner (current or ex) were the most likely to report being victim of spousal violence causing injuries.11 The majority of spousal violence victims were affected emotionally In addition to physical injuries, spousal violence victims can be affected emotionally or psychologically. The majority of victims reported being affected emotionally in some way, while only 12%E said they were not much affected or not at all affected. The most common reactions were feeling upset (32%E ), angry (27%) or hurt or disappointed (24%E ) (Chart 9).
  • 17. Statistics Canada—Catalogue no. 85-002-X 17 Juristat Article—Criminal victimization in the territories, 2014 In 2014, victims who reported being affected emotionally by violence were asked a series of four questions on the long-term effects of violence. These questions were taken from the Primary Care PTSD Screen (PC-PTSD) tool (see Text box 4). In the territories, more than one-third of victims of spousal violence reported feeling at least one of these effects in the month preceding the survey. Text box 4 Post-Traumatic Stress Disorder Some research to date has found that victims of violence may experience Post Traumatic Stress Disorder (PTSD), which can affect individuals that have experienced physical and/or psychological trauma, and is characterized by feelings of detachment, being constantly on guard, nightmares and avoidance behaviors. Studies of those affected have found that PTSD is associated with impaired physical health, decreased quality of life and increased mortality (Prins et al. 2003). Victims were asked whether they had experienced the following as a result of their victimization: In the past month have you: 1. Had nightmares about it or thought about it when you did not want to? 2. Tried hard not to think about it or went out of your way to avoid situations that reminded you of it? 3. Felt constantly on guard, watchful or easily startled? 4. Felt numb or detached from others, activities or your surroundings? These new questions included in the GSS are from the Primary Care PTSD Screen (PC-PTSD) tool, a front-line assessment tool used to identify individuals who should be referred to further psychological and psychiatric treatment for the disorder (Prins et al. 2003). The tool is designed to assess whether an individual demonstrates key affects related to the core PTSD symptoms of re-experiencing, numbing, avoidance and hyperarousal. If an individual answers ‘yes’ to any three of the four questions, the presence of PTSD is suspected. It is crucial to note that the PC-PTSD is not a diagnostic tool, and a suspicion of PTSD is not the same as a diagnosis. In a clinical setting, a positive score on the PC-PTSD would indicate that the patient should be referred for more in-depth assessment and possible diagnosis.
  • 18. Statistics Canada—Catalogue no. 85-002-X18 Juristat Article—Criminal victimization in the territories, 2014 Close to half of spousal violence cases in the territories were reported to police In almost half (49%) of cases of spousal violence, the abuse was reported to the police. This proportion was almost twice as high as what was recorded in the provinces (29%). Contrary to non-spousal violence, the police were almost as likely to have been alerted personally by the victim (25%) rather than through another means (24%). On average, the police were notified after the fourth incident of spousal violence. Spousal violence was more likely to be brought to the attention of police in the Northwest Territories (61%) or Nunavut (50%) than in Yukon (23%E ). Nearly one-quarter of spousal violence victims used victim assistance services In addition to assistance from the police, victims of spousal violence may be able to turn to a number of services for victims, including crisis centres, shelters, victim assistance programs, psychologists and social workers. Just under one-quarter (23%) of spousal violence victims in the territories used at least one of these services. About two-thirds of victims who did not make use of these services stated that they did not want or need assistance. Characteristics of violent incidents In the 2014 GSS, violent crime victims were asked to provide details on the nature of the incidents they had experienced. This information can provide a better understanding of the context in which violent incidents occur. Spousal violence is excluded from the analysis below, as it was addressed in the previous section. Most offenders were men Similar to what was observed in the provinces and to findings from police-reported data, the majority of offenders (77%) were male. For the most part, the offenders were also relatively young; according to the victims, 80% of the offenders were under the age of 45 and 33%E were under 25 years (Table 7). Violence is often related to alcohol or drug use by the offender Not only are alcohol and drug use associated with an increased risk of violent victimization, but according to the victims, violent incidents are often linked to alcohol or drug use by the offender. Close to two-thirds (63%) of victims of violent crime said this was the case in their situation (Table 7). Most violent incidents do not involve a weapon The presence of a weapon is an element that can be used to measure the seriousness of a crime. For example, the presence of a weapon is one of the criteria used to classify the different levels of physical assault and sexual assault under the Criminal Code. In 2014, just over one-quarter (27%E ) of victims of non-spousal violent crimes reported the presence of a weapon during the incident (Table 7). This proportion is relatively similar to that observed in 2009. Less than one-third of violent incidents occurred in a private residence Less than one-third (31%E ) of violent incidents occurred in a private residence, either the victim’s or another person’s. Most incidents (65%) occurred in a commercial or institutional establishment or in a public place. Furthermore, one violent incident in five (20%E ) occurred at the victim’s place of work (Table 7). Consequences of victimization Victimization can have multiple consequences, from physical injury to psychological effects and financial loss. The scope of the consequences can, in fact, help assess the seriousness of a crime. Information on the consequences of victimization is also helpful in determining victims’ needs. The consequences of spousal violence are excluded from the following analysis since they were addressed previously.
  • 19. Statistics Canada—Catalogue no. 85-002-X 19 Juristat Article—Criminal victimization in the territories, 2014 Decrease in the proportion of violent crimes causing injury According to the 2014 GSS in the territories, approximately one in six (16%E ) victims of violent crime, excluding spousal violence, reported having sustained injuries as a result of the incident. Five years earlier, this proportion was more than double (36%). Yukon residents were the least likely to report injuries, with the majority (93%) having sustained none (Table 7). By comparison, this proportion was 73% in Nunavut. In addition to the presence of a weapon, causing injury is another criterion that can be used to classify the different levels of physical assault and sexual assault under the Criminal Code. Nearly two-thirds of victims reported being affected emotionally Nearly two-thirds of the victims (63%) reported having been affected emotionally by the incident. This proportion was somewhat higher for household crime (68%) than it was for theft of personal property (58%).12 The most common emotional reactions included feeling angry (26%), upset, confused or frustrated (21%), annoyed (8%E ) or hurt or disappointed (8%E ) (Chart 10). A quarter of victims experienced long-term effects In 2014, victims who said that they had been emotionally affected were asked subsequent questions on the long-term effects of victimization (see Text box 4). Nearly one-quarter (24%) of all victims in the territories reported experiencing at least one of these effects. However, this proportion was higher among violent crime victims (37%) than household crime victims (21%E ). Just over 1 victim in 20 reported experiencing at least three of these effects, indicating that post-traumatic stress disorder is suspected (Chart 11).
  • 20. Statistics Canada—Catalogue no. 85-002-X20 Juristat Article—Criminal victimization in the territories, 2014 Overall, the long-term effect mentioned most often was being on guard and easily startled (16%E ). However, among violent crime victims, the effect mentioned most often was trying hard not to think about the incident and going out of their way to avoid situations that reminded them of it (28%E ). More than one in six victims had to take time off from their daily activities due to the incident As a result of the incident they experienced, some victims were unable to continue their daily activities for at least one day, because they needed to receive care for an injury, recover emotionally, replace stolen property, take legal action or for some other reason. This was the case for 17% of victims in the territories in 2014. Women (22%) were more likely than men (13%) to be unable to continue their daily activities. The same could be said for Aboriginal people (23%) compared with non-Aboriginal people (12%). Overall, the median time that victims were absent from daily activities was three days, but this increased to seven days for victims of violent crimes. Six in ten victims suffered financial loss Financial loss is another consequence that victims often experience. In 2014, 6 in 10 victims (60%) in the territories reported financial losses. Victims of household crime (87%) and of theft of personal property (84%) were the most likely to report losses. Among those victims who reported losses and who were able to establish the amounts, most (82%) reported losses of under $1,000.
  • 21. Statistics Canada—Catalogue no. 85-002-X 21 Juristat Article—Criminal victimization in the territories, 2014 Reporting to police Reporting to police increased in the territories In 2009, less than one-third (30%) of criminal incidents in the territories were reported to the police. However, by 2014, this proportion had risen to 36%. By comparison, in the provinces the overall rate of reporting to the police remained relatively stable during the same period. The increase in reporting in the territories was mainly attributable to a rise in the reporting rate for incidents of household victimization, which increased from 30% in 2009 to 38% in 2014. The rate of reporting violent incidents, which rose from 31% to 42%, also contributed to the overall increase, though the difference from 2009 was not statistically significant. The rate of reporting thefts of personal property remained stable (Table 8 and Chart 12). Reporting rates varied slightly from one territory to another, without any statistically significant differences. Most incidents not reported to the police were considered by the victim as being too minor to report Several reasons can lead a person to decide whether to report a criminal incident to the police. In the GSS, respondents who did not report an incident were asked about their reasons for not doing so. The most common reason cited (78%) for not reporting an incident to the police in the territories was that it was too minor to be worth reporting. This proportion was lower in Nunavut (70%), though it was still the most frequently cited reason by victims in that territory (Table 9). The other most common reasons were that the police would not consider the incident important enough (68%), that it was a personal matter (50%), that no one was harmed or there was no financial loss (49%), that there was a lack of evidence (47%) or that they would not be able to find the property or identify the offender (46%).
  • 22. Statistics Canada—Catalogue no. 85-002-X22 Juristat Article—Criminal victimization in the territories, 2014 Conversely, the most common reasons cited for reporting to police was because of a sense of duty (61%), to arrest and punish the offender (45%) or to receive protection or stop the incident (43%).13 Few victims in the territories used victim services Very few victims made use of formal victim services, such as shelters, crisis centres, help lines, support programs for victims or those who have witnessed criminal acts or social workers. Victims made use of this type of service in only 5%E of cases. The most common reasons cited by victims for not using formal victim services was that they thought they didn’t need or didn’t want help (61%), the incident was too minor (23%), they didn’t know about any of these services (5%E ) or because none were available (4%E ).14 Conversely, the majority (92%) of victims confided in someone, most often a friend or neighbour (72%), family member (70%) or colleague (47%). Perception of safety, crime and the justice system Most residents of the territories satisfied with their personal safety from crime In addition to the study of victims, the 2014 GSS looked at perceptions of personal safety among the residents in the territories, whether or not they had been the victim of a crime. Overall, the majority (87%) of residents reported that they were either very satisfied or satisfied with their personal safety from crime, while 4% reported that they were either dissatisfied or very dissatisfied. Yukon residents were slightly more likely to report being very satisfied with their personal safety from crime when compared with Nunavut residents (38% and 31%, respectively) (Table 10). Research has found that women report a greater fear of victimization relative to men, usually stemming from feelings of vulnerability (Ambrey et al. 2014; Snedker 2015). The 2014 GSS asked respondents about their feelings of safety in specific situations, such as when walking alone at night. The results show even greater differences between females and males when asked those specific questions. For example, about one-third (34%) of females residing in the territories reported feeling very safe walking alone at night, compared with almost two-thirds (62%) of males. Of note, when respondents were asked about their overall satisfaction with their personal safety, 90% of males reported being satisfied with their personal safety, compared to 83% of females. Those victimized during childhood were less likely to report being satisfied with their personal safety Research has shown a relationship between childhood abuse and long-term adverse consequences for victims, such as lower feelings of safety (Cashmore and Shackel 2013; Desai et al. 2002; Walsh et al. 2010). Results from the 2014 GSS are in line with these studies, especially with regard to satisfaction with personal safety from crime. People in the territories who had been victimized during childhood were less likely to report feeling very satisfied with their personal safety (28%) compared to those who had not been victimized during childhood (38%). When asked about their perception of how well their local police were doing in ensuring the safety of citizens in their area, those who had been both physically and sexually victimized during childhood were more likely than those who had not been victimized to report that their local police were doing a poor job (17% and 7%, respectively). Aboriginal residents in the territories less satisfied with their personal safety from crime Overall, Aboriginal people living in the territories were somewhat less likely than non-Aboriginal people to report feeling very satisfied with their personal safety from crime (31% and 36%, respectively).15 This difference was the largest for Yukon residents, with 28% of Aboriginal people reporting feeling very satisfied with their personal safety from crime compared to 42% of non-Aboriginal people. Some research has found that a weaker sense of belonging to the community is associated with increased fear of victimization (Mason et al. 2013). However, this did not appear to be the case in the territories, where Aboriginal people were more likely to report a very strong sense of belonging to their local community in comparison to non-Aboriginal people (40% compared to 24%, respectively). Despite reporting lower feelings of safety and higher rates of victimization (Perreault 2015; Perreault 2011; Brennan 2011), Aboriginal people in the territories were less likely than non-Aboriginal people to think that crime was higher in their
  • 23. Statistics Canada—Catalogue no. 85-002-X 23 Juristat Article—Criminal victimization in the territories, 2014 neighbourhood than elsewhere in Canada (6% compared to 10%). This was particularly true in Nunavut, where 8% of Aboriginal people thought crime in their neighbourhood was higher than elsewhere in Canada, compared to 47% of non- Aboriginal people. Majority of territorial residents believed crime in their community was lower than elsewhere in Canada Neighbourhood characteristics may play a role in shaping residents’ perceptions of crime (Wu et al. 2009). Respondents to the 2014 GSS were asked a series of questions about the characteristics of their community, including whether they thought that crime in their community was higher or lower than other communities in Canada, whether they thought that their neighbours would call the police if they witnessed criminal behaviour, their level of trust in their neighbours, and their sense of belonging to their local community. There were some differences in the perception of neighbourhood crime across the territories. Three-quarters of residents of Yukon thought crime was lower in their community than elsewhere in Canada, a proportion similar to that observed in the provinces (74%) but higher than that recorded in Nunavut (53%) (Table 10). Respondents who reported that they thought their community had a higher amount of crime than elsewhere in Canada were less likely to report feeling very safe when walking alone at night compared to respondents who thought that their community had a lower amount of crime (18%E versus 55%). Half of Nunavut residents report signs of social disorder in their community Fear of victimization can be linked to residents’ perceptions of social disorder in their communities (Ross and Jang 2000). Respondents to the 2014 GSS were asked a series of questions about their perception of social disorder in their community. Overall, 41% of residents of the territories reported that at least one type of social disorder was a big or moderate problem in their neighbourhood. More specifically, residents of Nunavut were the most likely to report at least one sign of social disorder, while residents of Yukon were the least likely (50% versus 28%, respectively) (Table 10). Of the seven types of social disorder measured by the GSS, the most commonly reported by territorial residents included: people being drunk or rowdy in public places (26%), people dealing or using drugs (22%), garbage or litter lying around (16%) and vandalism, graffiti and other deliberate damage to property or vehicles (15%). Confidence in the police increased since 2009 As part of the 2014 GSS, respondents were asked a series of questions about their confidence in the criminal justice system, such as the police or the criminal courts. Overall, 83% of territorial residents reported having confidence in their local police, up from 71% in 2009. More precisely over one-third (36%) reported having a great deal of confidence, up from 22% in 2009, and 46% reported having some confidence (Table 11). The largest increases were found in Yukon, where 85% reported having confidence in their police in 2014, compared to 69% in 2009, and in the Northwest Territories (85% compared to 74%). Residents of Nunavut were the least likely to report having confidence in their local police (76% compared to 85% in both Yukon and the Northwest Territories).16 In addition to the question on overall confidence in the police, the GSS on victimization also asked Canadians whether they believe their local police are doing a good job, an average job, or a poor job at a number of specific activities. In general, most people in the territories thought their police were doing a good or average job. This was particularly true for being approachable and easy to talk to, where 64% of residents thought their police were doing a good job and 22% thought they were doing an average job. However, 17% thought their local police were doing a poor job at informing the public on prevention and 16% thought local police were doing a poor job at promptly responding to calls. In addition, 12% of residents in Canada’s territories reported that they thought their local police were doing a poor job in treating people fairly, down from 15% in 2009. Confidence in police lower among Aboriginal people In general, Aboriginal people in the territories were less likely to have positive opinions of their local police. For example, those who identified as being Aboriginal were less likely to report having a great deal of confidence in the police compared to those who did not identify as being Aboriginal (30% compared with 43%, respectively).
  • 24. Statistics Canada—Catalogue no. 85-002-X24 Juristat Article—Criminal victimization in the territories, 2014 Moreover, less than half (49%) of Aboriginal people thought that the police were doing a good job of treating people fairly, compared with 56% of non-Aboriginal people. Similar differences were found with respect to the enforcing of laws, promptly responding to calls, being approachable and easy to talk to, and ensuring the safety of the citizens in the neighbourhood (Table 11). In the past, it has been found that people who have had, for any reason, a contact with the police tended to have a more negative perception of police (Perreault and Hotton Mahoney 2012). Overall, 43% of Aboriginal people in the territories reported that they had, for one reason or another, contact with the police in the preceding 12 months. This proportion was similar among non-Aboriginal people living in the territories (40 %). Compared to their non-Aboriginal counterparts, Aboriginal people in the territories were more likely to report having had contact with the police for being arrested or for problems with their emotions, mental health or alcohol or drug use or for a family member’s experiences with these issues (19% compared to 3%). Summary For many years, police data have indicated that police-reported crime is higher in the territories than in the provinces. Data from the 2014 GSS on victimization, which include crimes reported to the police as well as unreported crimes also shows higher victimization rates in the territories. Nonetheless, victimization rates in the territories fell between 2009 and 2014, with a 29% decrease in violent victimization and a 34% decrease in household victimization. These decreases were mainly attributable to the decreases recorded in Yukon, the territory that also recorded the lowest victimization rates in 2014. However, contrary to what was observed in the provinces, where the rate of spousal violence dropped from 6% in 2009 to 4% in 2014, the spousal violence rate in the territories remained relatively stable during this time period. Despite relatively high victimization rates, most residents of the territories reported being satisfied with their personal safety and generally had a positive opinion of their police service. As well, the rate of reporting to the police recorded in 2014 (36%) was higher than the rate observed in 2009 (30%). Survey description In 2014, Statistics Canada conducted the victimization cycle of the General Social Survey (GSS) for the sixth time in the provinces. Previous cycles were conducted in 1988, 1993, 1999, 2004 and 2009. The purpose of the survey is to provide data on Canadians’ personal experiences with eight offences, examine the risk factors associated with victimization, examine rates of reporting to the police, assess the nature and extent of spousal violence, measure fear of crime, and examine public perceptions of crime and the criminal justice system. The 2014 survey on victimization was also conducted in Yukon, Northwest Territories and Nunavut using a different sampling design. The GSS on victimization was also conducted in the territories in 2009 and was preceded by test collections in 1999 and 2004. The target population included all persons 15 years and older in the three territories, excluding full-time residents of institutions. Once a household was contacted, an individual 15 years or older was randomly selected to respond to the survey. In 2014, the sample size was 2,040 respondents, about twice the number of respondents in 2009 (1,094). Data collection Data collection took place from August 2014 to January 2015 inclusively. The method of collection was a mixture of telephone (CATI) and personal interviews (CAPI). Most cases started as CATI at the regional office and could be transferred to a CAPI-interviewer depending on the community and collection constraints. Respondents were interviewed in the official language of their choice.
  • 25. Statistics Canada—Catalogue no. 85-002-X 25 Juristat Article—Criminal victimization in the territories, 2014 Response rates The overall response rate was 58.7%, up from 50.7% in 2009. Non-respondents included people who refused to participate, could not be reached, or could not speak English or French. Respondents in the sample were weighted so that their responses represent the non-institutionalized territories population aged 15 and older. Data limitations As with any household survey, there are some data limitations. The results are based on a sample and are therefore subject to sampling errors. Somewhat different results might have been obtained if the entire population had been surveyed. This article uses the coefficient of variation (CV) as a measure of the sampling error. Estimates with a high CV (over 33.3%) were not published because they were too unreliable. In these cases, the symbol “F” is used in place of an estimate in the figures and data tables. Estimates with a CV between 16.6 and 33.3 should be used with caution and the symbol “E” is used. Where descriptive statistics and cross-tabular analyses were used, statistically significant differences were determined using 95% and 90% confidence intervals. References Allen, M. and S. Perreault. 2015. “Police-reported crime in Canada's Provincial North and Territories, 2013.” Juristat. Vol. 35, no. 1. Statistics Canada Catalogue no. 85-002-X. Ambrey, C.L., Fleming C.M. and M. Manning. 2014. “Perceptions or reality, what matters most when it comes to crime in your neighbourhood?” Social Indicators Research. Vol. 119, no. 2. p. 877-896. Boyce, J. 2015. “Mental health and contact with police in Canada, 2012.” Juristat. Vol. 35, no. 1. Statistics Canada Catalogue no. 85-002-X. Brennan, S. 2011. “Violent victimization of Aboriginal women in the Canadian provinces, 2009.” Juristat. Vol. 30, no. 2. Statistics Canada Catalogue no. 85-002-X. Brown, B.B., Perkins D.D. and G. Brown. 2004. “Incivilities, place attachment and crime: Block and individual effects.” Journal of Environmental Psychology. Vol. 24. p. 359- 371. Cantos VII, O.D. 2006. “We can do better: Supporting crime victims with disabilities.” Networks. Summer/Fall 2006. National Center for Victims of Crime. USA. Cashmore, J. and R. Shackel. 2013. “The long-term effects of child sexual abuse.” Child family Community Australia. Paper no. 11. Australian Institute of Family Studies. Charron, M. 2009. “Neighbourhood characteristics and the distribution of police-reported crime in the city of Toronto.” Crime and Justice Research Paper Series. No. 18. Statistics Canada Catalogue no. 85-561-M. Desai, S., Arias I., Thompson M.P. and K.C. Basile. 2002. “Childhood victimization and subsequent adult revictimization assessed in a nationally representative sample of women and men.” Violence and Victims. Vol. 17, no. 6. p. 639-653. Douglas, K.S. and R.K Otto. 2010. Handbook of Violence Risk Assessment. Routledge. Ellonen, N., Piispa M., Peltronen K. and M. Oranen. 2013. “Exposure to parental violence and outcomes of child psychosocial adjustment.” Violence and Victims. Vol. 28, no. 1. p. 3-15. Forrest, R. and A. Kearns. 2001. “Social cohesion, social capital and the neighborhood.” Urban Studies. Vol. 38. p. 2125-2143. Franklin, C.A. and G.A. Kercher. 2012. “The intergenerational transmission of intimate partner violence: Differentiating correlates in a random community sample.” Journal of Family Violence. Vol. 27, no. 3. p. 187-199. Johnson, H. and M. Dauvergne. 2001. “Children witnessing family violence.” Juristat. Vol. 21, no. 6. Statistics Canada Catalogue no. 85-002-X. Levendosky, A.A., Bogat G.A. and C. Martinez-Torteya. 2013. “PTSD symptoms in young children exposed to intimate partner violence.” Violence Against Women. February. Lilly, J.R., Cullen F.T. and R.A. Ball. 2014. Criminological Theory, Context and Consequences. Sage publications. London. Mason, P., Kearns A. and M. Livingston. 2013. “Safe going: The influence of crime rates and perceived crime and safety in deprived neighbourhoods.” Social Science & Medicine. Vol. 91. August. p. 15-24. Mihorean, K., Besserer S., Hendrick D., Brzozowski J., Trainor C. and S. Ogg. 2001. A Profile of Criminal Victimization: Results of the 1999 General Social Survey. Statistics Canada Catalogue no. 85-553-X. Miladinovic, Z. and L. Mulligan 2015. “Homicide in Canada, 2014.” Juristat. Vol. 35, no. 1. Statistics Canada Catalogue no. 85-002-X.
  • 26. Statistics Canada—Catalogue no. 85-002-X26 Juristat Article—Criminal victimization in the territories, 2014 Parks, S.E., Kim K.H., Day N.L., Garza M.A. and C.A. Larkby. 2011. “Lifetime self-reported victimization among low-income, urban women: The relationship between childhood maltreatment and adult violent victimization.” Journal of Interpersonal Violence. Vol. 6, no. 6. p. 1111-1128. Perreault, S. 2009. “Criminal victimization and health: A profile of victimization among persons with activity limitations or other health problems.” Canadian Centre for Justice Statistics Profile Series. No. 21. Statistics Canada Catalogue no. 85-033-X. Perreault, S. 2011. “Violent victimization of Aboriginal people in the Canadian provinces, 2009.” Juristat. Vol. 31, no. 1. Statistics Canada Catalogue no. 85-002-X. Perreault, S. 2015. “Criminal victimization in Canada, 2014.” Juristat. Vol. 35, no. 1. Statistics Canada Catalogue no. 85-002-X. Perreault, S. and S. Brennan. 2010. “Criminal victimization in Canada, 2009.” Juristat. Vol. 30, no. 2. Statistics Canada Catalogue no. 85-002-X. Perreault, S. and T. Hotton Mahoney. 2012. “Criminal victimization in the territories, 2009.” Juristat. Vol. 32, no. 1. Statistics Canada Catalogue no. 85-002-X. Prins, A., Ouimette P., Kimberling R., Cameron R.P., Hugelshofer D.S., Shaw-Hegwer J., Thraikill A., Gusman F.D. and J.I. Sheikh. 2003. “The Primary Care PTSD screen (PC-PTSD): Development and operating characteristics.” Primary Care Psychiatry. Vol. 9, no. 1. p. 9-14. Reid, J.A. and C.J. Sullivan. 2009. “A model of vulnerability for adult sexual victimization: The impact of attachment, child maltreatment and scarred sexuality.” Violence and Victims. Vol. 24, no. 4. p. 485-501. Ross C.E. and S.J. Jang. 2000. “Neighborhood disorder, fear, and mistrust: the buffering role of social ties with neighbors.” American Journal of Community Psychology. Vol. 28, no. 4. p. 401-420. Sampson, R.J. 2012. The Great American City: Chicago and the Enduring Neighborhood Effect. University of Chicago Press. Snedker, K.A. 2015. “Neighborhood conditions and fear of crime: a reconsideration of sex differences.” Crime & Delinquency. Vol. 61, no. 1. p. 45-70. Sousa C., Herrenkohl T.I., Moylan C.A., Tajiman E.A., Klika J.B., Herrenkohl R.C. and M.J. Russo. 2011. “Longitudinal study on the effects of child abuse and children’s exposure to domestic violence, parent-child attachments, and antisocial behavior in adolescence.” Journal of Interpersonal Violence. Vol. 26, no. 11. p. 111-136. Walsh, K., Fortier M.A. and D. DiLillo. 2010. “Adult coping with childhood sexual abuse: A theoretical and empirical review.” Aggression and Violent Behavior. Vol. 15, no. 1. p. 1-13. Wu, Y., Sun I.Y. and R.A. Triplett. 2009. “Race, class or neighborhood context: Which matters more in measuring satisfaction with police?” Justice Quarterly. Vol. 26, no. 1. p. 125-156. Notes E use with caution 1. Unless otherwise indicated, the differences presented in the text of this report are statistically significant at p < 0.05. 2. The difference from 2009 was only significant at p < 0.1. 3. The difference compared to the overall territorial rate was only significant at p < 0.1. 4. The difference compared to the overall territorial rate was only significant at p < 0.1. 5. For victims reporting more than one incident of abuse, the relationship to the person who committed the most serious incident was requested. 6.Given the limited number of household characteristics associated with higher household victimization rates—particularly due to the fact that some questions, like those pertaining to the type of housing, were not asked in the territories—a multivariate analysis was not conducted on household victimization. As such, some factors may not be directly linked to risk of victimization if other factors were to be considered. 7. Difference significant at p < 0.1. 8. Data in previous sections included sexual assaults and physical assaults between spouses in the 12 months preceding the survey. 9. The rate of spousal violence in Nunavut was significantly higher only when compared to Yukon. The differences compared to the Northwest Territories or the territories’ average were not statistically significant (p < 0.1). 10. Difference significant at p < 0.1. 11. In Nunavut, 10% of residents with a spouse or common-law partner (current or ex) were victims of spousal violence causing injuries (16% of the spousal population having been victims of spousal violence and 62%E of those victims having
  • 27. Statistics Canada—Catalogue no. 85-002-X 27 Juristat Article—Criminal victimization in the territories, 2014 been injured). This proportion is statistically different from the corresponding proportion for the territories as a whole (6%E ). When considering the proportion of those injured among victims rather than among the spousal population, as in Chart 8, no differences were found to be statistically significant (p < 0.1) between territories. 12. Difference significant at p < 0.1. 13. Respondents were able to give more than one reason. 14. Respondents were able to give more than one reason. 15. Difference was significant at p < 0.1. 16. Due to rounding, categories in Table 11 may not exactly add up to numbers presented in the text.
  • 28. Statistics Canada—Catalogue no. 85-002-X28 Juristat Article—Criminal victimization in the territories, 2014 Detailed data tables Table 1 Victimization incidents, by type of offence and territory, 2009 and 2014 Type of offence Yukon Northwest Territories Nunavut1 All territories 2009 2014 2009 2014 2009 2014 2009 2014 number Violent victimization Sexual assault2 F F F F F F 3,637E 2,647E Robbery F F F F F F 2,141E F Physical assault 3,393E 2,662E 5,270E 3,950E 3,222E 4,734E 11,885 11,346 Total 7,236E 3,583E 6,848E 5,377E 3,579E 6,002E 17,663 14,961 Household victimization Break and enter F 702E 1,470E 828E 694E 1,048E 3,223 2,579 Motor vehicle/parts theft F F F F F 425E 1,358E 986 Theft of household property 2,218 1,412E 2,215 1,929E 953E 804E 5,386 4,145 Vandalism 1,556E 982E 1,449E 870E F 709E 3,395 2,561 Total 5,234 3,362 5,758 3,922 2,370 2,987 13,362 10,271 Theft of personal property F 4,417 4,212E 4,540E F 1,688E 7,135 10,645 Type of offence Yukon Northwest Territories Nunavut1 All territories 2009 2014† 2009 2014† 2009 2014† 2009 2014† rate Violent victimization3 Sexual assault2 F F F F F F 50E 30E Robbery F F F F F F 29E F Physical assault 127E 89E 162E 118E 227E 190E 162 129 Total 271E* 120E 210E 161E 252E 241E 240** 170 Household victimization4 Break and enter F 45E 98E* 52E 120E 110 91* 63 Motor vehicle/parts theft F F F F F 45E 39E* 24 Theft of household property 154E* 91E 147 122 164E* 84E 153** 102 Vandalism 108E 64E 96E* 55E F 74E 96** 63 Total 362** 218 383** 248 409 313 379** 252 Theft of personal property3 F 148 129E 136E F 68E 97 121 E use with caution F too unreliable to be published * significantly different from reference category (p < 0.1) ** significantly different from reference category (p < 0.05) † reference category 1. In 2009, collection was limited to Nunavut's ten largest communities and resulted in under-coverage of the Inuit population and lower response rates than those in Yukon and the Northwest Territories. Results from 2009 for Nunavut, therefore, should be used with caution. 2. As of 2014, this category includes having had non-consensual sexual relations because the victim was drugged, manipulated or forced in some way other than physically. 3. Rates are calculated per 1,000 population aged 15 years and older. 4. Rates are calculated per 1,000 households. Source: Statistics Canada, General Social Survey, 2009 et 2014.
  • 29. Statistics Canada—Catalogue no. 85-002-X 29 Juristat Article—Criminal victimization in the territories, 2014 Table 2 Victimization incidents, by selected community, territories, 2014 Territory or community Total violent victimization Total household victimization Theft of personal property number rate1 number rate2 number rate1 Yukon Whitehorse 2,919E 129E 2,520 218 4,281 189** Other communities F F 843 218 F F Total 3,583E 120E** 3,362 218 4,417 148 Northwest Territories Yellowknife 2,822E 177E 1,990 264 3,413E 214E** Other communities 2,555E 146E 1,932 234 F F Total 5,377E 161E 3,922 248 4,540E 136E Nunavut Iqaluit F F 977E 355E* F F Rankin Inlet F F 401E 469E* F F Other communities 3,547E 213E 1,608E 271E F F Total 6,002E 241E* 2,987 313* 1,688E 68E** All territories† 14,961 170 10,271 252 10,645 121 E use with caution F too unreliable to be published * significantly different from reference category (p < 0.1) ** significantly different from reference category (p < 0.05) † reference category 1. Rates are calculated per 1,000 population aged 15 years and older. 2. Rates are calculated per 1,000 households. Source: Statistics Canada, General Social Survey, 2014.
  • 30. Statistics Canada—Catalogue no. 85-002-X30 Juristat Article—Criminal victimization in the territories, 2014 Table 3 Violent victimization incidents, by selected victim's sociodemographic characteristics and territory, 2014 Characteristics Yukon Northwest Territories Nunavut All territories number rate number rate number rate number rate Sex Male† 1,337E 90E 2,442E 141E 3,288E 258E 7,066E 157E Female 2,245E 150E 2,935E 182E 2,714E 223E 7,895 182 Age 15 to 24† F F F F 2,912E 460E 5,184E 298E 25 to 44 1,822E 173E 2,517E 186E 2,112E 199E 6,450 186 45 and over 853E 57E 1,495E 113E F F 3,327E 92E** Aboriginal identity Non-Aboriginal people† 2,209E 96E 2,469E 154E F F 5,087 121 Aboriginal people1 F F 2,908E 169E 5,593E 256E 9,839 215** Inuk (Inuit) F F F F 5,433E 254E 6,274E 261E** First Nations F F F F F F 2,544E 157E Marital status Married, common-law or widowed† 1,434E 80E 2,707E 139E 2,373E 157E 6,514 124E Single 1,853E 194E** 2,209E 195E F 383E* 7,536E 251E** Separated/divorced F F F F F F 910E 165E Living arrangement of household Alone or couple without children2, † 1,276E 102E 1,731E 160E 410E 122E 3,417 128 Couple with children F F 2,254E 142E 3,906E 246E* 7,286E 169E Lone-parent family F F F F F F 2,822E 231E* Other living arrangement3 F F F F F F F F Highest level of schooling (highest degree) High school or less4, † 1,863E 125E 2,902E 149E 4,673E 244E 9,437 176 College/university 1,623E 109E 2,475E 180E 1,218E 234E 5,316E 157E Main activity Employed† 2,371E 120E 4,226E 185E 3,114E 228E 9,711E 172 Other F F 1,150E 110E F F 5,250E 165E Personal income Less than $60,000† 1,815E 127E F F 2,737E F 6,413E 167E $60,000 or more F F 2,374E 193E F F 5,601E 205E E use with caution F too unreliable to be published * significantly different from reference category (p < 0.1) **significantly different from reference category (p < 0.05) † reference category 1. Includes those who self-identified as First Nations, Métis or Inuit. 2. Includes couples living with unrelated persons. 3. Includes unrelated persons (e.g., roommates) and/or related persons who are neither spouses nor children living with their parents. 4. Includes trades. Note: Rates are calculated per 1,000 population aged 15 years and older. Source: Statistics Canada, General Social Survey, 2014.
  • 31. Statistics Canada—Catalogue no. 85-002-X 31 Juristat Article—Criminal victimization in the territories, 2014 Table 4 Violent victimization incidents, by selected health, lifestyle and dwelling characteristics and territory, 2014 Characteristics Yukon Northwest Territories Nunavut All territories number rate number rate number rate number rate Physically or sexually assaulted by an adult before age 15 No† 1,797E 95E 1,350E 68E F F 6,102E 111E Yes – physically and/or sexually assaulted1 1,751E 169E* 4,008E 330E** 2,990E 381E 8,749 288** Physical violence 1,630E 183E* 3,813E 349E** 2,886E 427E 8,329 313** Sexual violence F F F F F F 2,501E 267E** Self-rated mental health Excellent or very good† 2,063E 99E 2,749 128E 2,375 172E 7,187 128 Good 1,201E 167E F F F F 6,000E 230E* Poor or fair F F F F F F 1,712E 320E** Disability status No disability† 2,746E 128E 2,802E 108E 4,351E 224E 9,898 148 Mental-health condition or learning disability F F F F F F 1,581E 251E Physical disability F F 1,834E 358E** F F 3,412E 236E Used drugs during the month preceding the survey No† 2,511E 101E 3,472 123E 3,541E 195E 9,524 134 Yes F F F F 2,400E 366E 5,376E 333E** 5 or more alcoholic drinks in one sitting (binge drinking) during the month preceding the survey None† 1,756E 88E 2,806E 126E 4,386E 234E 8,947E 147E At least once 1,827E 196E* 2,523E 236E 1,547E 274E 5,897E 230* Number of evening activities during the month preceding the survey 0 to 14† 1,432E 88E 2,596E 151E 1,974E 165E 6,001E 132E 15 or more 2,151E 165E* 2,712E 177E 3,917E 334E** 8,780 219** Ever been homeless No† 2,598E 108E 2,929E 107E 4,258E 197E 9,785 134 Yes F F F 428E** 1,744E 550E** 5,176E 357E** Residential mobility – number of moves in past 5 years None† 1,569E 83E F F F F 7,482E 139E 1 or 2 F F 2,138E 266E 831E 139E 3,690E 178E 3 or more 1,292E 304E* F F F F 3,789E 280E** Social disorder in the neighbourhood No† 1,911E 89E 2,313E 127E F F 6,357E 122E Yes2 1,671E 198E 3,064E 201E 3,870 313 8,605 239** See notes at the end of the table.
  • 32. Statistics Canada—Catalogue no. 85-002-X32 Juristat Article—Criminal victimization in the territories, 2014 Table 4 — continued Violent victimization incidents, by selected health, lifestyle and dwelling characteristics and territory, 2014 Characteristics Yukon Northwest Territories Nunavut All territories number rate number rate number rate number rate People in neighbourhood help each other No† F F F F F F 3,031E 291E Yes 2,528E 99E 4,200E 150E 4,821E 221E 11,548 153* Likelihood that neighbours call the police if witness what seems like criminal behaviour Likely† 2,639E 100E 4,529E 154E 4,155E 220E 11,324 152 Unlikely F F F F F F 3,354E 320E E use with caution F too unreliable to be published * significantly different from reference category (p < 0.1) **significantly different from reference category (p < 0.05) † reference category 1. This total is not equal to the sum of its sub-categories, as some victims were the victims of both physical and sexual abuse. 2. Includes persons who responded that at least one of the following situations was a big or moderate problem in their neighbourhood: noisy neighbours or loud parties; people hanging around on the streets; garbage or litter lying around; vandalism; people being attacked because of their skin colour, ethnic origin or religion; people using or dealing drugs; people being drunk or rowdy in public places. Note: Rates are calculated per 1,000 population aged 15 years and older. Source: Statistics Canada, General Social Survey, 2014.
  • 33. Statistics Canada—Catalogue no. 85-002-X 33 Juristat Article—Criminal victimization in the territories, 2014 Table 5 Household victimization incidents, by selected household and neighbourhood characteristics and territory, 2014 Characteristics Yukon Northwest Territories Nunavut All territories number rate number rate number rate number rate Household size 1 or 2 people† 2,252E 234 1,887E 236 F F 5,210 253 3 or 4 people 746E 165E 1,499E 264E 1,198E 397 3,444 261 5 people or more F F F F 718 199 1,618E 230 Living arrangement of household Alone† 1,219E 277E 762E 206E F F 2,620E 276E Couple1 679E 171E 703E 220E F F 1,646 205 Couple with children 823E 198E 1,346E 234E 1,557 313 3,726 251 Lone-parent family F F 848E 388E* 438E 255E 1,830 304 Other living arrangement2 F F F F F F F F Aboriginal identity3 Non-Aboriginal households† 2,396E 223 1,457 218 468E 380E 4,321 232 Aboriginal households 755E 264E 1,965E 298E 2,282E 299 5,003 293 Other households F F 5,000E 197E F F 948E 188E Household income Less than $40,000† F F F F F 216E 1,619E 270E $40,000 to $79,999 727E 207E F 255E F 533E 1,855E 272E $80,000 to $149,999 825E 205E 750E 196E 951E 526E** 2,526 261 $150,000 or more F F 1,163E 315E 642E 420E** 2,292 319 Dwelling ownership Owned† 1,823E 177E 1,841E 204 808E 334E 4,472 205 Rented 1,539E 304** 2,081 311* 2,179E 310E 5,799 309** Living in the dwelling Less than 3 years† 1,259E 334E 1,543E 255 912E 354E 3,713 299 3 years or more 2,104E 180E* 2,379 245 2,075E 301E 6,558 232* Residential mobility – number of moves in past 5 years None† 1,694E 176E 1,976E 237E 1,581 277 5,251 222 1 or 2 1,132E 316E 1,014E 247E 729E 274E 2,875 278 3 or more 536E 240E 933E 278E F F 2,145E 321E Social disorder in the neighbourhood4 No† 1,359E 125E 1,255E 152E 519E 114E 3,134 132 Yes 2,003E 435E** 2,667 353** 2,467 494E** 7,138 416** See notes at the end of the table.
  • 34. Statistics Canada—Catalogue no. 85-002-X34 Juristat Article—Criminal victimization in the territories, 2014 Table 5 — continued Household victimization incidents, by selected household and neighbourhood characteristics and territory, 2014 Characteristics Yukon Northwest Territories Nunavut All territories number rate number rate number rate number rate People in neighbourhood help each other No† 850E 462E 902E 392E F 391E 2,172 417 Yes 2,345E 180** 2,822 218* 2,479E 299E 7,647 223** Likelihood that neighbours call the police if witness what seems like criminal behaviour Very likely 1,037E 105 2,196 241 1,099 268E 4,332 187 Somewhat likely 1,302E 363E** 1,228E 261E 1,201E 367 3,731 322** Unlikely 935E 587E** F F F F 1,965E 411E** E use with caution F too unreliable to be published * significantly different from reference category (p < 0.1) ** significantly different from reference category (p < 0.05) † reference category 1. Includes couples living with unrelated persons. 2. Includes unrelated persons (e.g., roommates) and/or related persons who are neither spouses nor children living with their parents. 3. Non-Aboriginal households consist of households in which both spouses do not have Aboriginal identity; lone-parent families in which the parent does not have an Aboriginal identity; single people with no Aboriginal identity; and other households in which the respondent reported having no Aboriginal identity and living with related people only. Aboriginal households consist of households in which both spouses have Aboriginal identity; lone-parent families in which the parent has Aboriginal identity; single people with Aboriginal identity; and other households in which the respondent reported having Aboriginal identity and living with related people only. All other households are included in the "other households" category. 4. Includes persons who responded that at least one of the following situations was a big or moderate problem in their neighbourhood: noisy neighbours or loud parties; people hanging around on the streets; garbage or litter lying around; vandalism; people being attacked because of their skin colour, ethnic origin or religion; people using or dealing drugs; people being drunk or rowdy in public places. Note: Rates are calculated per 1,000 households. Source: Statistics Canada, General Social Survey, 2014.
  • 35. Statistics Canada—Catalogue no. 85-002-X 35 Juristat Article—Criminal victimization in the territories, 2014 Table 6 Spousal violence victims, by selected characteristics, territories, 2014 Characteristics Current relationship1 Previous relationship2 Current or previous relationship number percent number percent number percent Territory All territories† 4,136 8 2,859 23 6,956 12 Yukon F F 886E 18E 1,369E 7E** Northwest Territories 1,644E 9E 1,262E 26E 2,906E 13E Nunavut 1,979 13** 710E 27E 2,681 16** Sex Male† 2,148E 8E 1,336E 21E 3,453 12 Female 1,988E 8E 1,523 25 3,503 12 Age 15 to 24 F F F F F F 25 to 34† 1,532E 14E 1,337E 49E 2,869E 22E 35 to 44 1,509E 13E 665E 26E** 2,144E 16E 45 to 54 634E 6E** F F 1,077E 8E** 55 and over F F F F F F Highest level of schooling (highest degree) Less than high school† 1,366E 11E 897E 44E 2,232E 15 High school/trade 1,703E 11E 832E 22E* 2,527E 14 College/university 1,066E 5E* 1,130E 17E** 2,197E 8E** Main activity Employed† 3,227E 9E 1,568E 17E 4,764 11 Student F F F F F F Household work 482E 9E F 58E** 1,025E 18E Other F F F F 678E 8E Personal income Less than $30,000† 707E 8E 1,296E 48E 1,995E 17E $30,000 to $79,999 2,021E 13E 449E 11E** 2,470E 14E $80,000 or more 843E 6E F F 1,121E 7E** Aboriginal identity Non-Aboriginal people† 853E 3E 888E 13E 1,741E 6E Aboriginal people 3,283 13** 1,971E 36E** 5,215 18** First Nation F F x x 1,655E 17E** Inuit 2,301E 17E** F 36E** 3,010 20E** Métis x x F F F F See notes at the end of the table.
  • 36. Statistics Canada—Catalogue no. 85-002-X36 Juristat Article—Criminal victimization in the territories, 2014 Table 6 — continued Spousal violence victims, by selected characteristics, territories, 2014 Characteristics Current relationship1 Previous relationship2 Current or previous relationship number percent number percent number percent Physically or sexually assaulted by an adult before age 15 Never† 1,433E 5E 1,452E 23E 2,855 8 At least once 2,563E 14E** 1,372E 24E 3,928 18** Physical violence 2,287E 15E** 1,233E 24E 3,520 19** Sexual violence 1,317E 23E** F F 1,716E 24E** Witnessed violence during childhood No† 2,343E 6E 2,010E 23E 4,323 9 Yes3 1,719E 19E** F 22E 2,389E 22E** Self-rated mental health Excellent† F F 959E 22E 1,390E 7E Very good 1,568E 9E 599E 16E 2,876E 12E Good 1,943E 13E F 26E 2,159E 16E** Poor or fair F F F F 474E 23E** Used drugs during the month preceding the survey Yes† 1,760E 24E F 34E 2,719E 29 No 2,368E 6E** 1,861E 20 4,198 9** Spouse/partner used drugs during the month preceding the survey Yes† 1,611E 32E ... ... ... ... No 2,476E 6E** ... ... ... ... 5 or more alcoholic drinks in one sitting (binge drinking) during the month preceding the survey Yes† 1,169E 9E 1,494E 31E 2,663E 16E No 2,919E 8E 1,275E 17E* 4,155 10** Spouse/partner had 5 or more alcoholic drinks in one sitting (binge drinking) during the month preceding the survey Yes† 2,812E 11E ... ... ... ... No 1,174E 8E ... ... ... ... ... not applicable x suppressed to meet the confidentiality requirements of the Statistics Act E use with caution F too unreliable to be published * significantly different from reference category (p < 0.1) ** significantly different from reference category (p < 0.05) † reference category 1. Includes legally married and common-law spouses. 2. Includes those separated or divorced from a legal marriage or common-law union and had contact with ex-partner in the 5 years preceding the survey. 3. Includes people who witnessed violence committed by a parent, step-parent or guardian against another adult at least once before age 15. Source: Statistics Canada, General Social Survey, 2014.
  • 37. Statistics Canada—Catalogue no. 85-002-X 37 Juristat Article—Criminal victimization in the territories, 2014 Table 7 Characteristics of violent victimization incidents, by territory, 2014 Characteristics Yukon Northwest Territories Nunavut All territories† percent Location of the incident Private residence F 35E 29E 31 Commercial or institutional establishment or public place 67 59 70 65 Other F F F F Location of the incident is the victim's place of work1 Yes F F F 20E No 70 78 74 74 Don't know/refusal F F F F Sex of offender2 Male 68E 81 80 77 Female F F F 23E Age of offender2 Under 25 years old F F F 33E 25 to 44 F 53 47E 47 45 years or older F F F 17E Relationship of offender to the victim3 Stranger F 50 F 41E Known to victim 64 50E 65 59 Don't know/refusal F F F F Number of offenders One 87 84 85 85 Two or more F F F F Incident related to the offender's alcohol or drug use Yes 63 72 54E 63 No F F F 26E Don't know/refusal F F F F Presence of a weapon Yes F F F 27E No 71 67 70 69 Caused injuries Yes F F F 16E No 93** 86 73** 84 See notes at the end of the table.
  • 38. Statistics Canada—Catalogue no. 85-002-X38 Juristat Article—Criminal victimization in the territories, 2014 Table 7 — continued Characteristics of violent victimization incidents, by territory, 2014 Characteristics Yukon Northwest Territories Nunavut All territories† percent Victim reports effects consistent with post-traumatic stress disorder symptoms4 Yes F F F F No 91 86 86 88 E use with caution F too unreliable to be published ** significantly different from reference category (p < 0.05) † reference category 1. Due to an error in the survey application, victims who reported the location of the incident as “Other” were not asked the place of work question. Approximately one- third of these incidents were recoded based on other information provided. The proportions on place of work presented in this table were calculated solely for incidents for which there was a valid response. 2. Excludes incidents for which there was more than one offender. 3. Includes incidents for which the victim identified the number of offenders. If there was more than one offender, the relationship is that of the offender with the closest relationship to the victim. 4. Based on the Primary Care Post-Traumatic Stress Disorder Screen. Includes people who reported at least three of the four symptoms evaluated. Note: Excludes incidents of sexual assault and physical assault between spouses. The answers “Don't know” and “Refusal” are included in the calculation of the percentages, but may not appear in the table when they represent less than 5% of responses. Because of the inclusion of the answers “Don’t know” and “Refusal” and of rounding, percentages may not add up to 100. Source: Statistics Canada, General Social Survey, 2014.
  • 39. Statistics Canada—Catalogue no. 85-002-X 39 Juristat Article—Criminal victimization in the territories, 2014 Table 8 Victimization incidents, by reporting to police and territory, 2009 and 2014 Type of offence Yukon Northwest Territories Nunavut All territories Not reported Reported Not reported Reported Not reported Reported Not reported Reported Not reported Reported 2014 2009 2014† percent Total victimization1 63 36 63 36 65 34 66 30* 64 36 Violent victimization incidents1 Sexual assault2 F F F F F F F F 90 F Robbery F F F F F F F F F F Physical assault F F F F 60 40E 54 39E 50 50 Total F 45E 52 47E 66 33E 62 31E 58 42 Household victimization incidents Break and enter F F F F 41E 59 62* 31E** 46 54 Motor vehicle/parts theft F F F F F F F F 65 F Theft of household property 73 F 82 F 84 F 81 18 79 20E Vandalism F F F F F F 57 42E 46 53 Total 60 39 65 35 58 42 68 30** 61 38 Theft of personal property 72 F 72 F 76 F 72 27E 73 27 E use with caution F too unreliable to be published * significantly different from reference category (p < 0.1) ** significantly different from reference category (p < 0.05) † reference category 1. Excludes incidents of sexual assault and physical assault between spouses. 2. As of 2014, this category includes having had non-consensual sexual relations because the victim was drugged, manipulated or forced in some way other than physically. Source: Statistics Canada, General Social Survey, 2009 and 2014.
  • 40. Statistics Canada—Catalogue no. 85-002-X40 Juristat Article—Criminal victimization in the territories, 2014 Table 9 Reasons for not reporting victimization incidents to the police, by territory, 2014 Reason for not reporting Yukon Northwest Territories Nunavut All territories† percent Crime was minor and not worth taking the time to report 81 82 70* 78 Police wouldn't have considered the incident important enough 74 67 62 68 Incident was a private or personal matter and was handled informally 48 51 51 50 No one was harmed/no financial loss 53 49 46E 49 Lack of evidence 45 53 42 47 Police wouldn’t have found property/offender 46 50 41E 46 Did not want the hassle of dealing with the police 38 48 40 42 Police would not have been effective 36 38 39E 37 Offender would not be convicted or adequately punished 31 42 40E 38 No harm was intended 33E 37 34E 35 Feared or did not want the hassle of dealing with the court process 20E 33E F 25 Did not want to get the offender in trouble F F F 15E Unsatisfactory service (from police) in the past 15E 18E 10E* 14E Didn’t want others to know F F F 8E Reported to another official F F F 8E Police would be biased F F F 7E Insurance wouldn’t cover it F F F 7E Nothing was taken/all items were recovered F F F 6E Did not need a police report to file claim F F F 4E E use with caution F too unreliable to be published * significantly different from reference category (p < 0.1) † reference category Note: Respondents were able to give more than one reason. Excludes incidents of sexual assault and physical assault between spouses. Source: Statistics Canada, General Social Survey, 2014.
  • 41. Statistics Canada—Catalogue no. 85-002-X 41 Juristat Article—Criminal victimization in the territories, 2014 Table 10 Perceptions of safety, crime and neighbourhood, by gender and territory, 2014 Perceptions of safety, crime and neighbourhood Yukon Northwest Territories Nunavut All territories Males Females Total† percent Satisfaction with personal safety from crime Very satisfied 38** 33 31 39** 29 34 Satisfied 51 52 57* 52 55 53 Neither satisfied nor dissatisfied 7E 10* 7E 6** 10 8 Dissatisfied or very dissatisfied 3E 5E 3E 2E** 5E 4 No opinion/don't know/refusal F F F 1E 1E 1E Compared to other areas in Canada, do you think crime in your neighbourhood is... ... Higher? 4E** 8E 12** 9 7 8 ... About the same? 18** 23 29** 21 25 23 ... Lower 75** 64 53** 67* 62 65 ... Don't know/refusal 3E** 4E 6** 3E** 5 4 During the last 5 years, do you think that crime in your neighbourhood has... ... Increased? 13 19* 15 12** 20 16 ... Decreased? 9E 9E 9E 11* 8 9 ... Remained about the same 71 65* 72 72** 66 69 ... Just moved/has not lived in neighbourhood long enough/refusal 7 7E 4E** 5E 7 6 Feeling of safety when walking alone at night in the neighbourhood Very safe 54** 41** 51 62** 34 48 Reasonably safe 31 32 27* 27** 34 30 Somewhat unsafe or very unsafe 6E** 14** 10E 8** 12 10 Do not walk alone 9** 14* 12 3E** 20 11 Don't know/refusal F F F F F F Social disorder – following situations represent a big or moderate problem in the neighbourhood: Noisy neighbours or loud parties 9** 14** 12 9** 15 12 People hanging around on the streets 8** 17** 12E 11 14 13 Garbage or litter lying around 6** 16 27** 13** 19 16 Vandalism, graffiti 11** 16 19** 14 16 15 People being attacked or harassed because of their ethnic origin or religion 5E 5E 6E 5E 6 6 People using or dealing drugs 14** 25* 26** 20 23 22 People being drunk or rowdy in public places 16** 32** 28 25 26 26 At least one of the above situations (total) 28** 46* 50** 37** 44 41 See notes at the end of the table.
  • 42. Statistics Canada—Catalogue no. 85-002-X42 Juristat Article—Criminal victimization in the territories, 2014 Table 10 — continued Perception of safety, crime and neighbourhood, by gender and territory, 2014 Perception of safety, crime and neighbourhood Yukon Northwest Territories Nunavut All territories Males Females Total† percent Trust people in the neighbourhood1 Cannot be trusted 9** 16* 15 10** 17 13 Can be somewhat trusted 28 29 31 31 28 29 Can be trusted 36** 32 26** 34 30 32 Can be trusted a lot 26 21** 26 24 24 24 No opinion/don't know/refusal 2E F F 2E 2E 2E Likelihood that neighbours call the police if witness what seems like criminal behaviour Very likely 65** 61** 40** 57 55 56 Somewhat likely 24** 27 35** 29 27 28 Somewhat unlikely or unlikely 9** 9** 19** 11 12 12 No opinion/don't know/refusal 3E 3E 5E** 2E** 5E 3 Sense of belonging to local community Very strong 27** 27** 45** 31 33 32 Somewhat strong 50 53** 39** 48 48 48 Somewhat weak or very weak 19* 16 12** 16 15 16 No opinion/don't know/refusal 4E 3E F 4E 3E 4E E use with caution F too unreliable to be published * significantly different from reference category (p < 0.1) **significantly different from reference category (p < 0.05) † reference category (except for gender comparisons, for which the reference category is “females”) 1. Respondents were asked to assess their trust level using a scale ranging from 1 (cannot be trusted at all) to 5 (can be trusted a lot). In this table, those who answered 1 or 2 are combined in "cannot be trusted". Source: Statistics Canada, General Social Survey, 2014.