Download to read offline


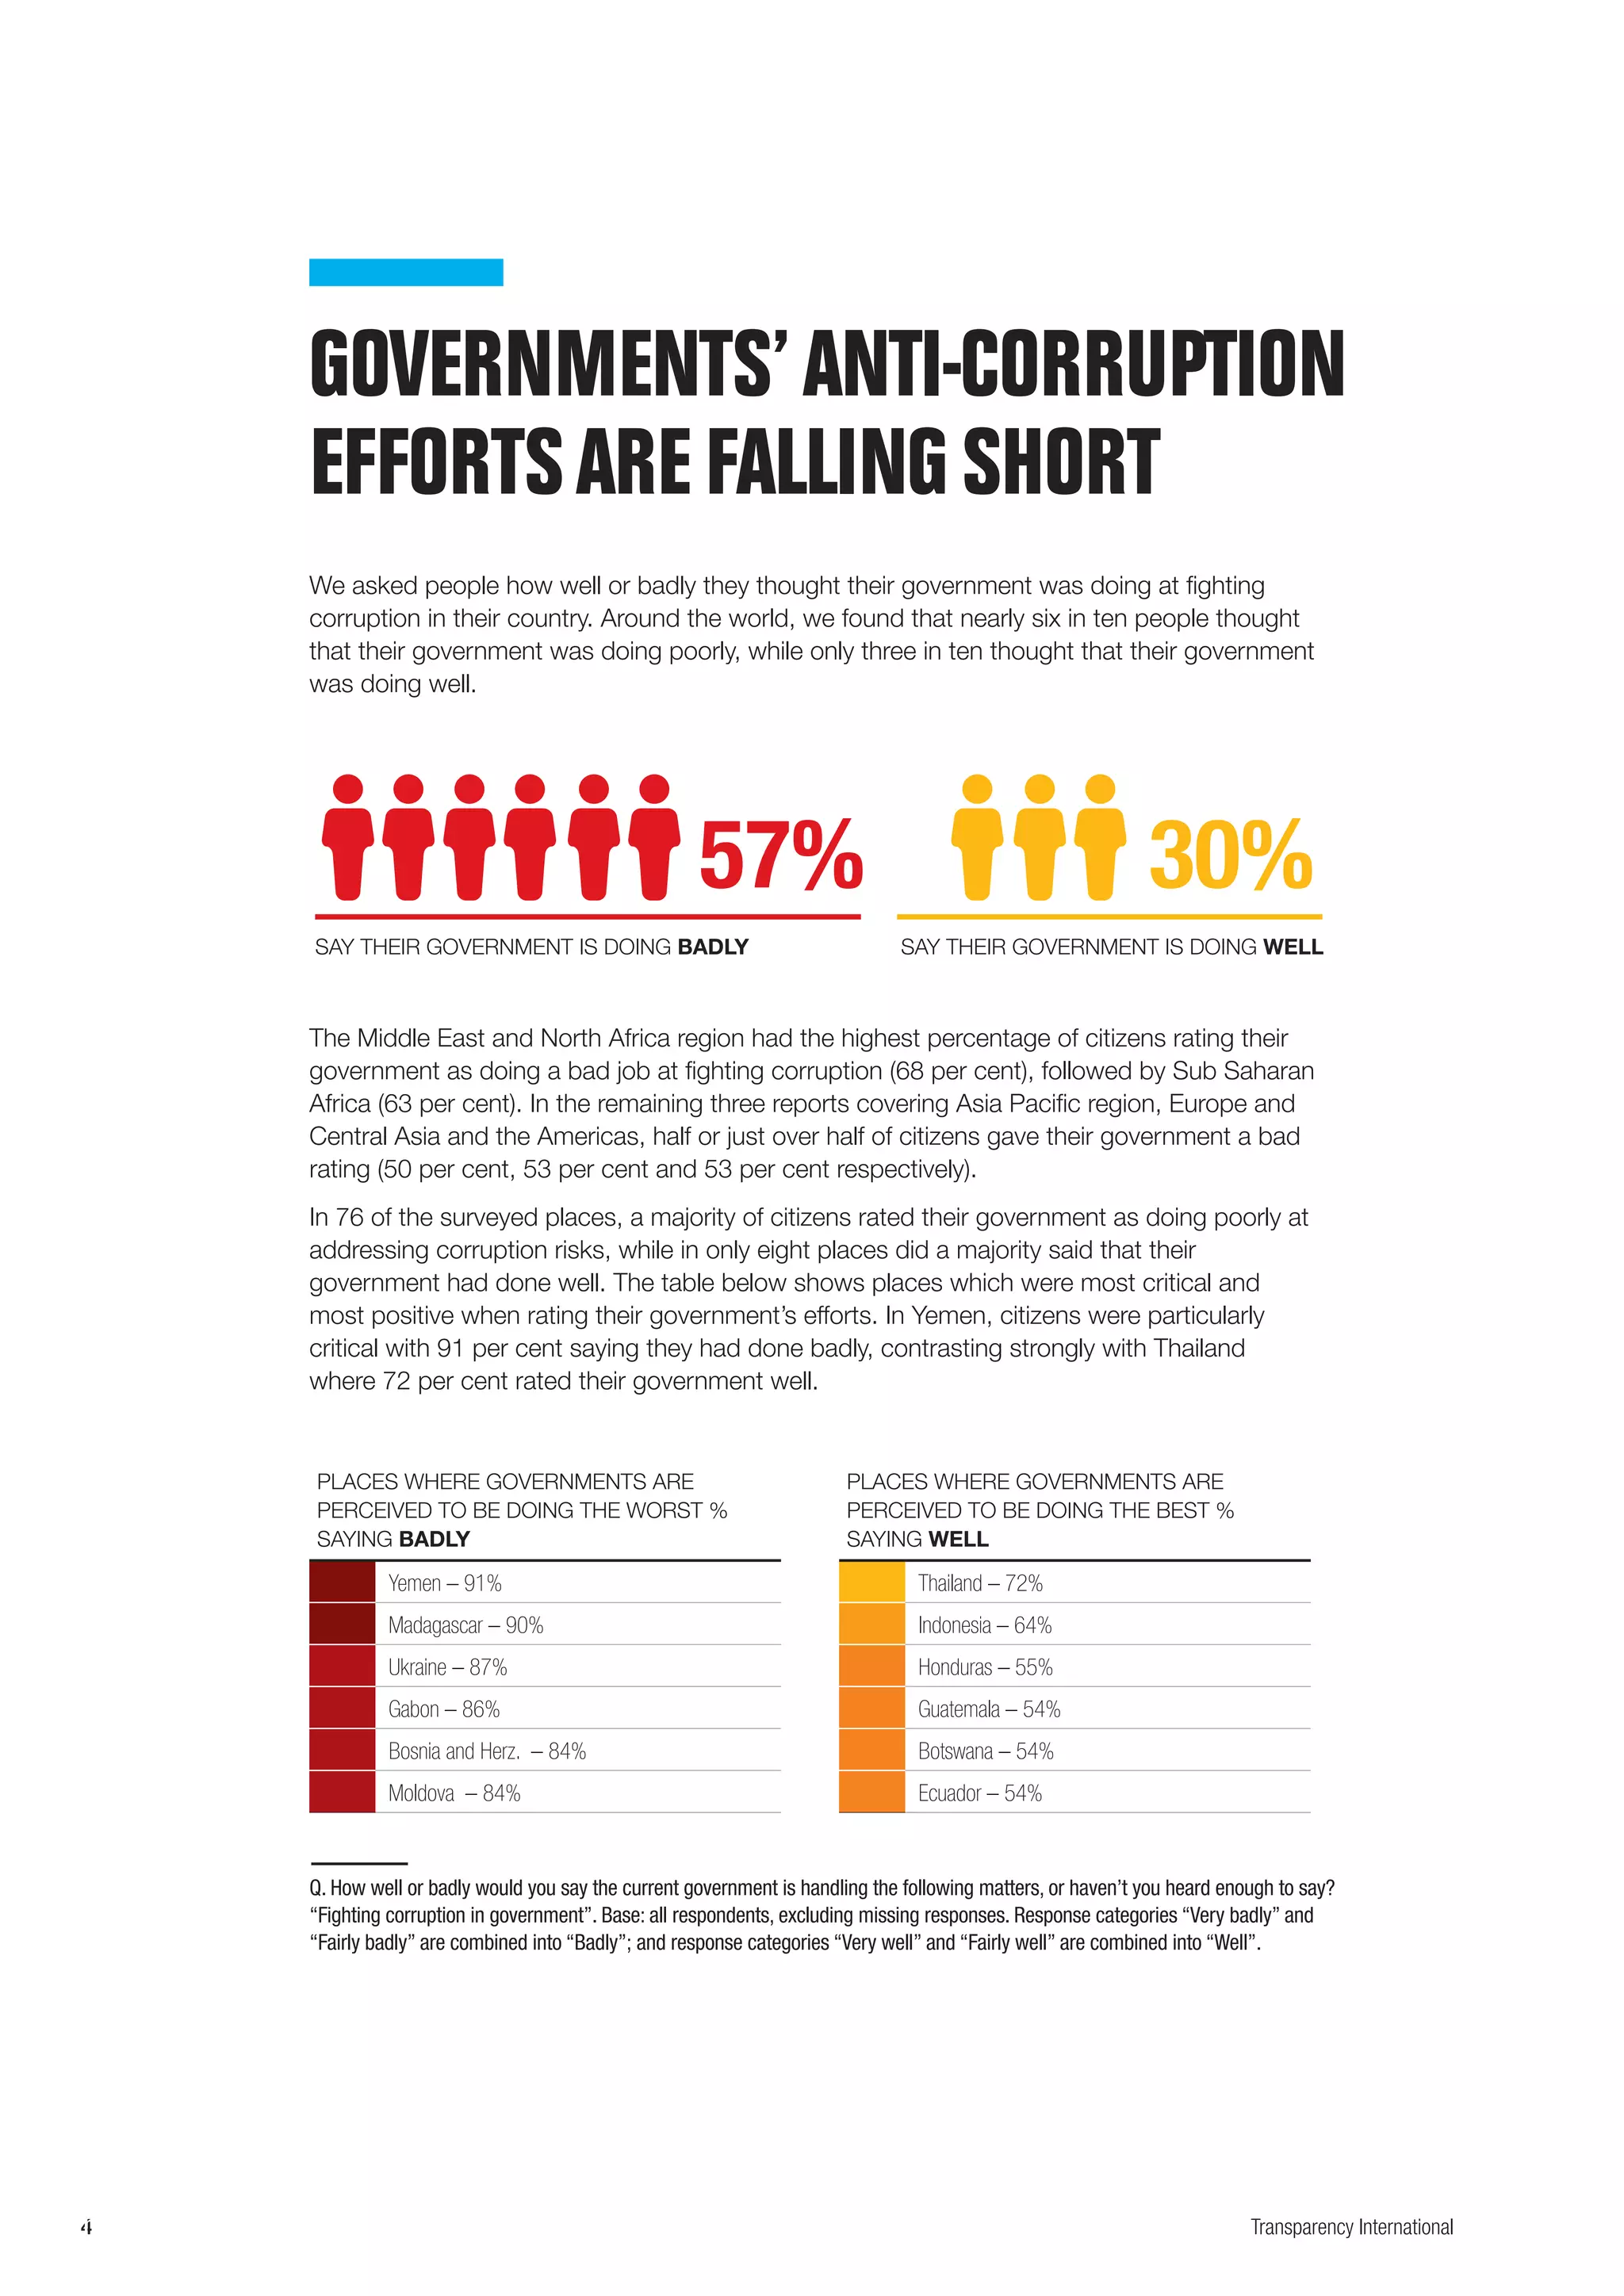


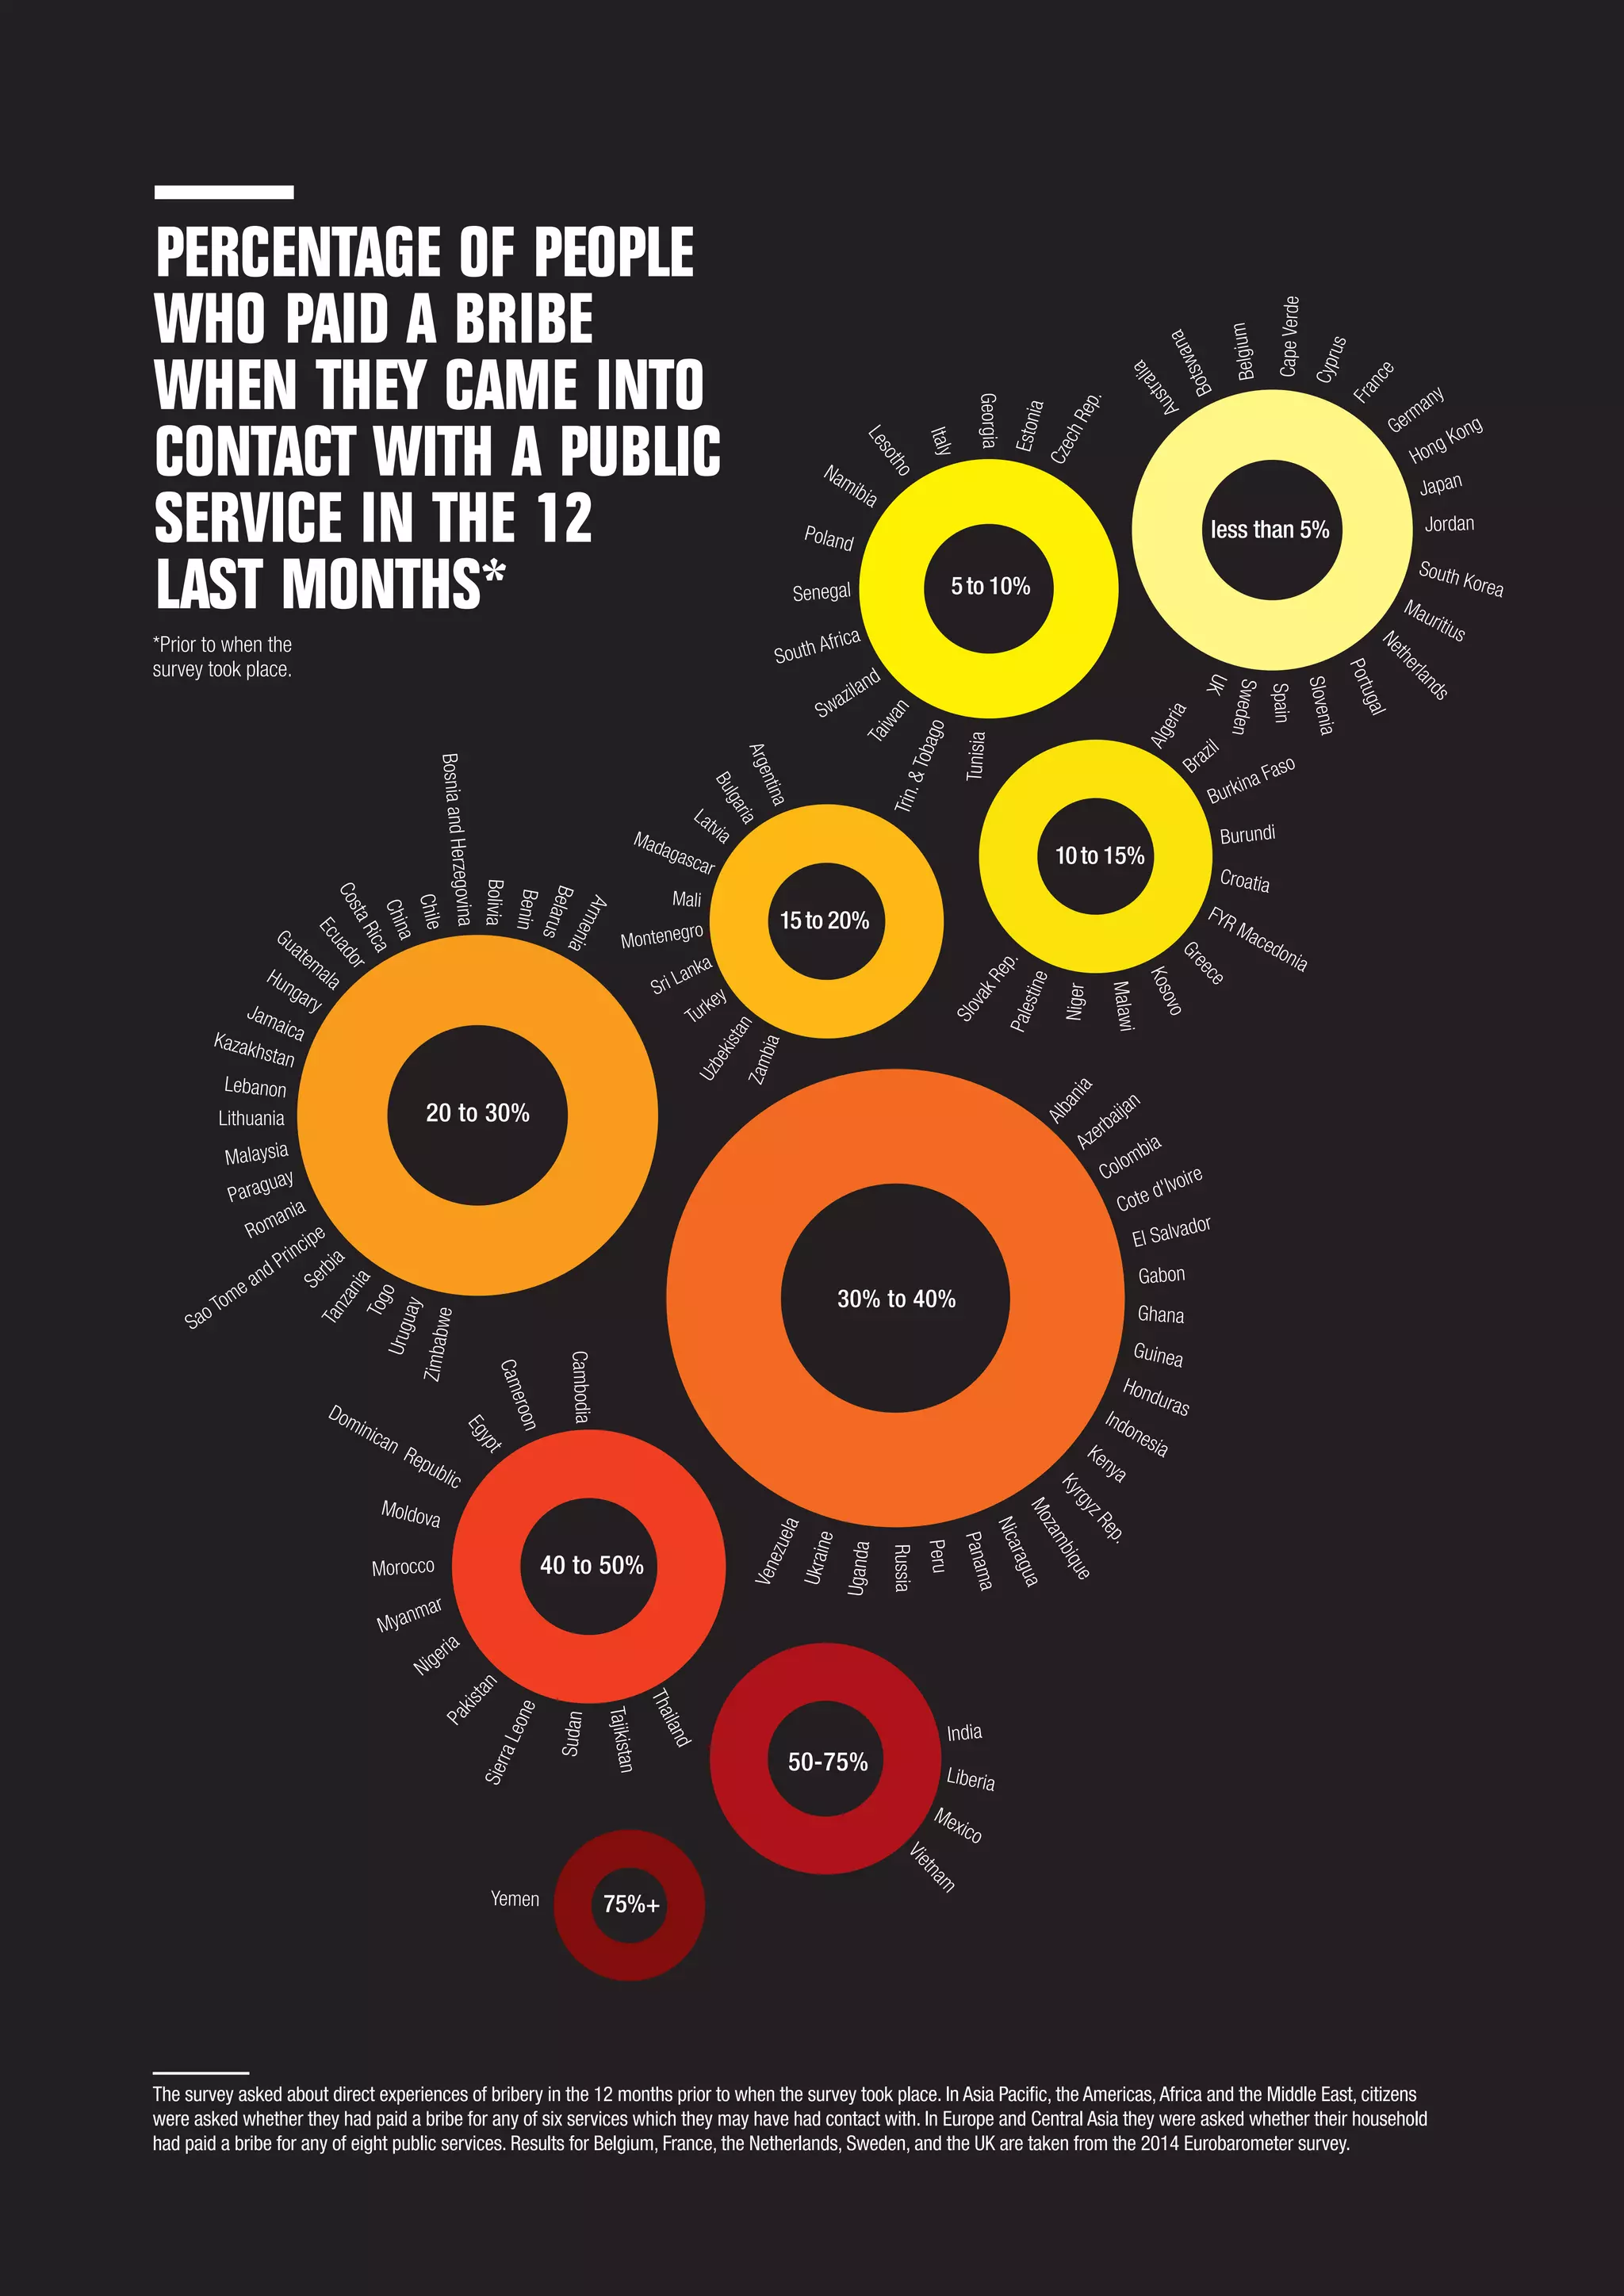


This document summarizes the key findings of the 9th edition of Transparency International's Global Corruption Barometer survey. Some of the main results include: - Nearly 6 in 10 people thought their government was doing a bad job fighting corruption. Police and elected representatives were seen as the most corrupt public institutions. - On average, 1 in 4 public service users had to pay a bribe in the past year. The average bribery rate was highest in the Middle East/North Africa and Commonwealth of Independent States. - Over half of respondents felt ordinary citizens can make a difference in fighting corruption, though views varied significantly by country.


