Download to read offline
![Ireland’s ISEQ Index increased 1.5 percent to
the highestlevelsince September2008.
Oct 7 2013
11:36:10
Market Specific
London Cash Buyers Send Banks North to
RiskierLoans:Mortgages
The risky loans that helped cause the U.K.’s
real-estate crash are making a comeback as
cash buyers from abroad limit lending
opportunities in London and banks instead
venture intothe weakestmarkets.
David Cameron’s government this week
introduces mortgage guarantees designed to
allow people to buy a home costing as much as
600,000 pounds
This article explains the
contribution to the market
price dropping. It is because
banks were continuing to
give out risky mortgages in
weak markets because of
the announcement from the
government. This has
especially affected the
Northregion.
Jul 02, 2013
03:14:52 AM
[NYT]
Firm Specific
GlaxoSmithKline IsInvestigatedinChina
The British pharmaceutical giant
GlaxoSmithKline said on Monday that the
authorities here were investigating whether
senior managers working for the company in
Chinawere involvedin"economiccrimes."
This could harm the
companies brand image as
well as turn out to be a
costly lawsuit if found guilty
of bribery. This could have a
dramaticon the share price.
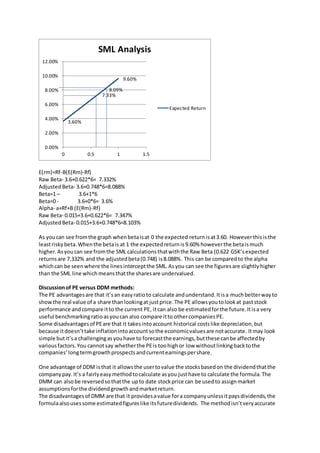
Valuation:
Multi-stage DDM
Firstyou mustworkout whatK equals-
K= Rf + B (E(Rm)-Rf)
K= 3.6 +0.622*6= 7.332% or 0.07332
Analyst Forecast
V0=
074
1+0.07332
+
0.78
(1+0.07332)2
+
0.82
(1+0.07332)3
+
0.82(1+0.07369)
(0.07332−0.07369) 𝑥(1+0.07332)^3 =204.8904
Economic Model Forecast V0=
0.74
1+0.07332
+
0.78
(1+0.07332)2
+
0.82
(1+0.07332)3
+
0.82(1+0.043)
(0.07332−0.043) 𝑥(1+0.07332)^3 = 24.84264
DDM ROE Forecast
V0=
0.74
1+0.07332
+
0.78
(1+0.07332)2
+
0.82
(1+0.07332)3
+
0.82(1+0.16901)
(0.07332−0.16901) 𝑥(1+0.07332)^3 = -6.07204
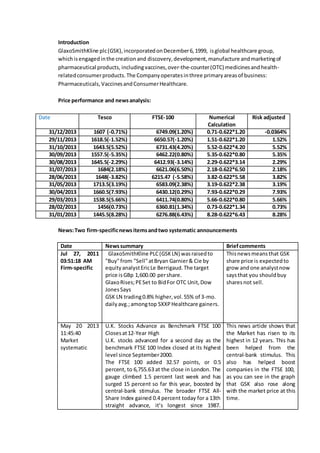
The Vo that I woulduse isthe EconomicModel forecastthisisbecause mygrowthrate was higher
than myK for the ROE forecastand analystforecast.Iincludedthe raw betawhencalculatingthe
DDM. The smallestvariationtothe marketprice wasthe EconomicModel forecast,whichcame out
the closest.The othershada muchlarger variationone beingaminusfigure,the other wasmuch
higher.Thisisbecause the growthrateswere muchgreaterthan K and because of thisyoushouldn’t
use theirDDM.
You alsoneedtodiscuss howyou arrive at the estimate of LT growthrate of dividends(e.g.,from
analysts’forecast,ROE*bor macro-economicbasedmodel).If there islarge deviationbetweenV0](https://image.slidesharecdn.com/gsk-160309044624/85/Gsk-3-320.jpg)

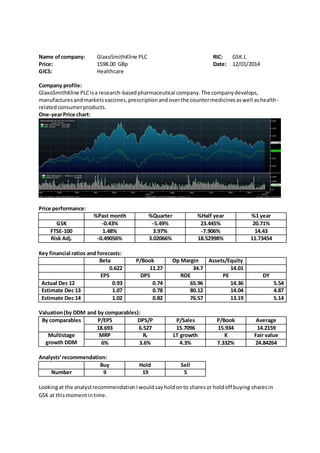
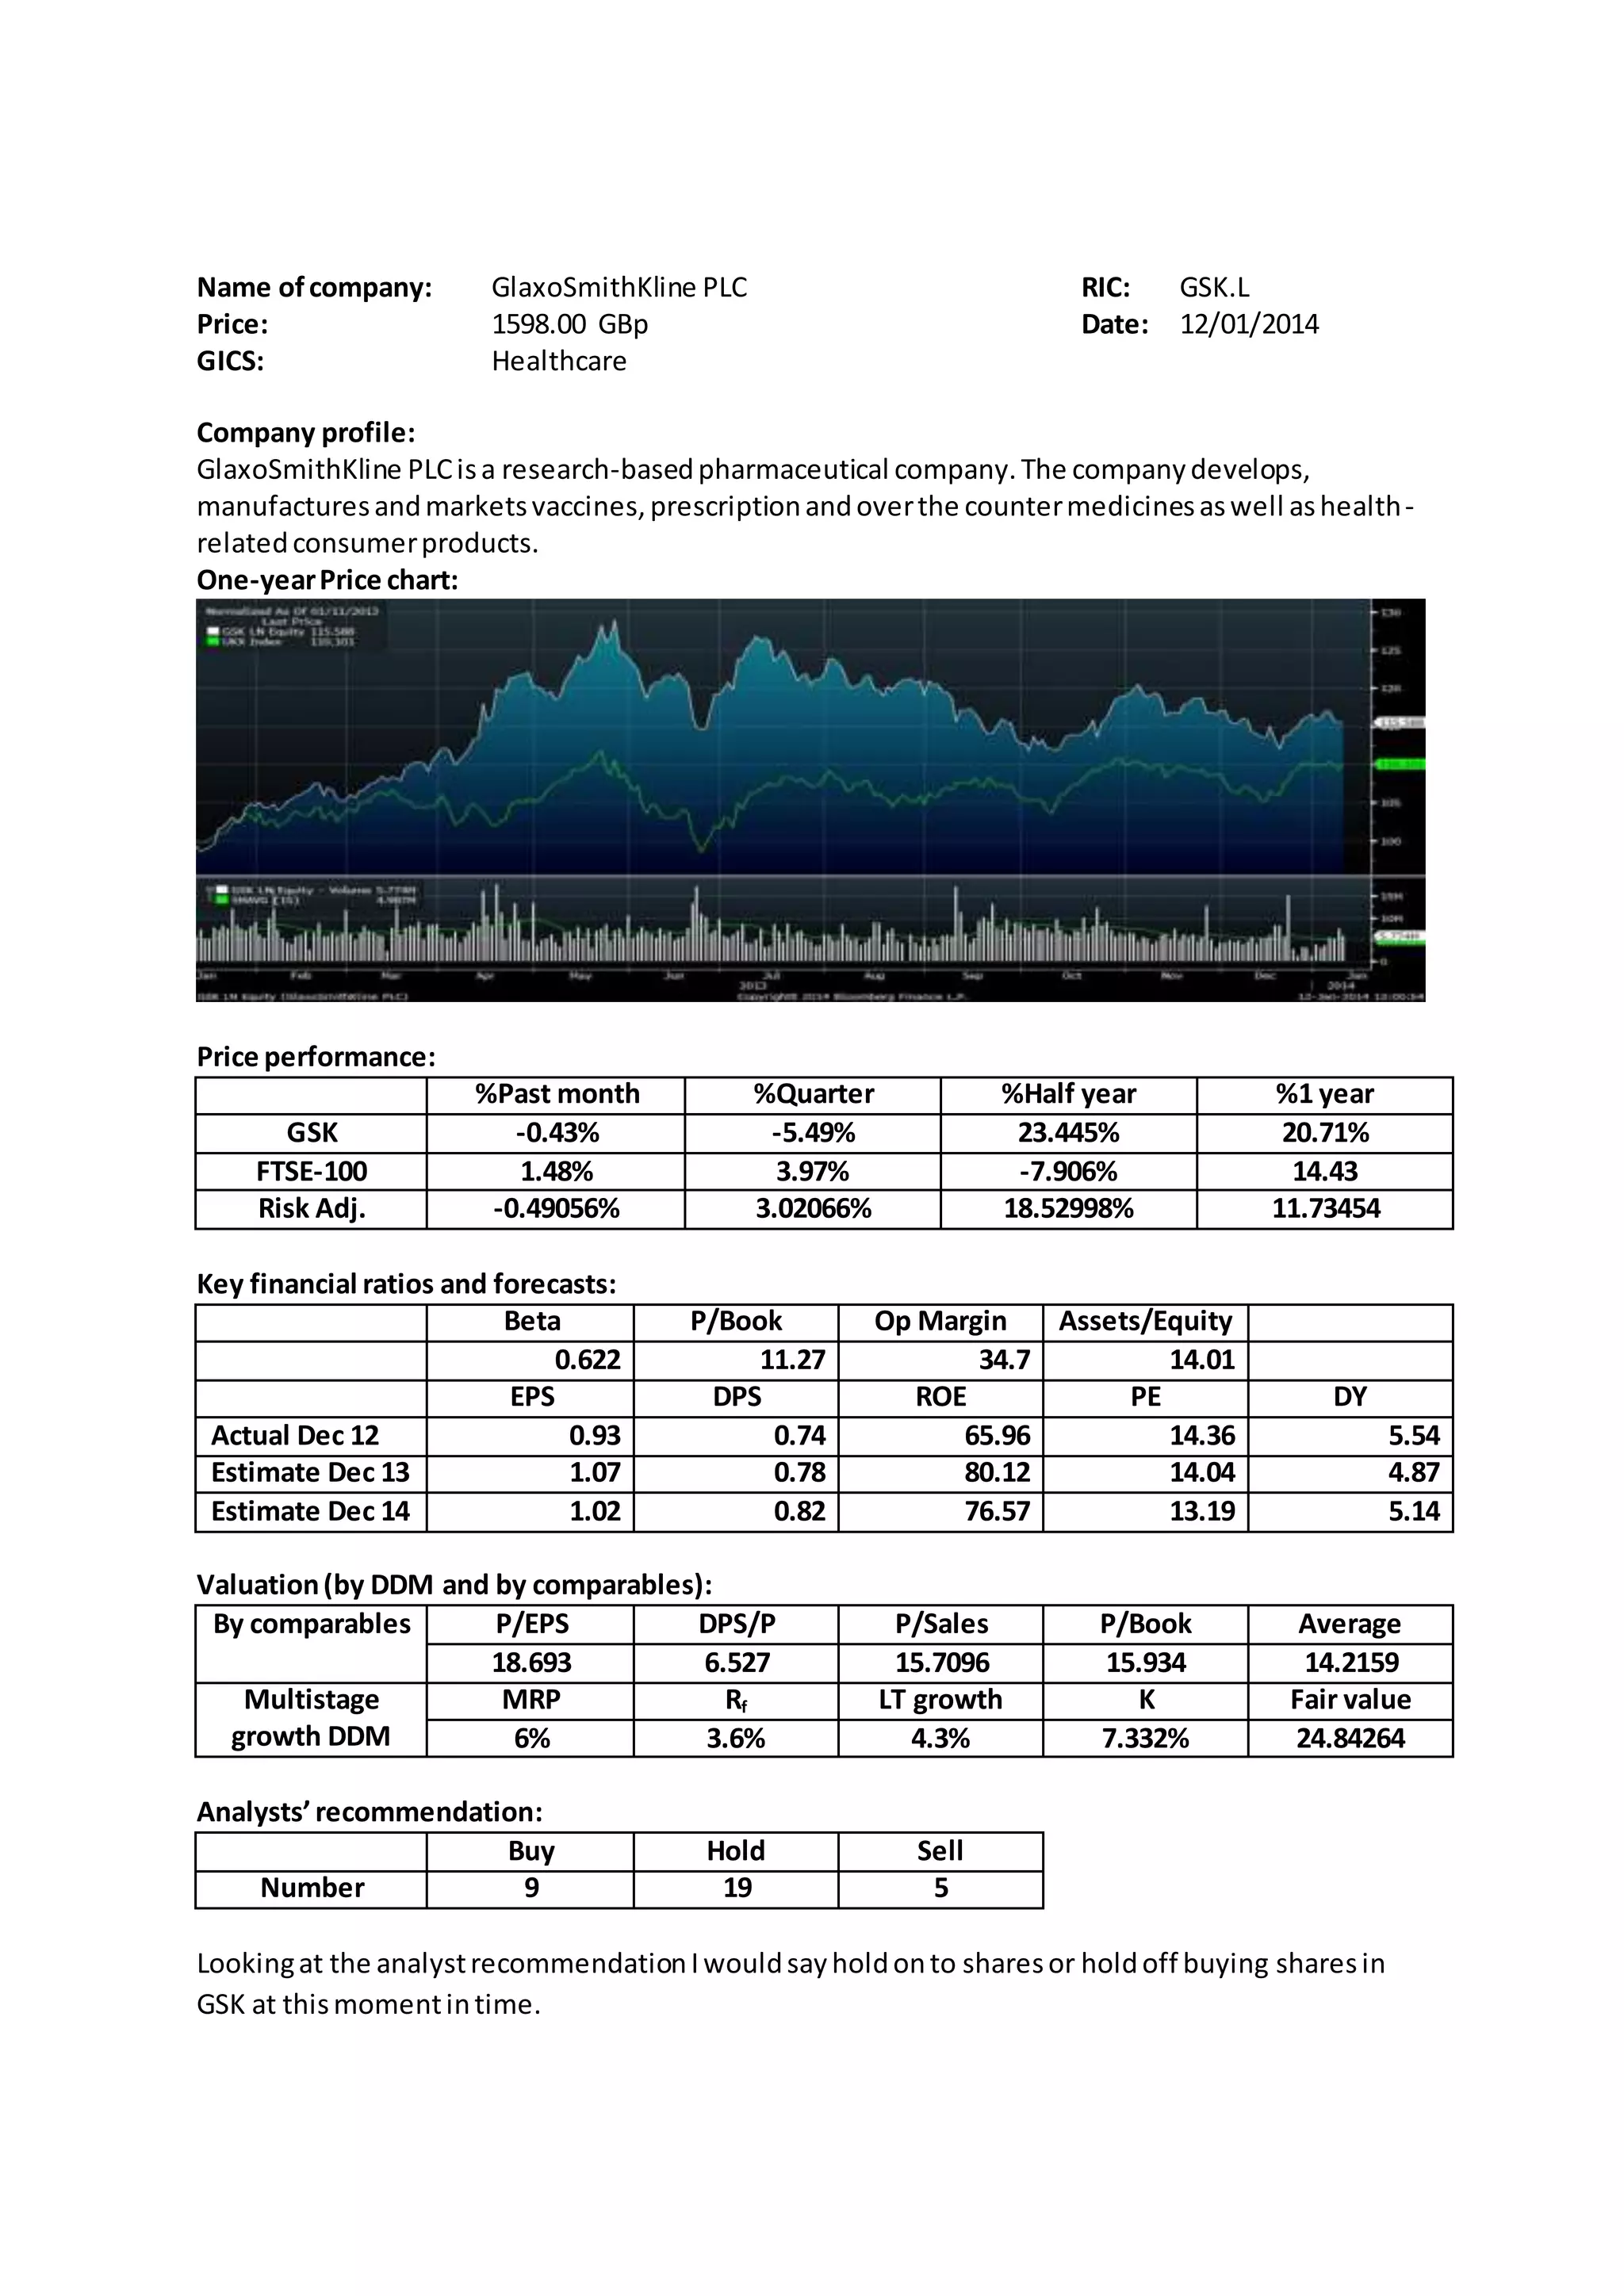
GlaxoSmithKline plc is a global healthcare company that develops, manufactures, and markets pharmaceuticals and consumer healthcare products. The document provides an overview of GSK, including its business operations, financial performance over time, analyst recommendations and valuations using different methods. The discounted dividend model valuation of £24.84 per share is considered the most appropriate given the growth rates used are lower than the cost of capital rate and closest to the current market price.


![JPM Global Dividend A (acc) - EUR[LU_EN][2_5_2016]_AFTER](https://cdn.slidesharecdn.com/ss_thumbnails/58294d8b-4b61-4668-b3ee-3a4b5dee035f-161026144811-thumbnail.jpg?width=640&height=640&fit=bounds)


