4
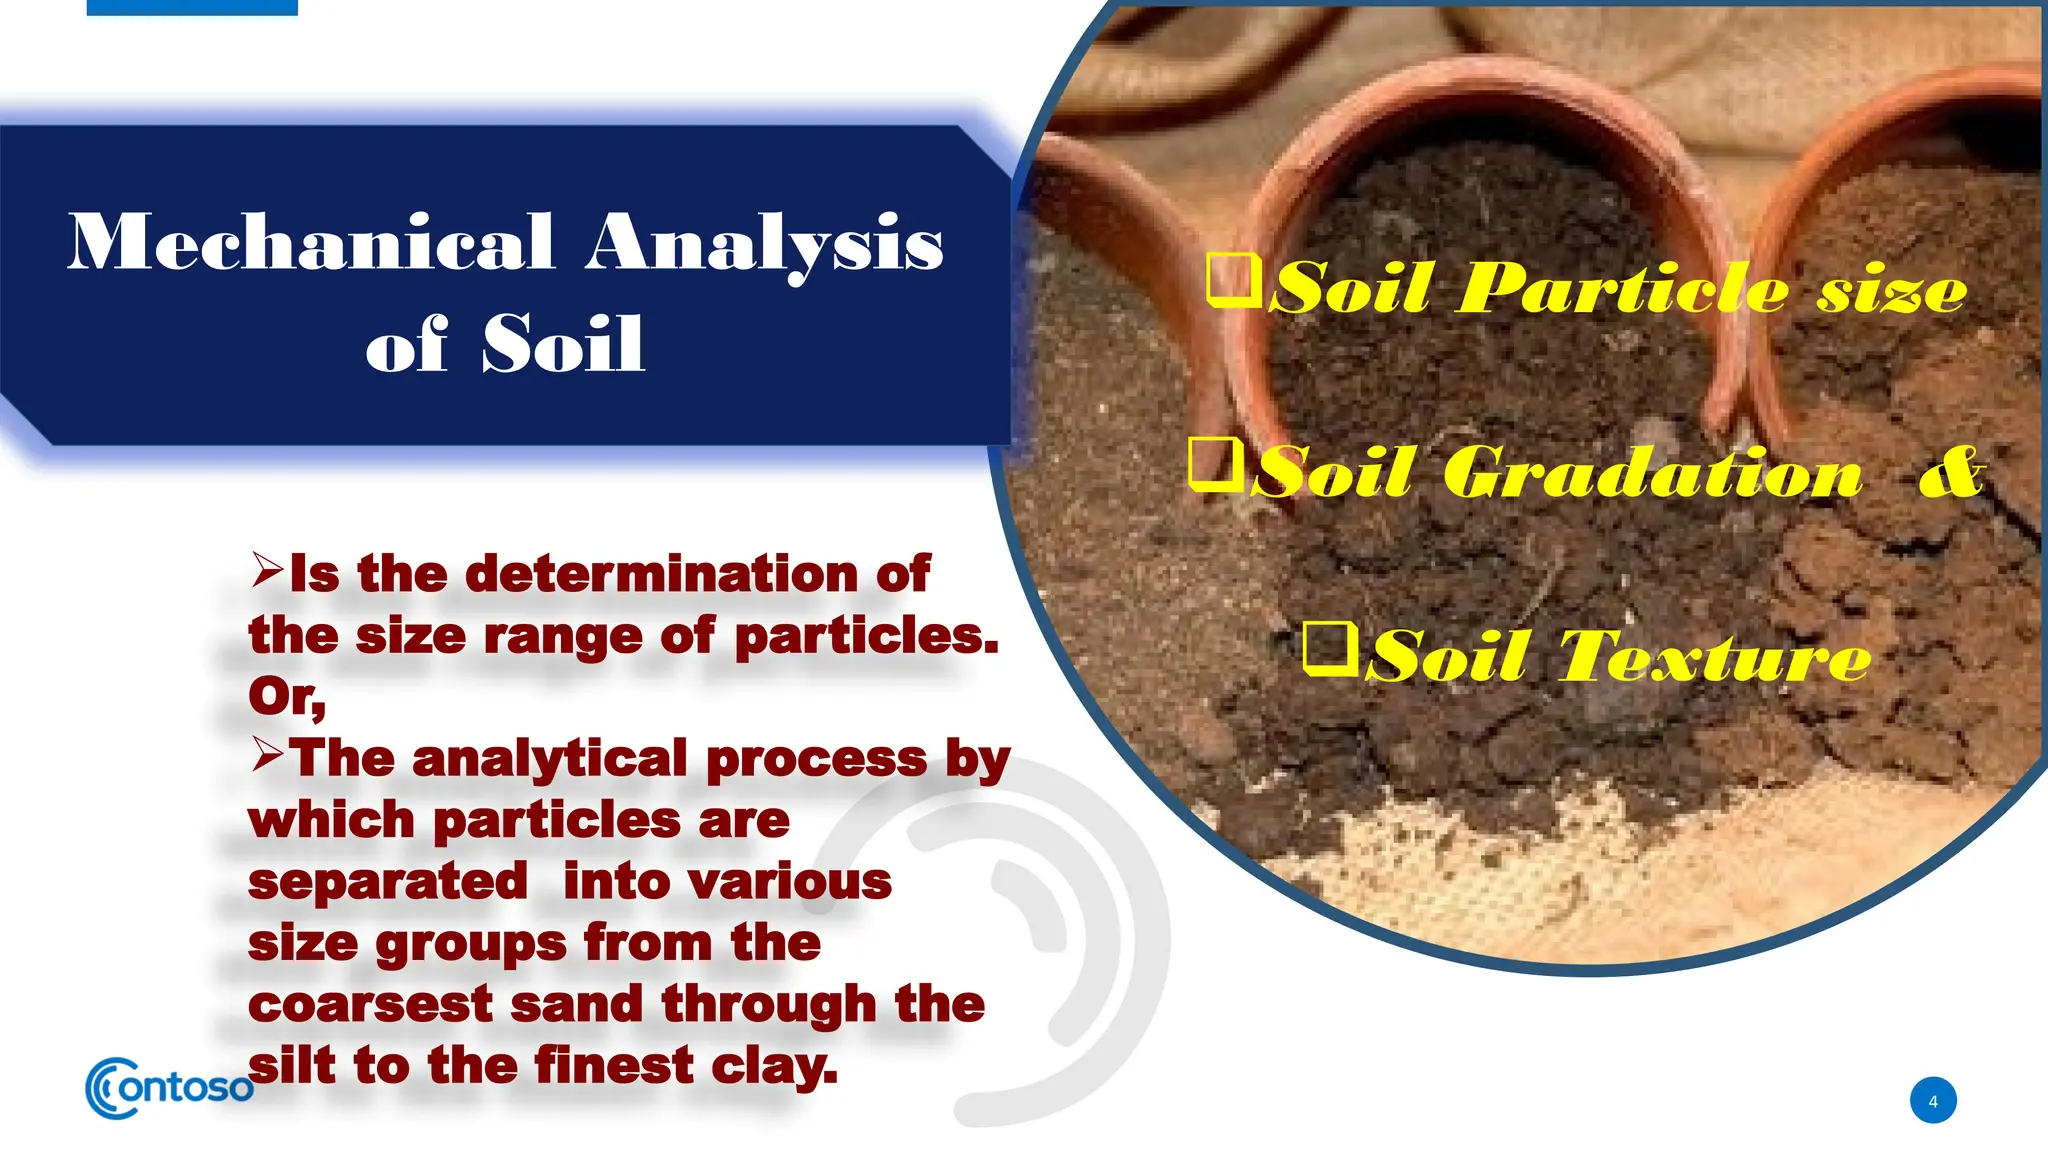
Mechanical Analysis
of Soil
Isthe determination of
the size range of particles.
Or,
The analytical process by
which particles are
separated into various
size groups from the
coarsest sand through the
silt to the finest clay.
Soil Particle size
Soil Gradation &
Soil Texture
5.
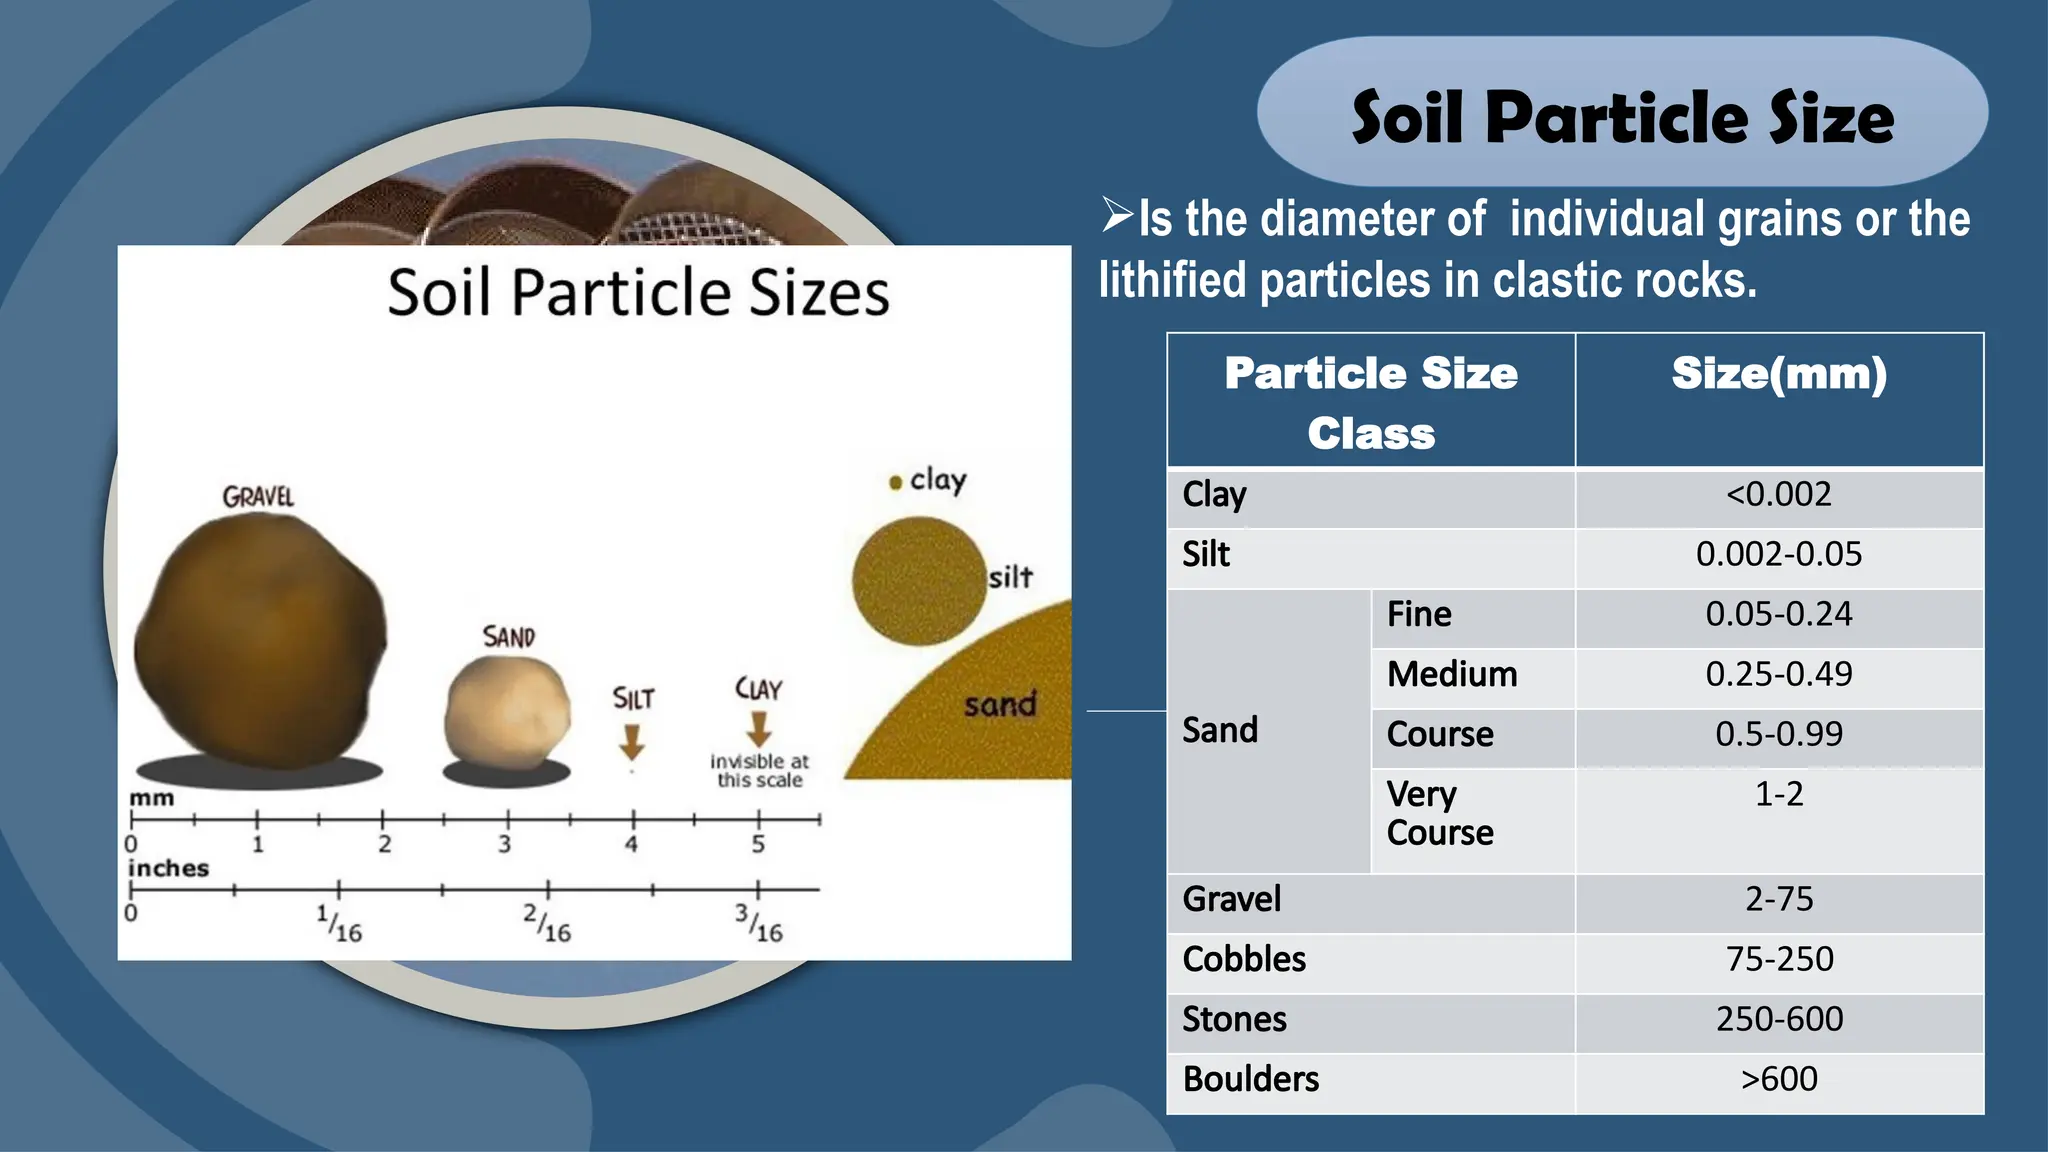
Particle Size
Class
Size(mm)
Clay <0.002
Silt0.002-0.05
Sand
Fine 0.05-0.24
Medium 0.25-0.49
Course 0.5-0.99
Very
Course
1-2
Gravel 2-75
Cobbles 75-250
Stones 250-600
Boulders >600
Soil Particle Size
Is the diameter of individual grains or the
lithified particles in clastic rocks.
6.
6
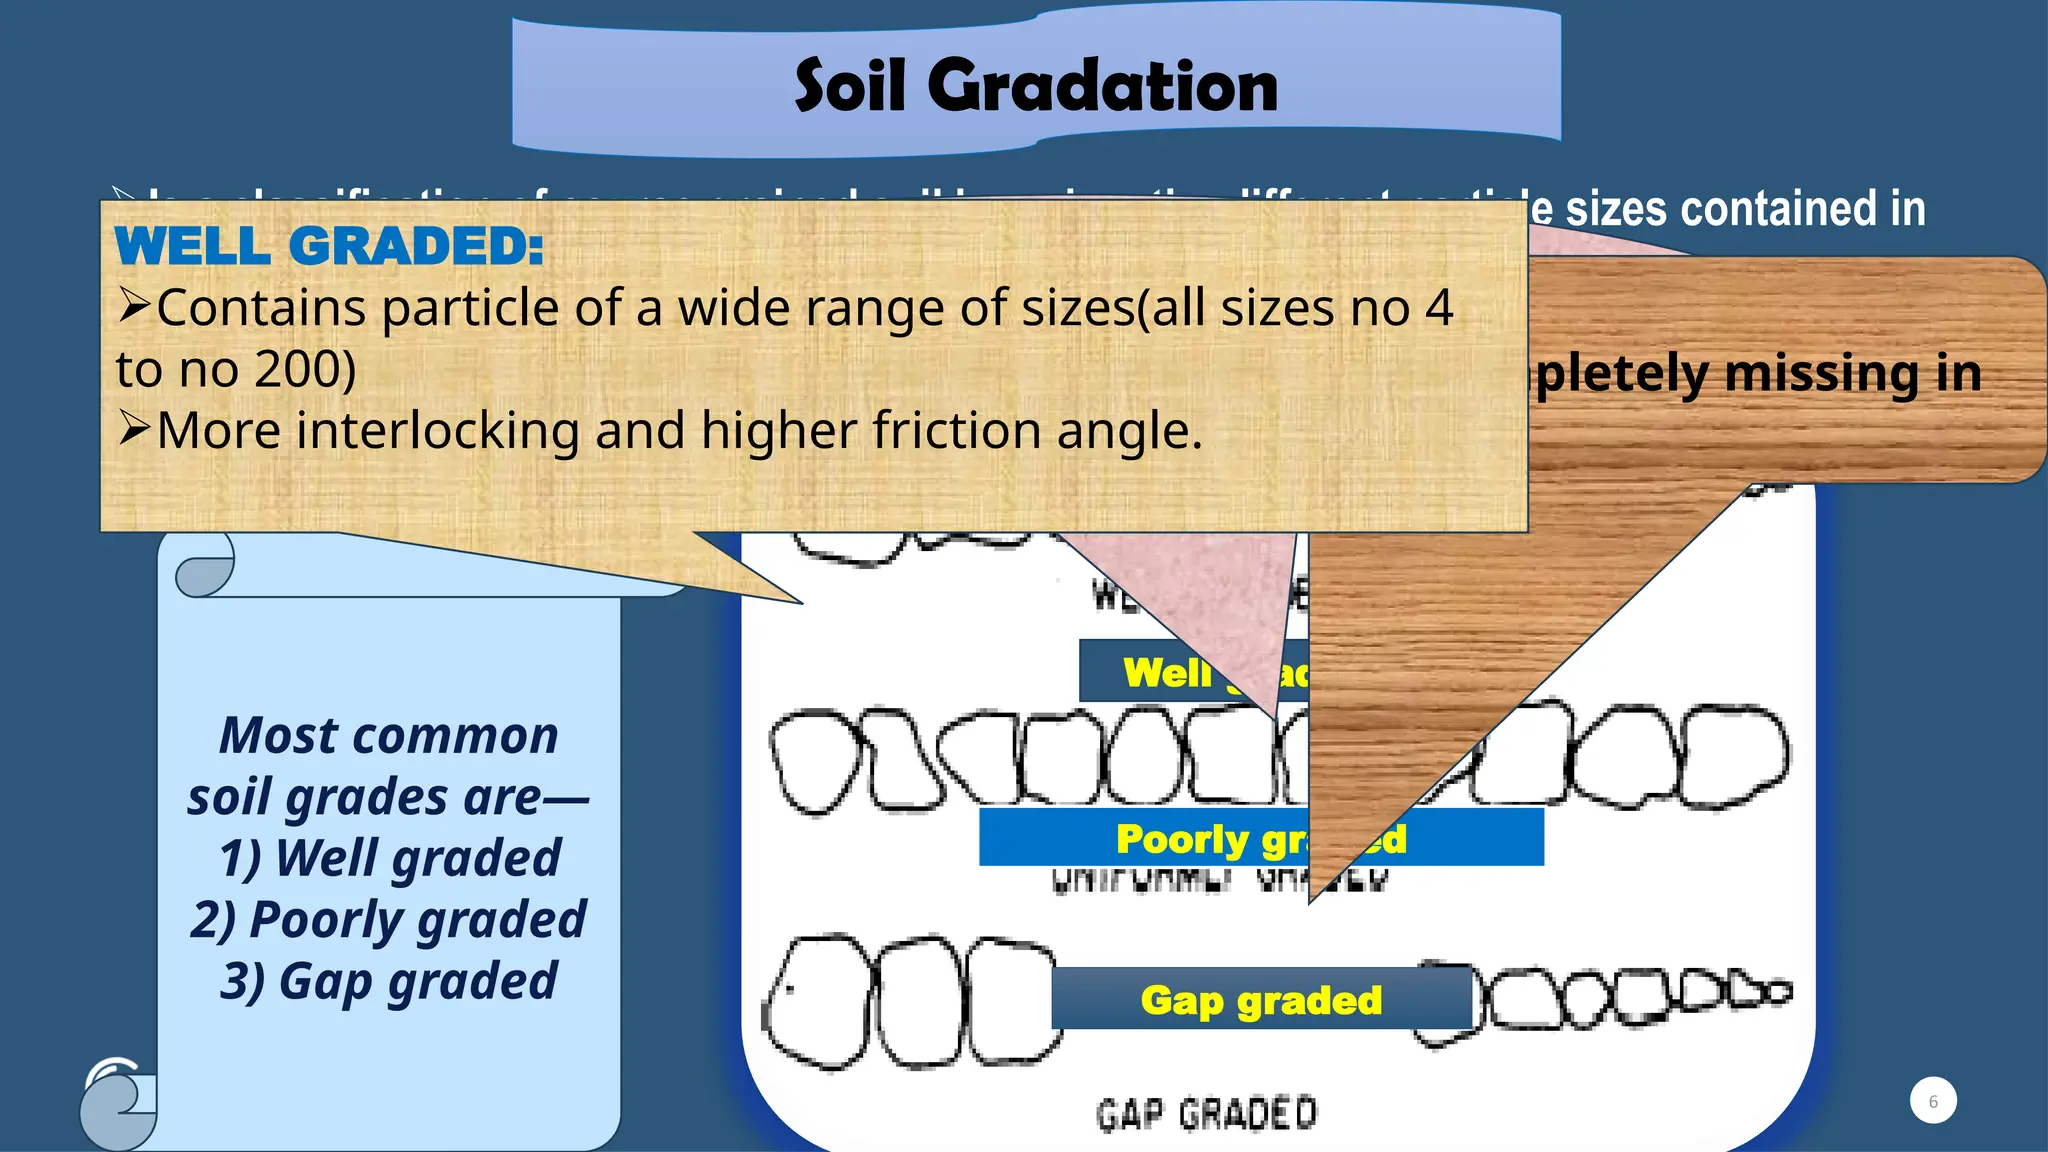
Is a classificationof course grained soil based on the different particle sizes contained in
the soil
Is a indicator of engineering properties such as—compressibility, shear strength and
hydraulic conductivity.
Most common
soil grades are—
1) Well graded
2) Poorly graded
3) Gap graded
Soil Gradation
Well graded
Poorly graded
Gap graded
POORLY GRADED:
Most of the particles are approximately
of the same size.
Permeability is more than well graded
soil.
GAP GRADED:
Not all particle size is present as some are completely missing in
them.
WELL GRADED:
Contains particle of a wide range of sizes(all sizes no 4
to no 200)
More interlocking and higher friction angle.
7.
7
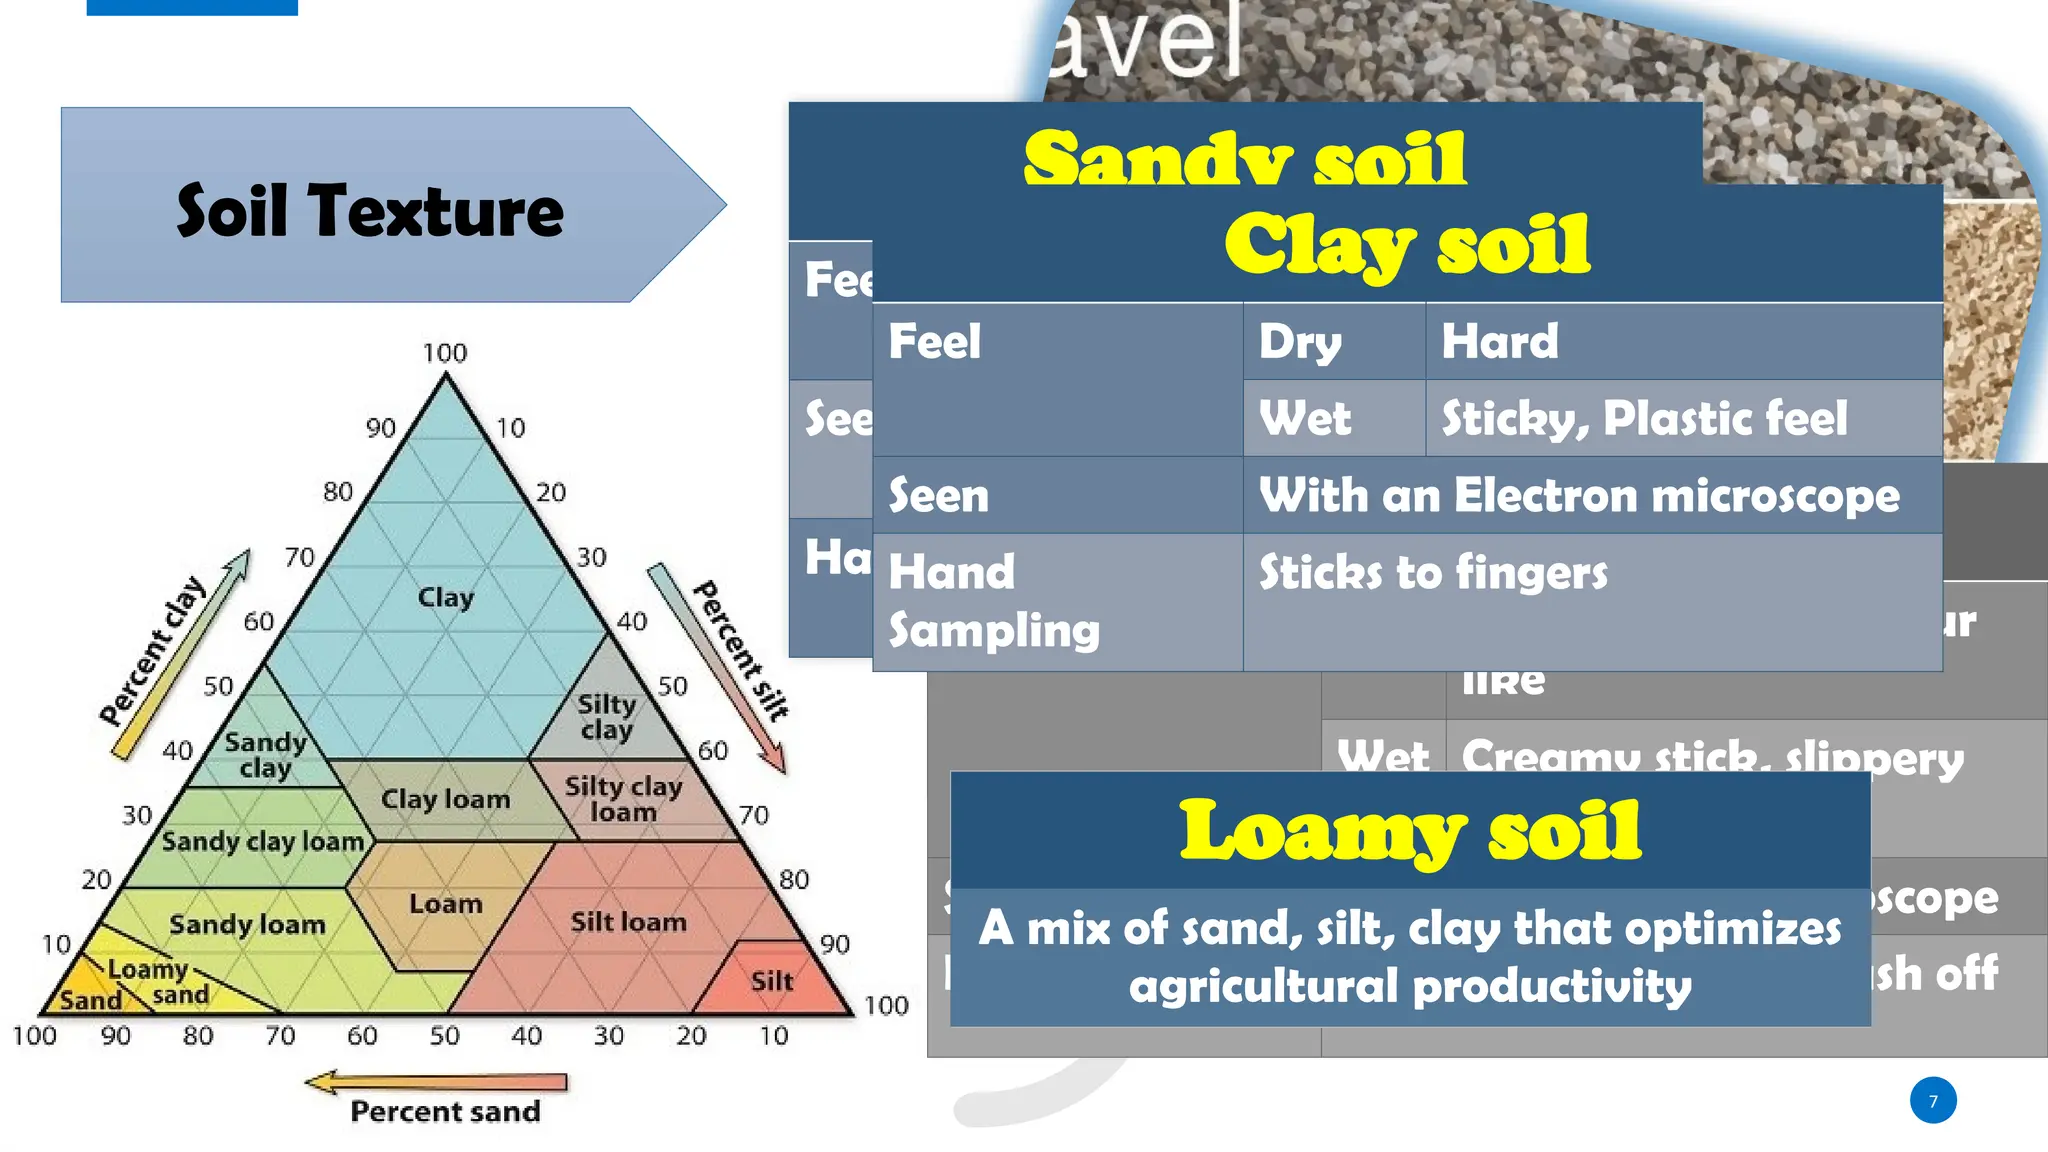
Soil Texture
refers tothe composition of
the soil in terms of the amounts
of small (clays), medium (silts),
and large (sands) size particles.
According to USDA, there are 12
textural classes of soil; but the
most common are—
I. Sandy soil,
II. Silty soil,
III.Clay soil &
IV. Loamy soil.
Sandy soil
Feel Gritty
Seen Can be seen with
naked eye
Hand Sampling No residue rest on
hand
Silty soil
Feel Dry Powdery smooth, flour
like
Wet Creamy stick, slippery
feel
Seen With hand lens or microscope
Hand Sampling Coats hand, able to Brush off
Clay soil
Feel Dry Hard
Wet Sticky, Plastic feel
Seen With an Electron microscope
Hand
Sampling
Sticks to fingers
Loamy soil
A mix of sand, silt, clay that optimizes
agricultural productivity
8.
8
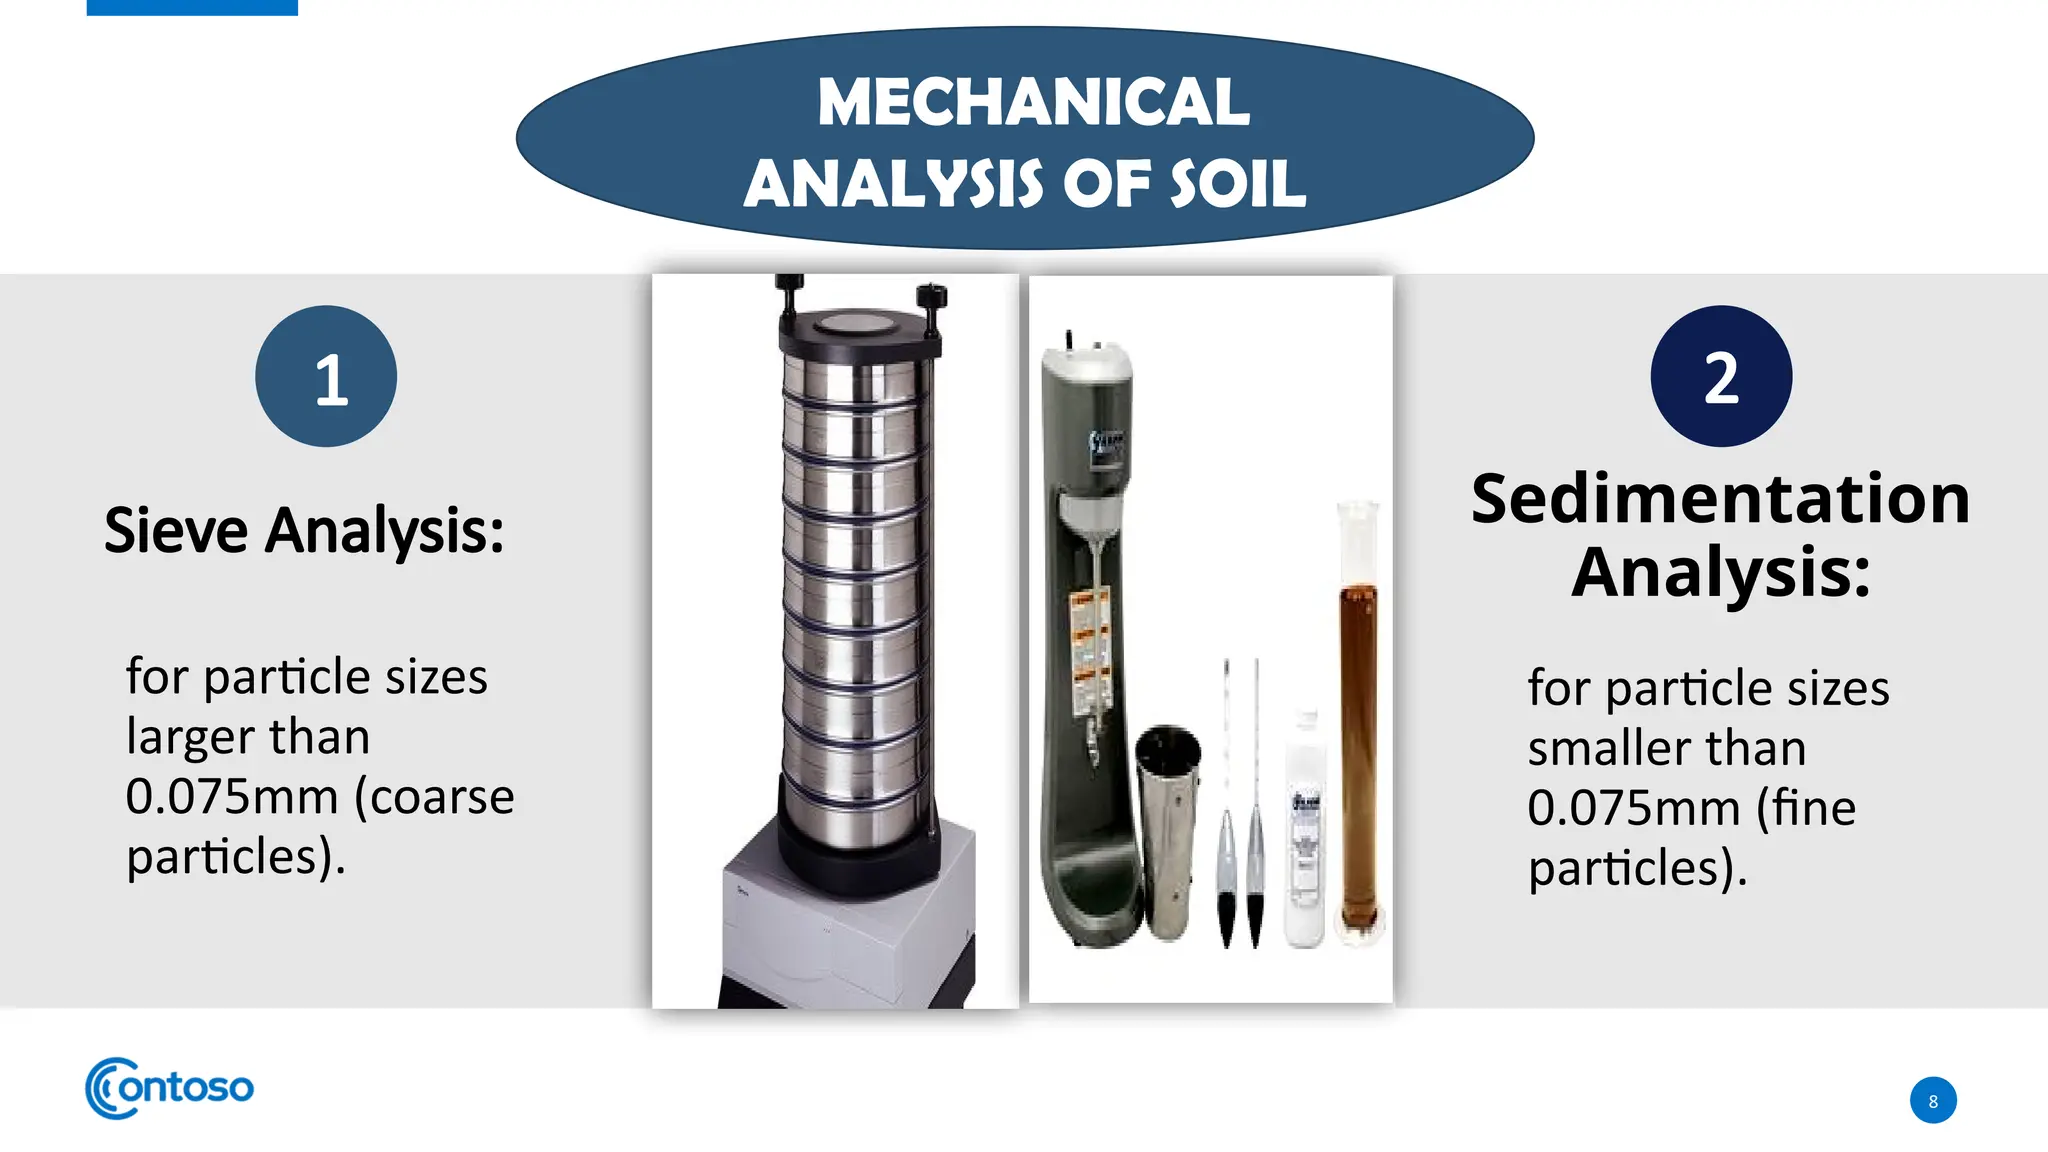
for particle sizes
largerthan
0.075mm (coarse
particles).
Sedimentation
Analysis:
for particle sizes
smaller than
0.075mm (fine
particles).
MECHANICAL
ANALYSIS OF SOIL
Sieve Analysis:
1 2
9.
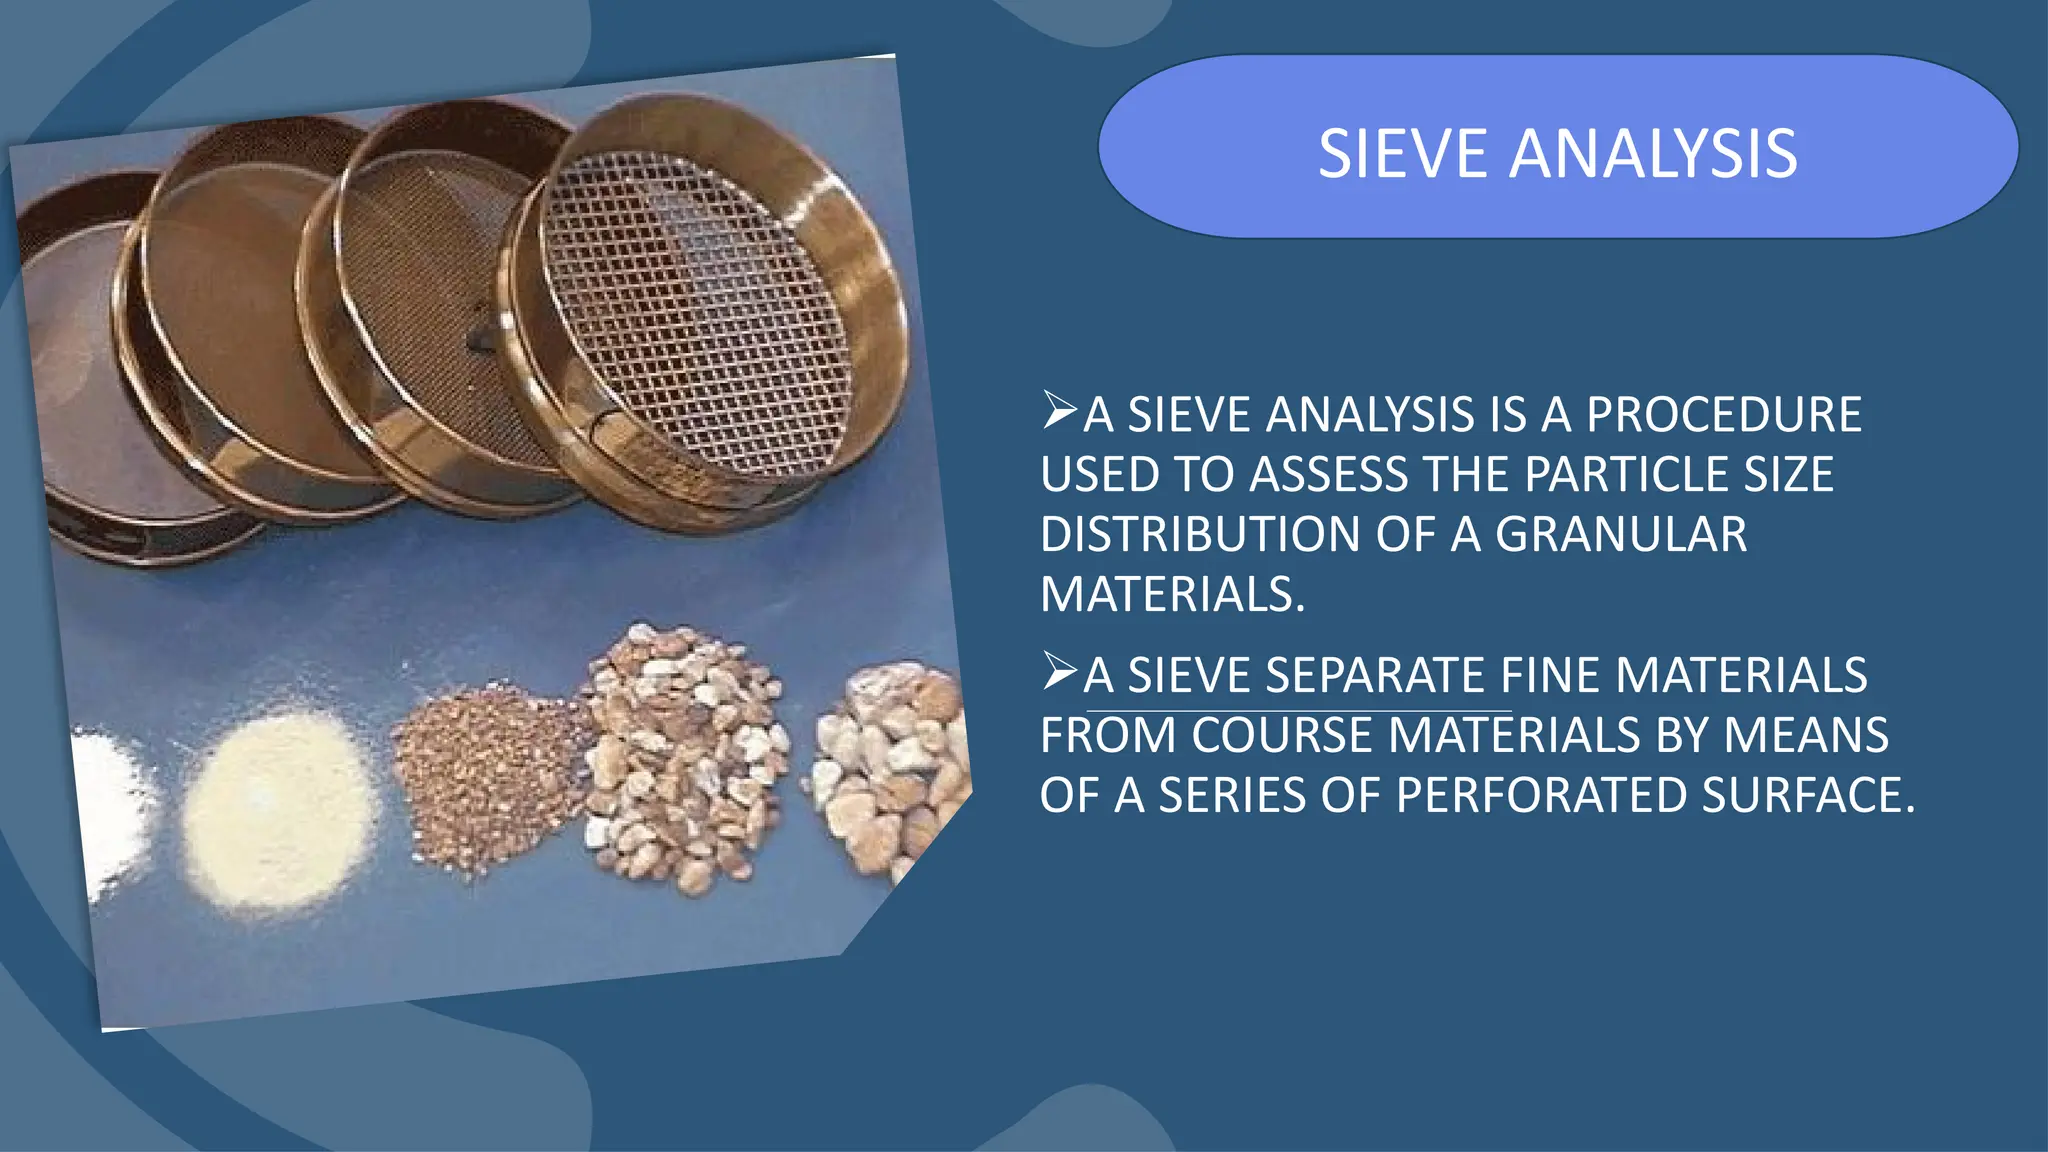
A SIEVE ANALYSISIS A PROCEDURE
USED TO ASSESS THE PARTICLE SIZE
DISTRIBUTION OF A GRANULAR
MATERIALS.
A SIEVE SEPARATE FINE MATERIALS
FROM COURSE MATERIALS BY MEANS
OF A SERIES OF PERFORATED SURFACE.
SIEVE ANALYSIS
10.
10
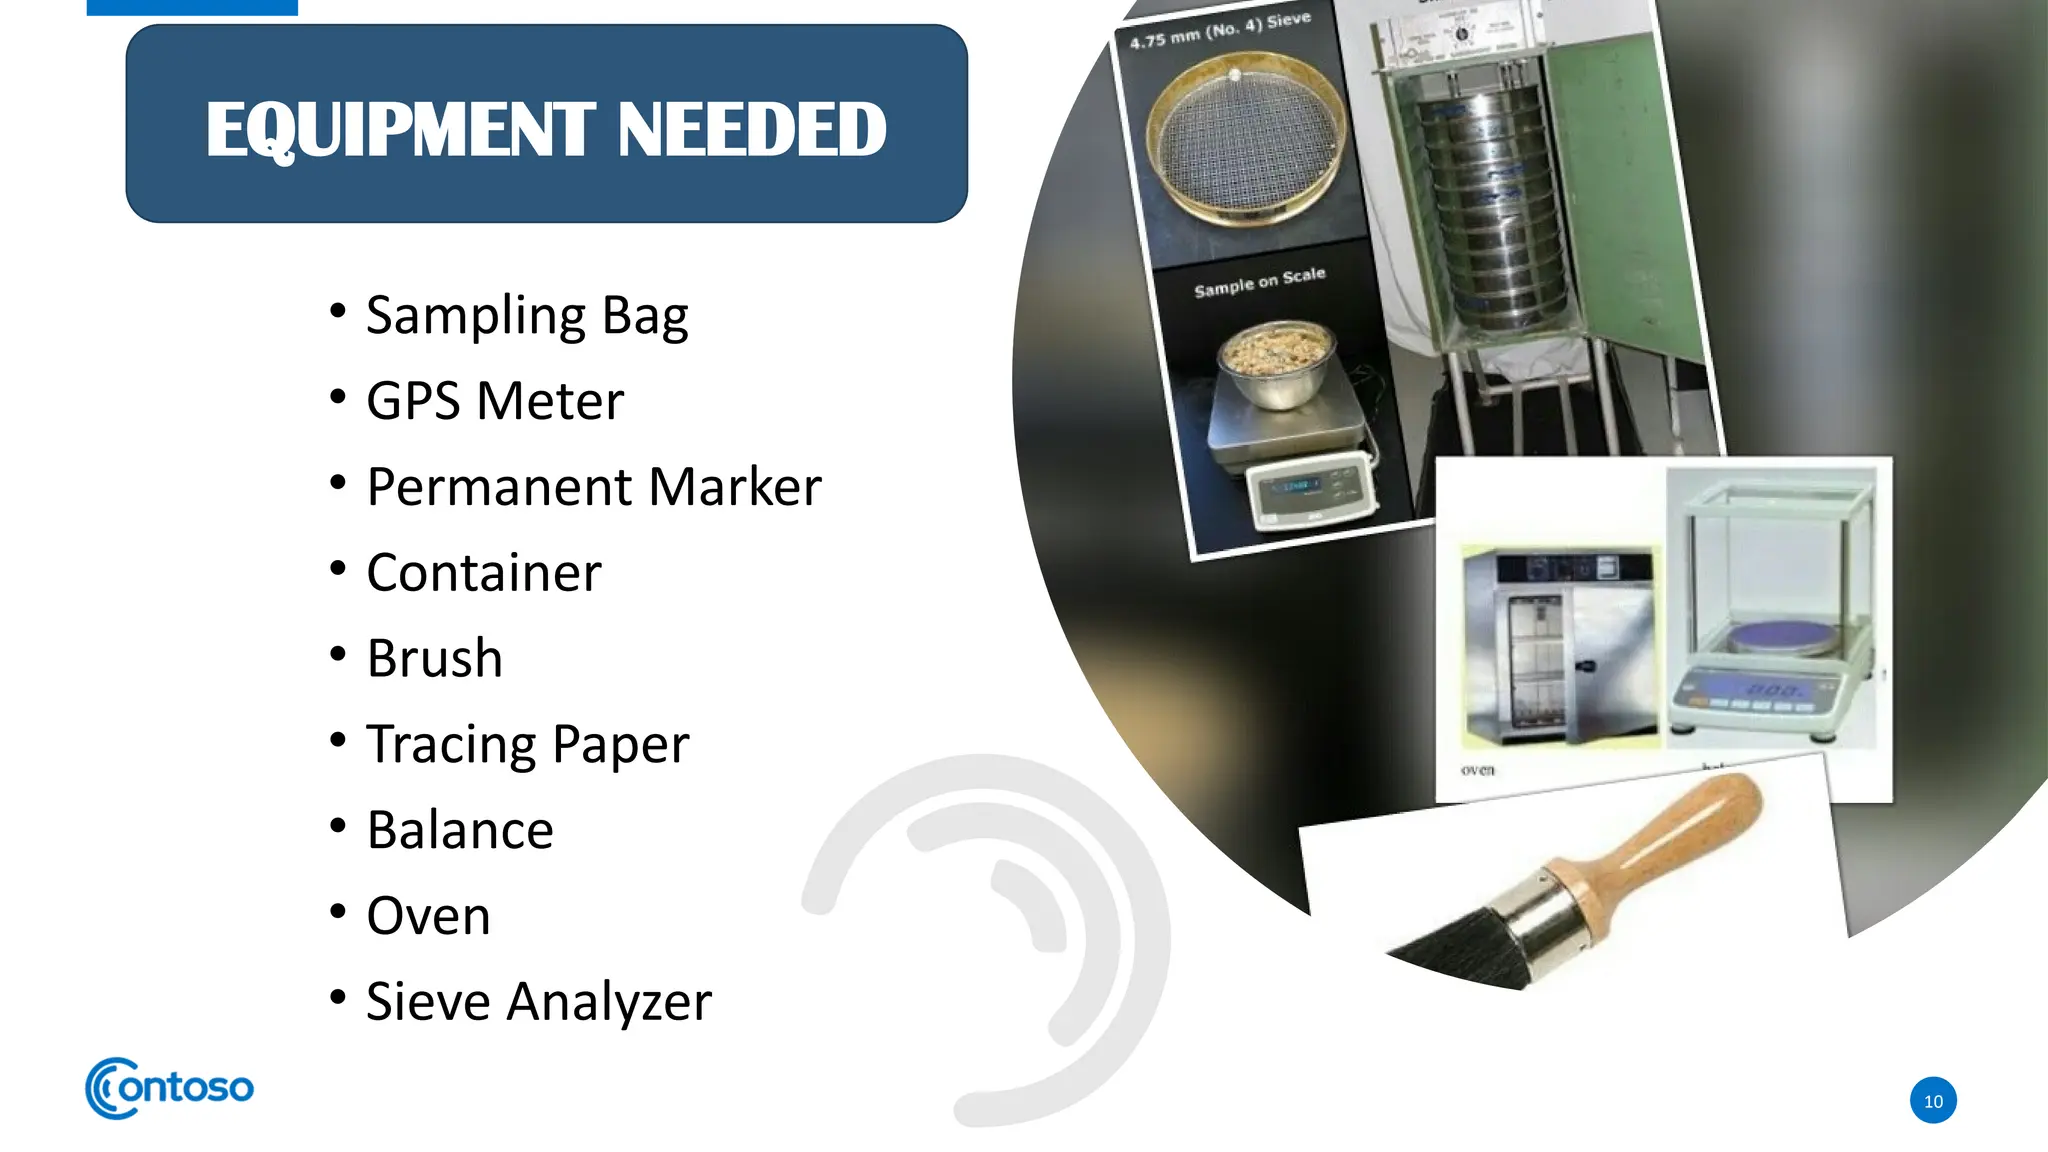
• Sampling Bag
•GPS Meter
• Permanent Marker
• Container
• Brush
• Tracing Paper
• Balance
• Oven
• Sieve Analyzer
EQUIPMENT NEEDED
11.
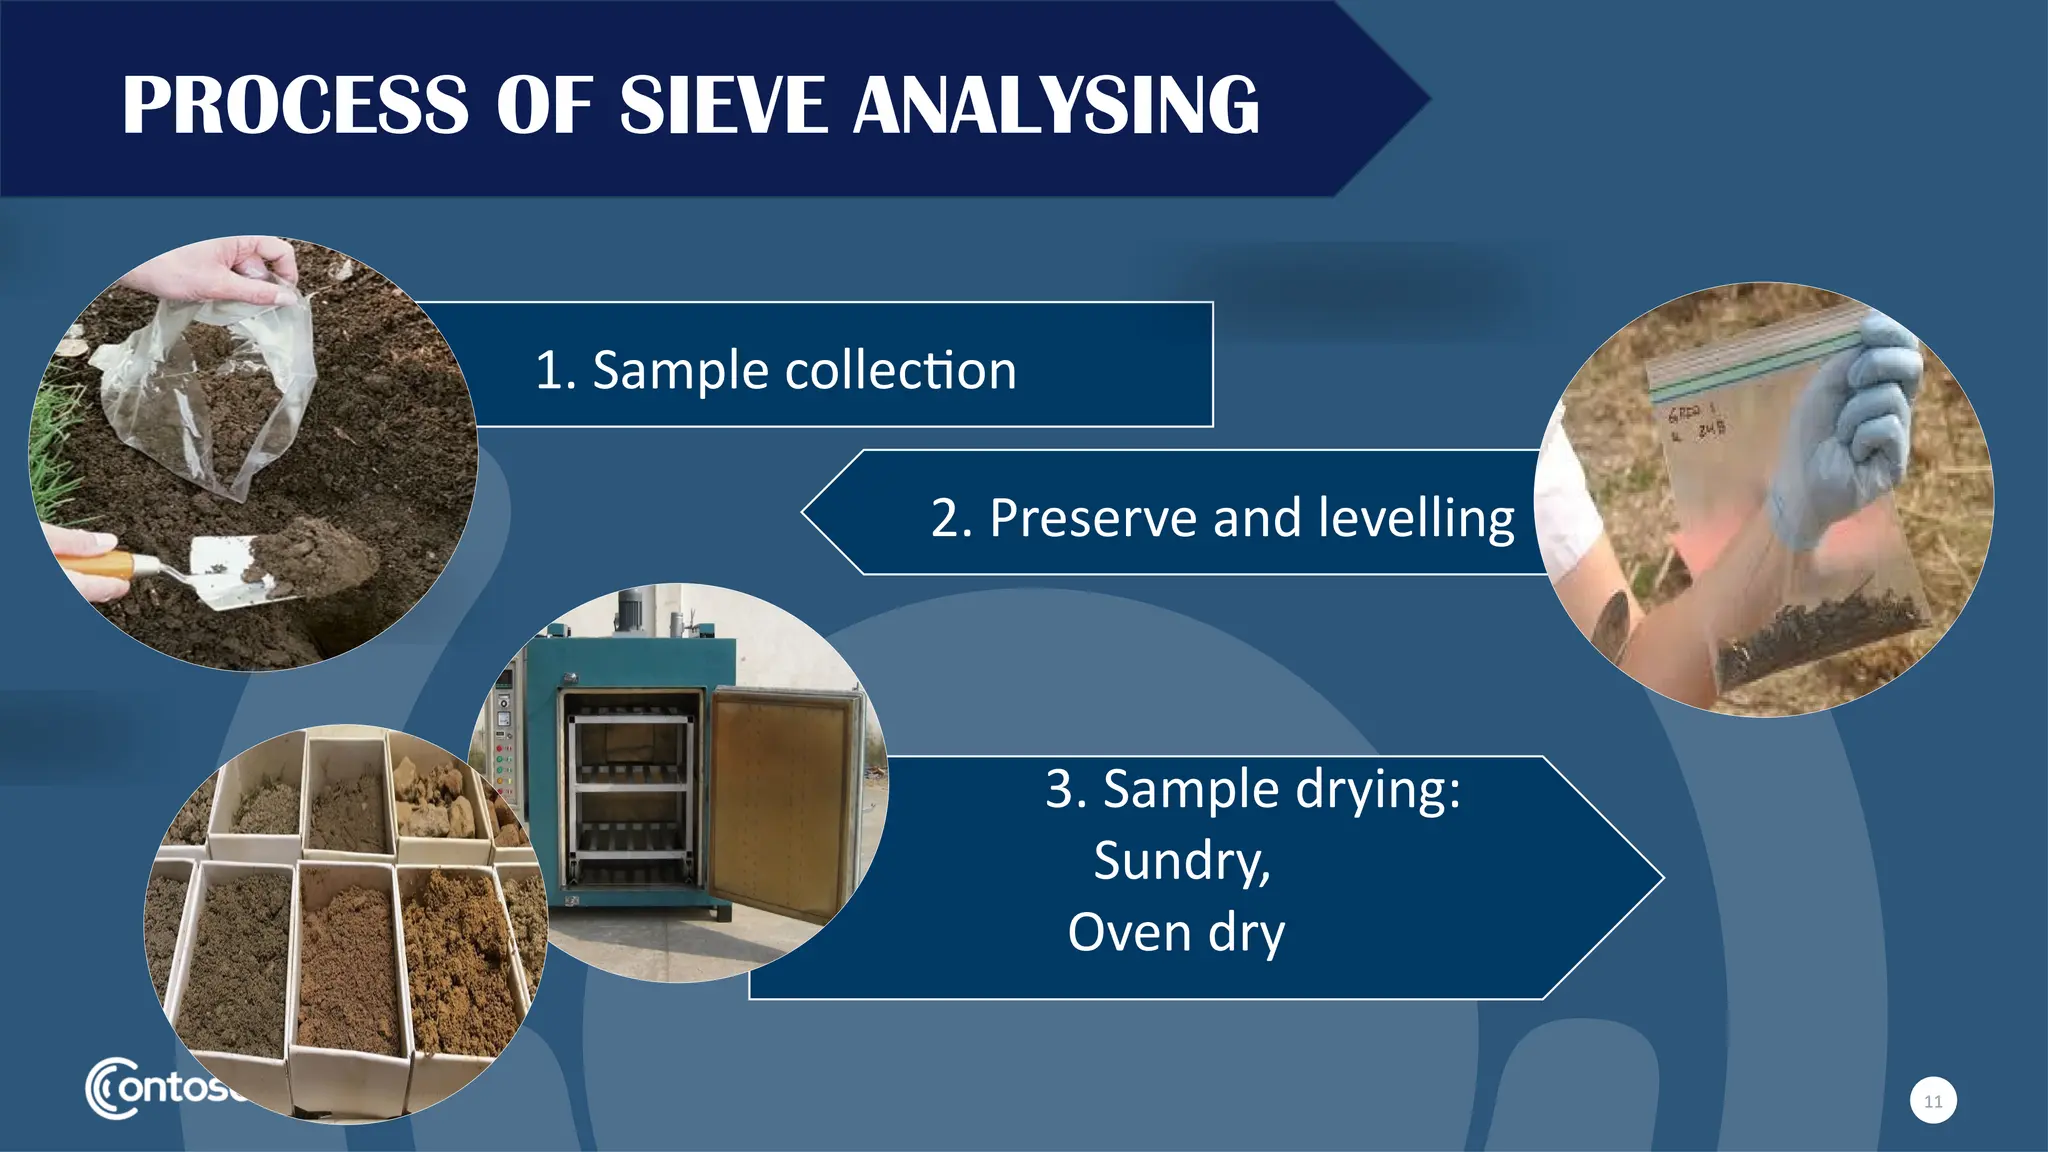
1. Sample collection
2.Preserve and levelling
3. Sample drying:
Sundry,
Oven dry
11
PROCESS OF SIEVE ANALYSING
12.
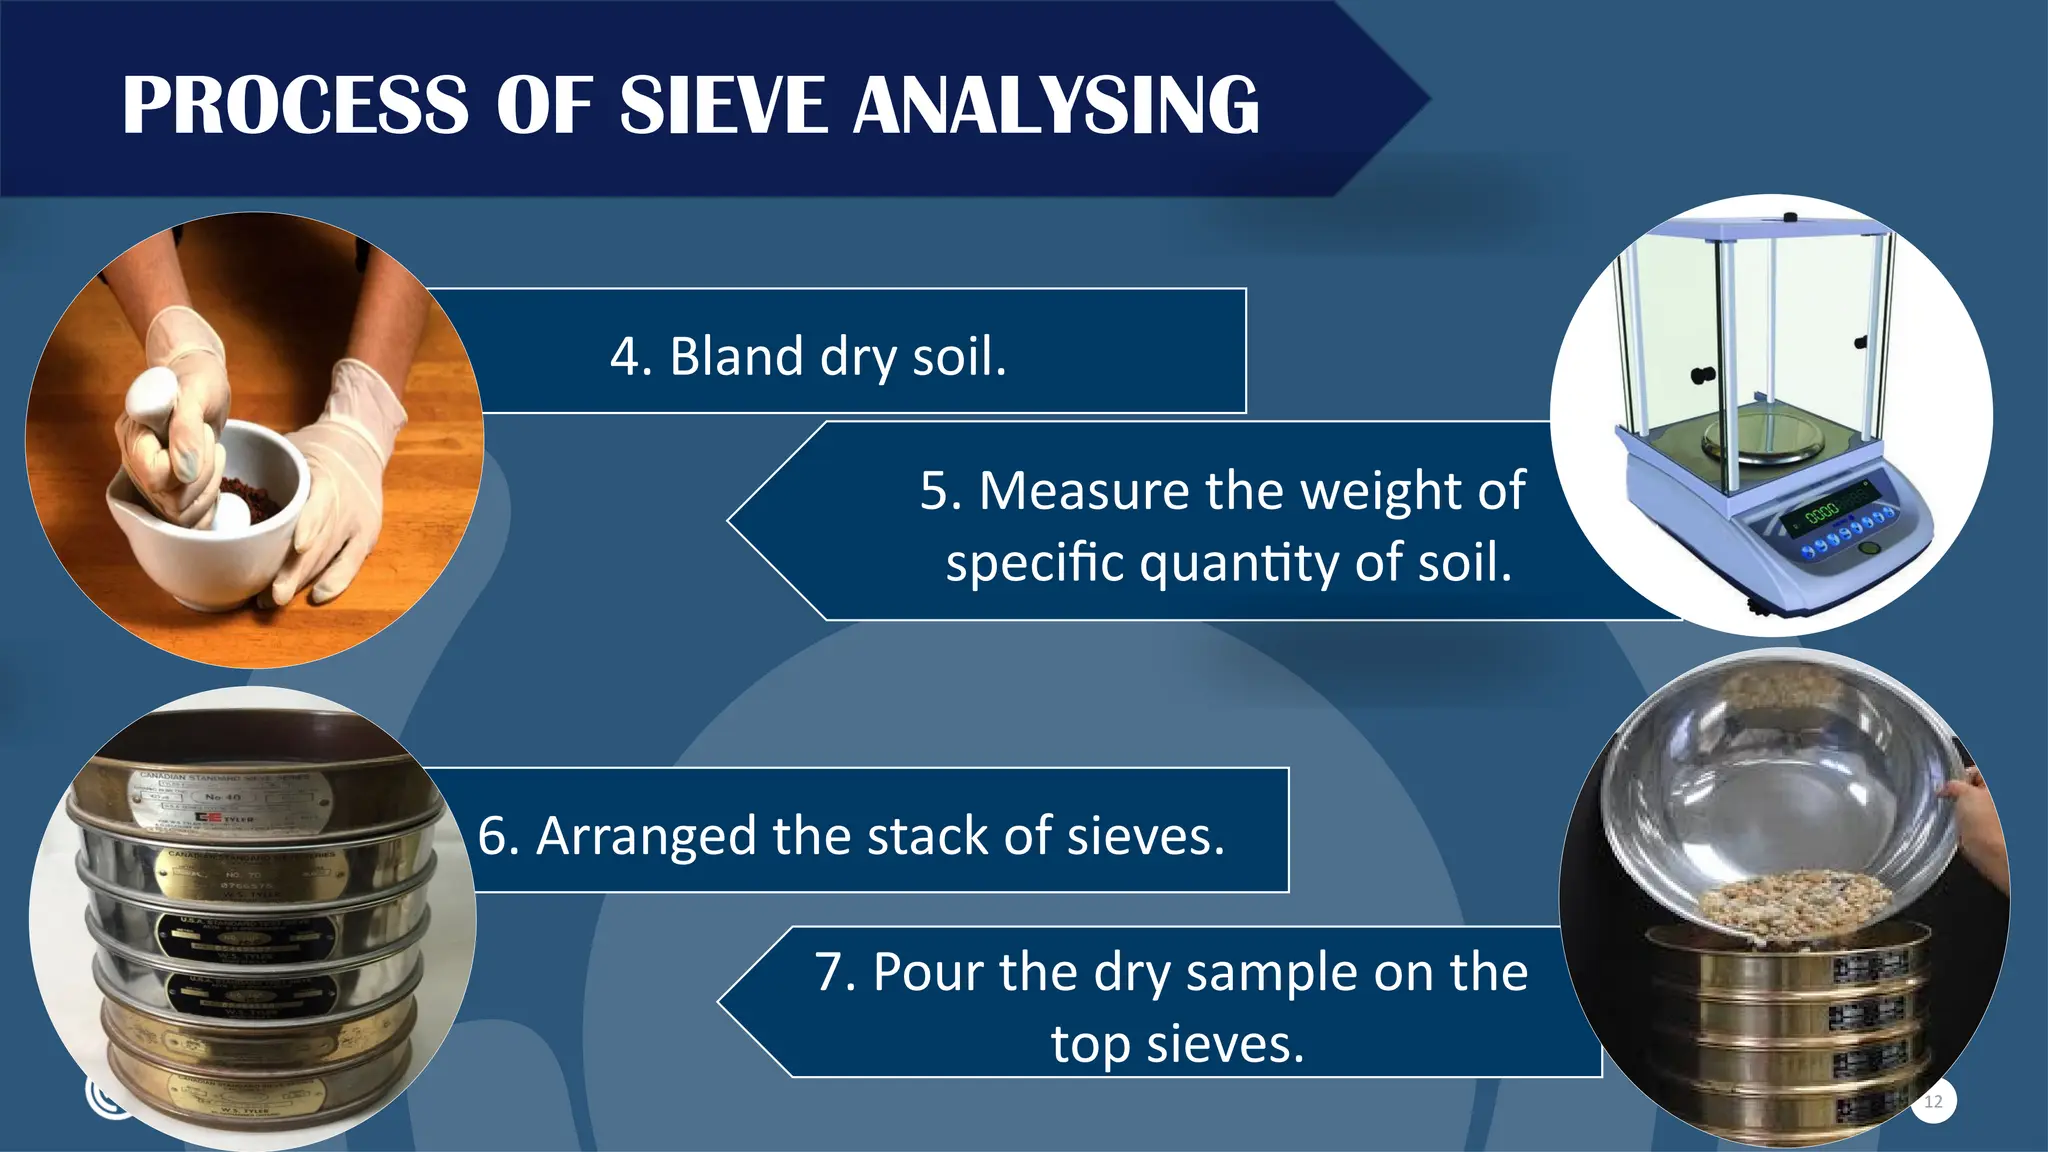
4. Bland drysoil.
7. Pour the dry sample on the
top sieves.
5. Measure the weight of
specific quantity of soil.
6. Arranged the stack of sieves.
12
PROCESS OF SIEVE ANALYSING
13.
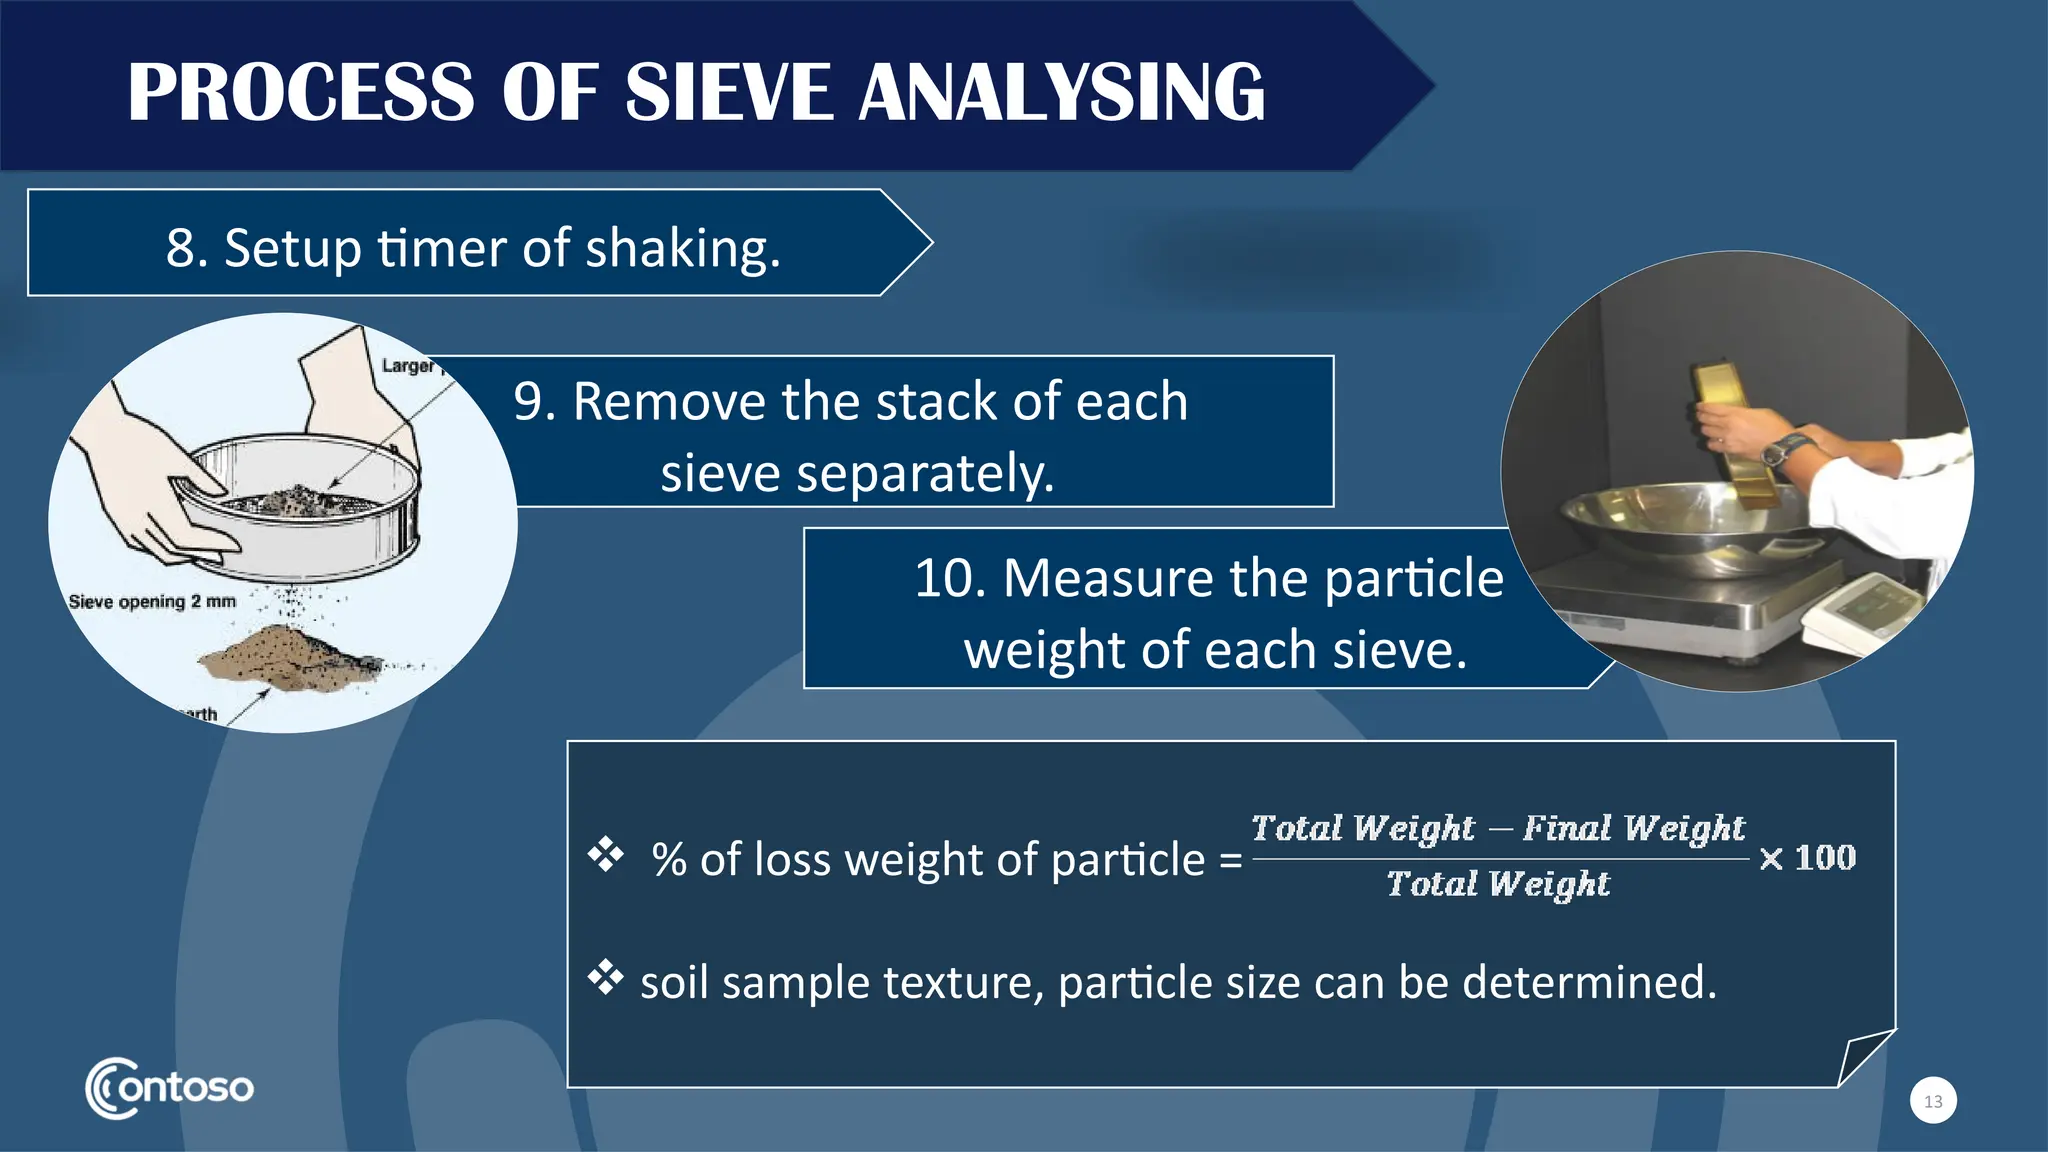
9. Remove thestack of each
sieve separately.
10. Measure the particle
weight of each sieve.
13
PROCESS OF SIEVE ANALYSING
8. Setup timer of shaking.
% of loss weight of particle =
soil sample texture, particle size can be determined.
14.
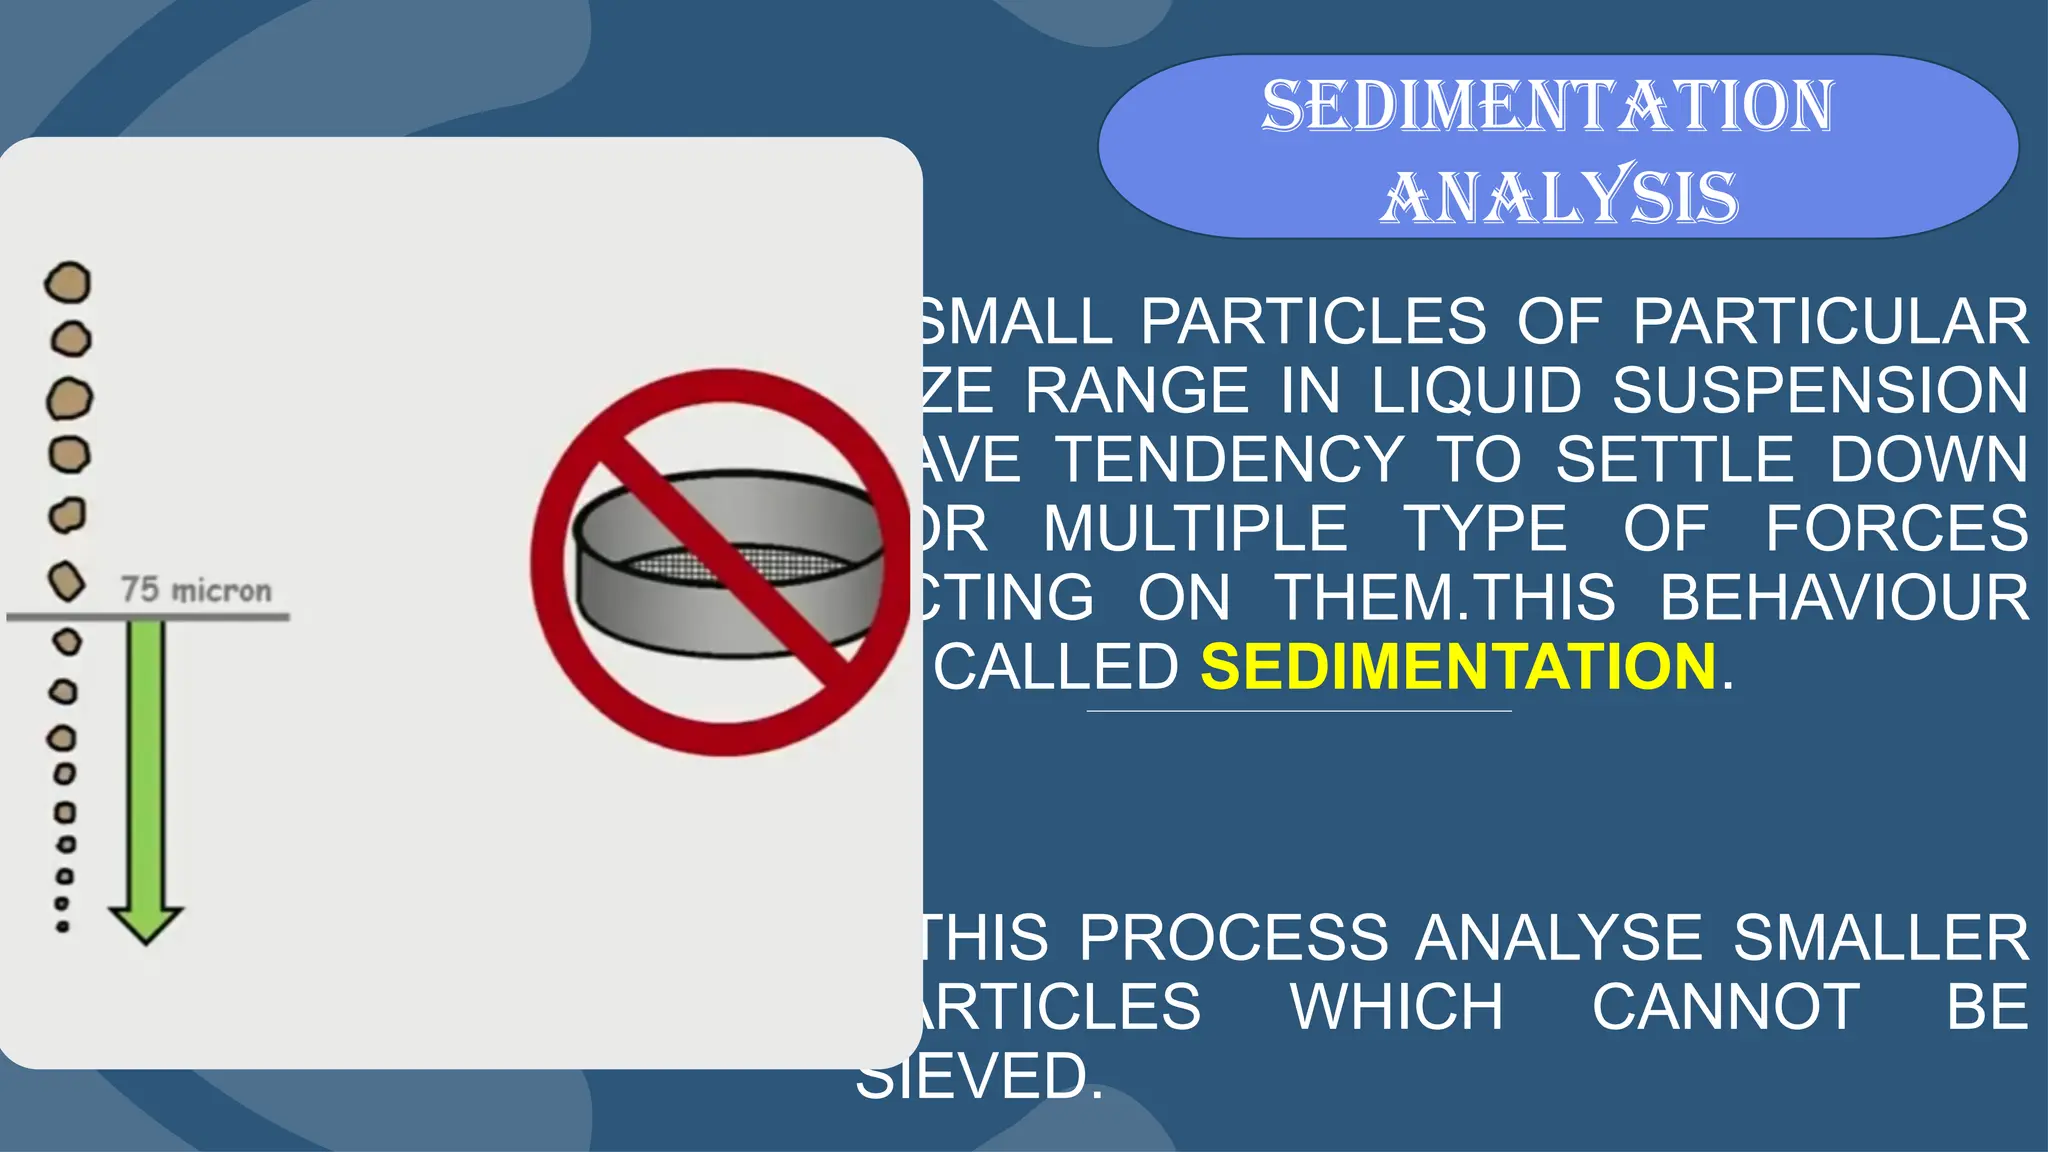
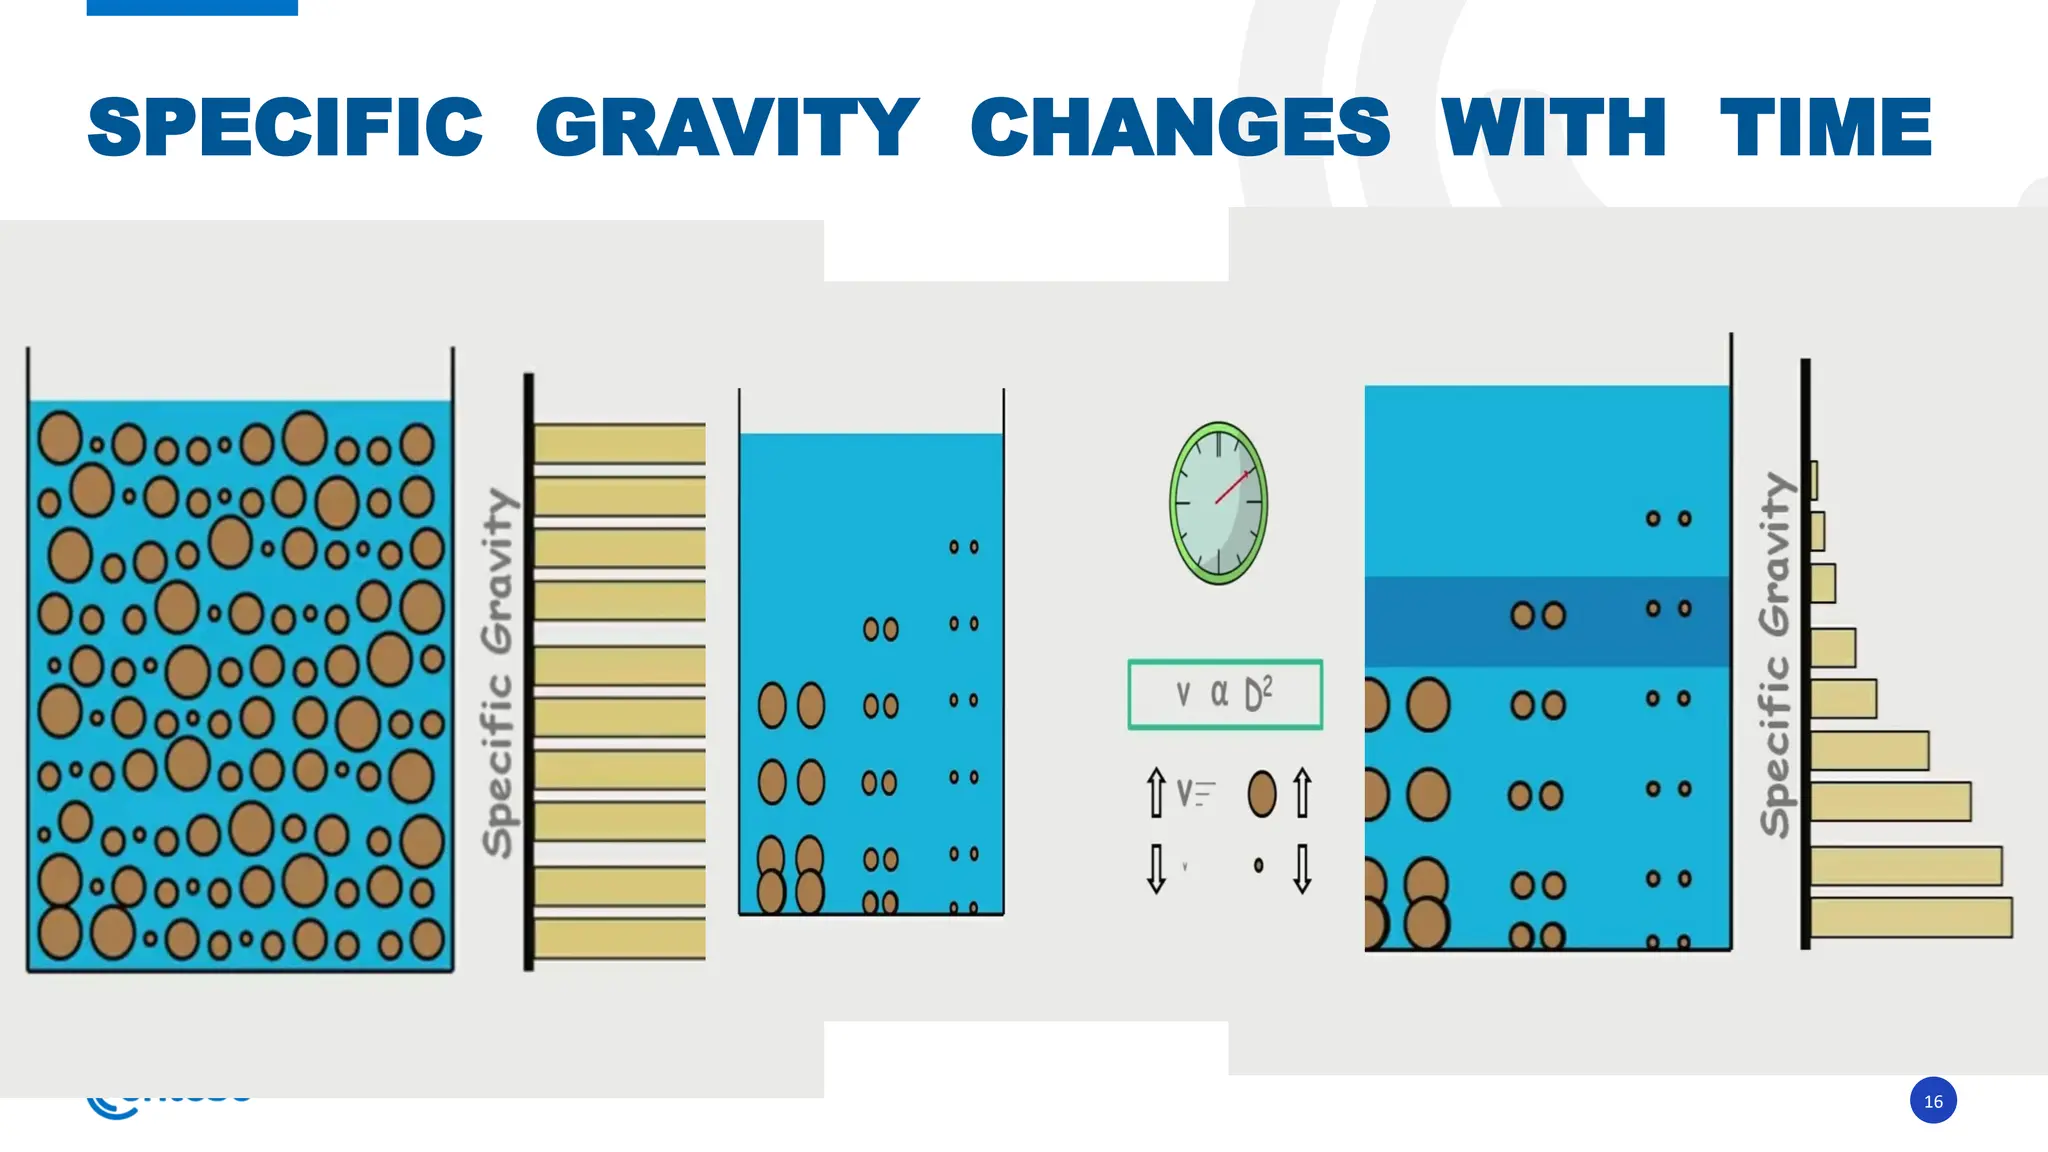
SMALL PARTICLES OFPARTICULAR
SIZE RANGE IN LIQUID SUSPENSION
HAVE TENDENCY TO SETTLE DOWN
FOR MULTIPLE TYPE OF FORCES
ACTING ON THEM.THIS BEHAVIOUR
IS CALLED SEDIMENTATION.
THIS PROCESS ANALYSE SMALLER
PARTICLES WHICH CANNOT BE
SIEVED.
sedimentation
analysis
15.
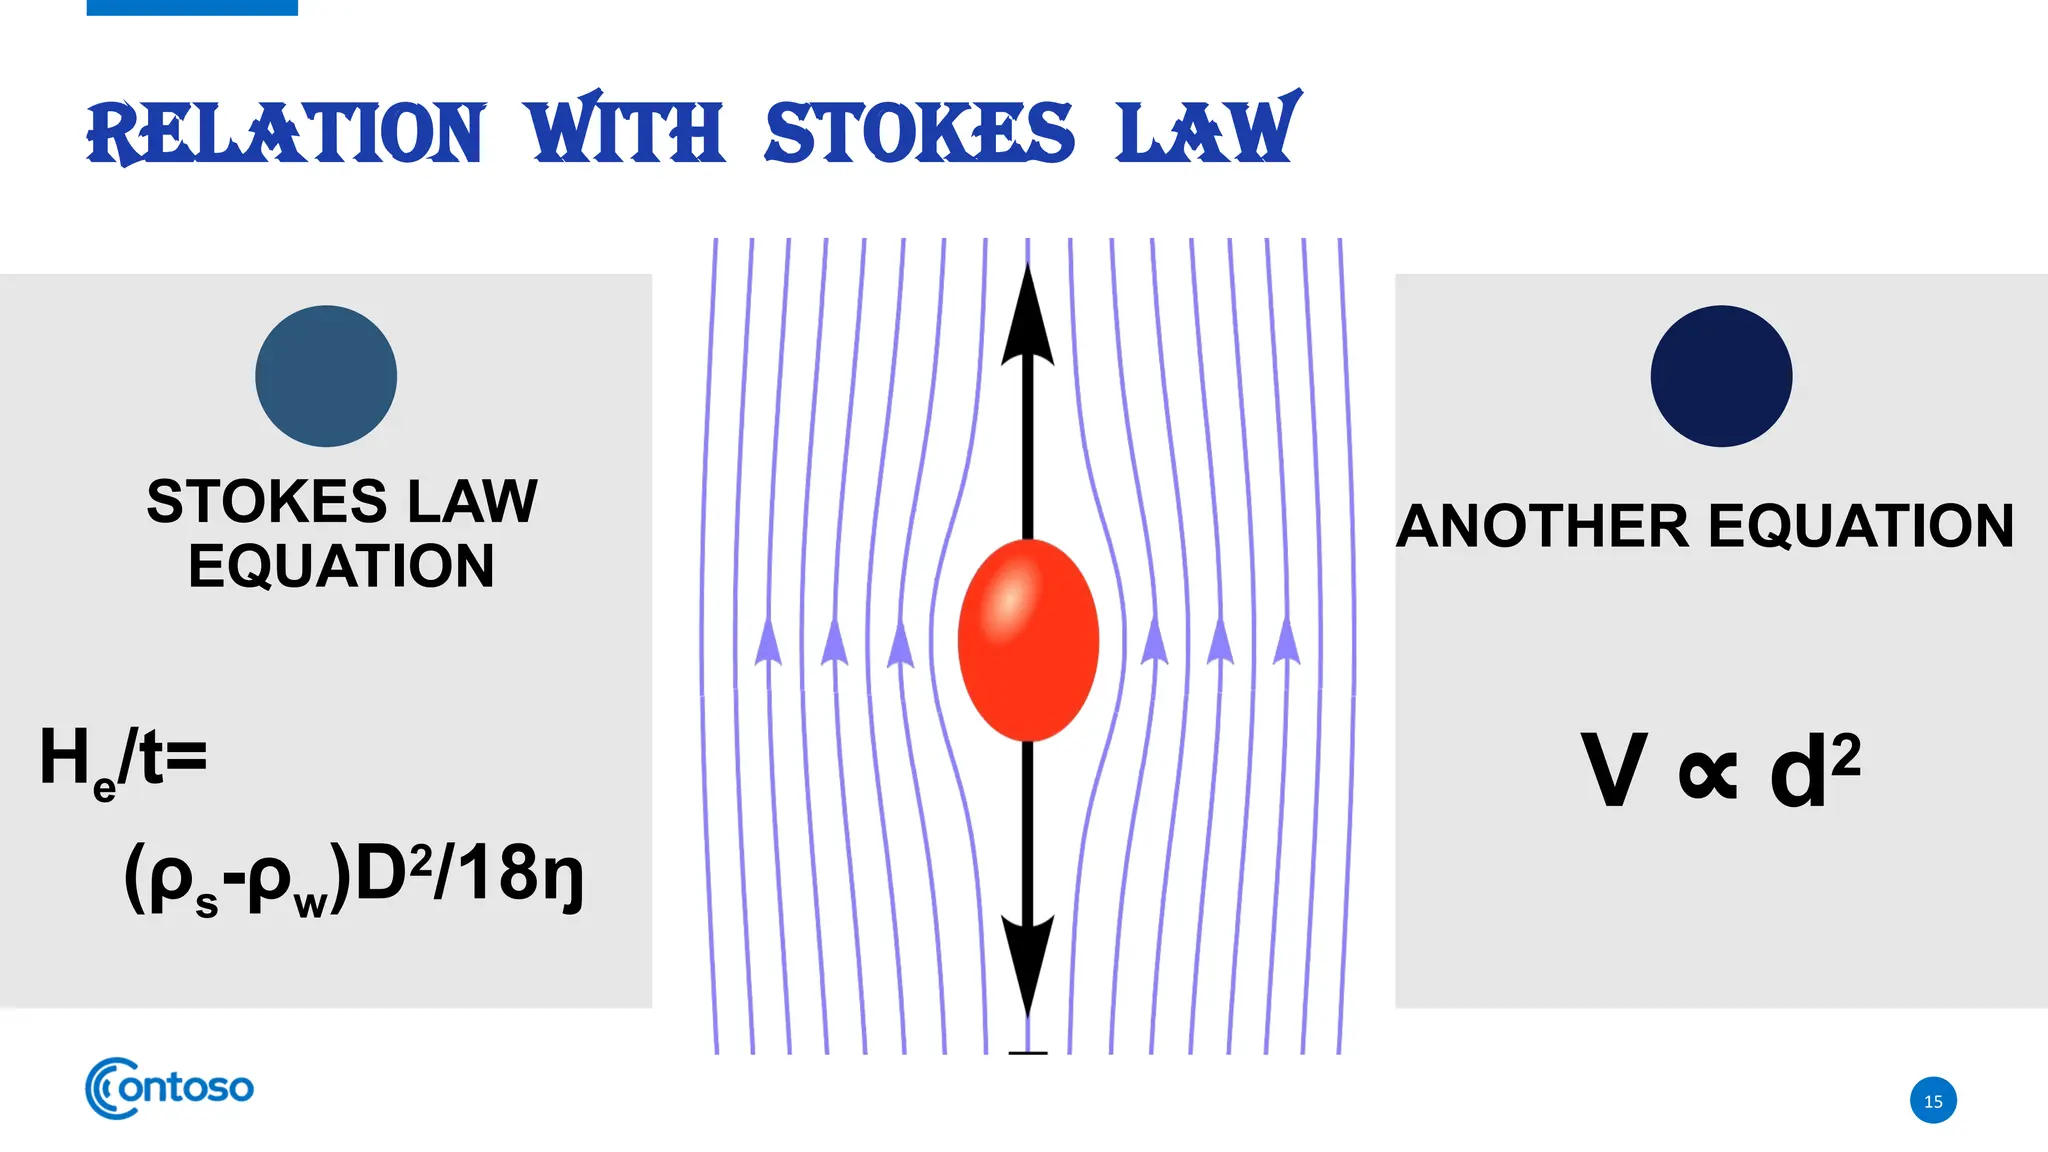
RELATION WITH STOKESLAW
He/t=
(ρs-ρw)D2
/18ŋ
15
V ∝ d2
STOKES LAW
EQUATION
ANOTHER EQUATION
18
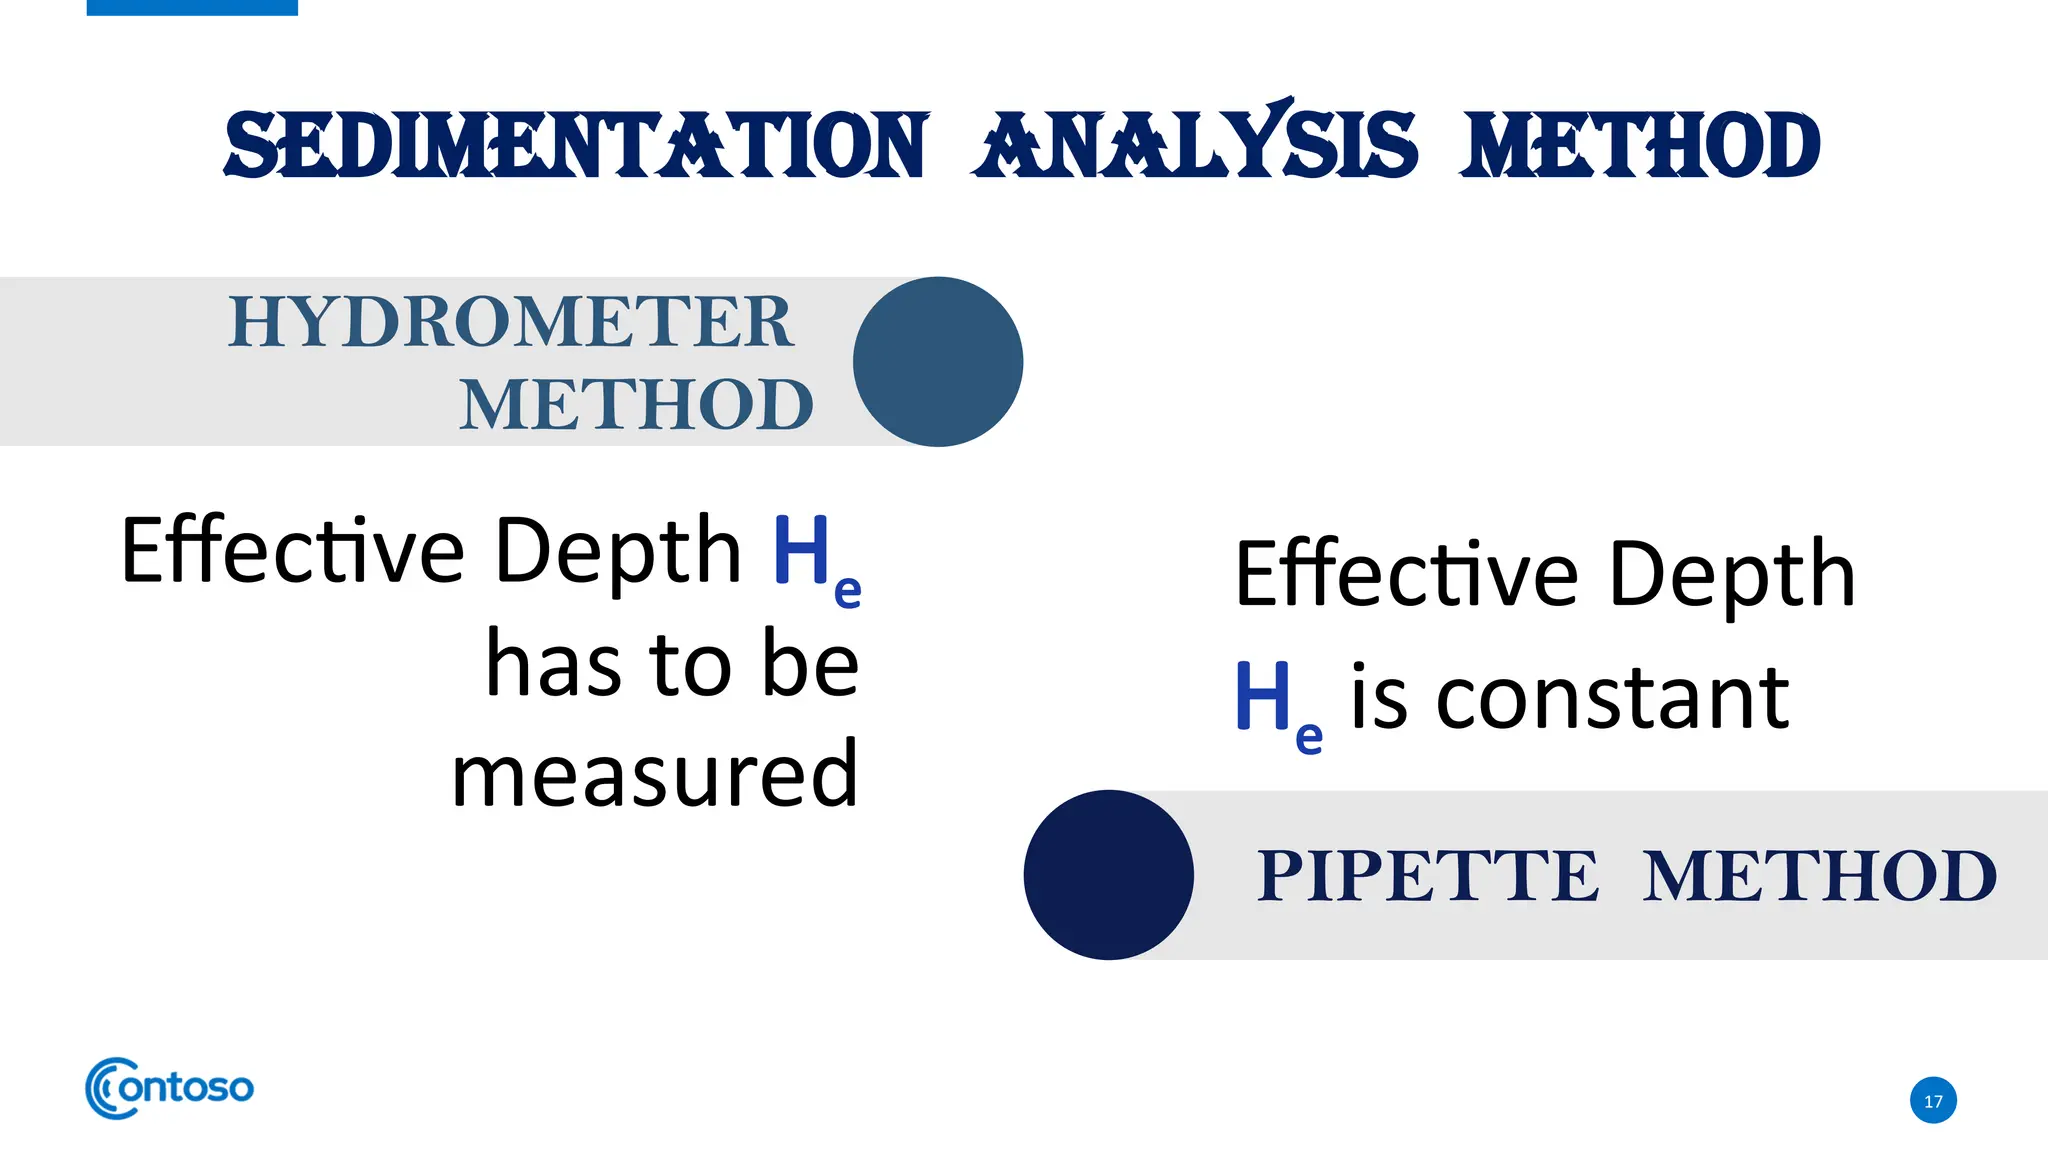
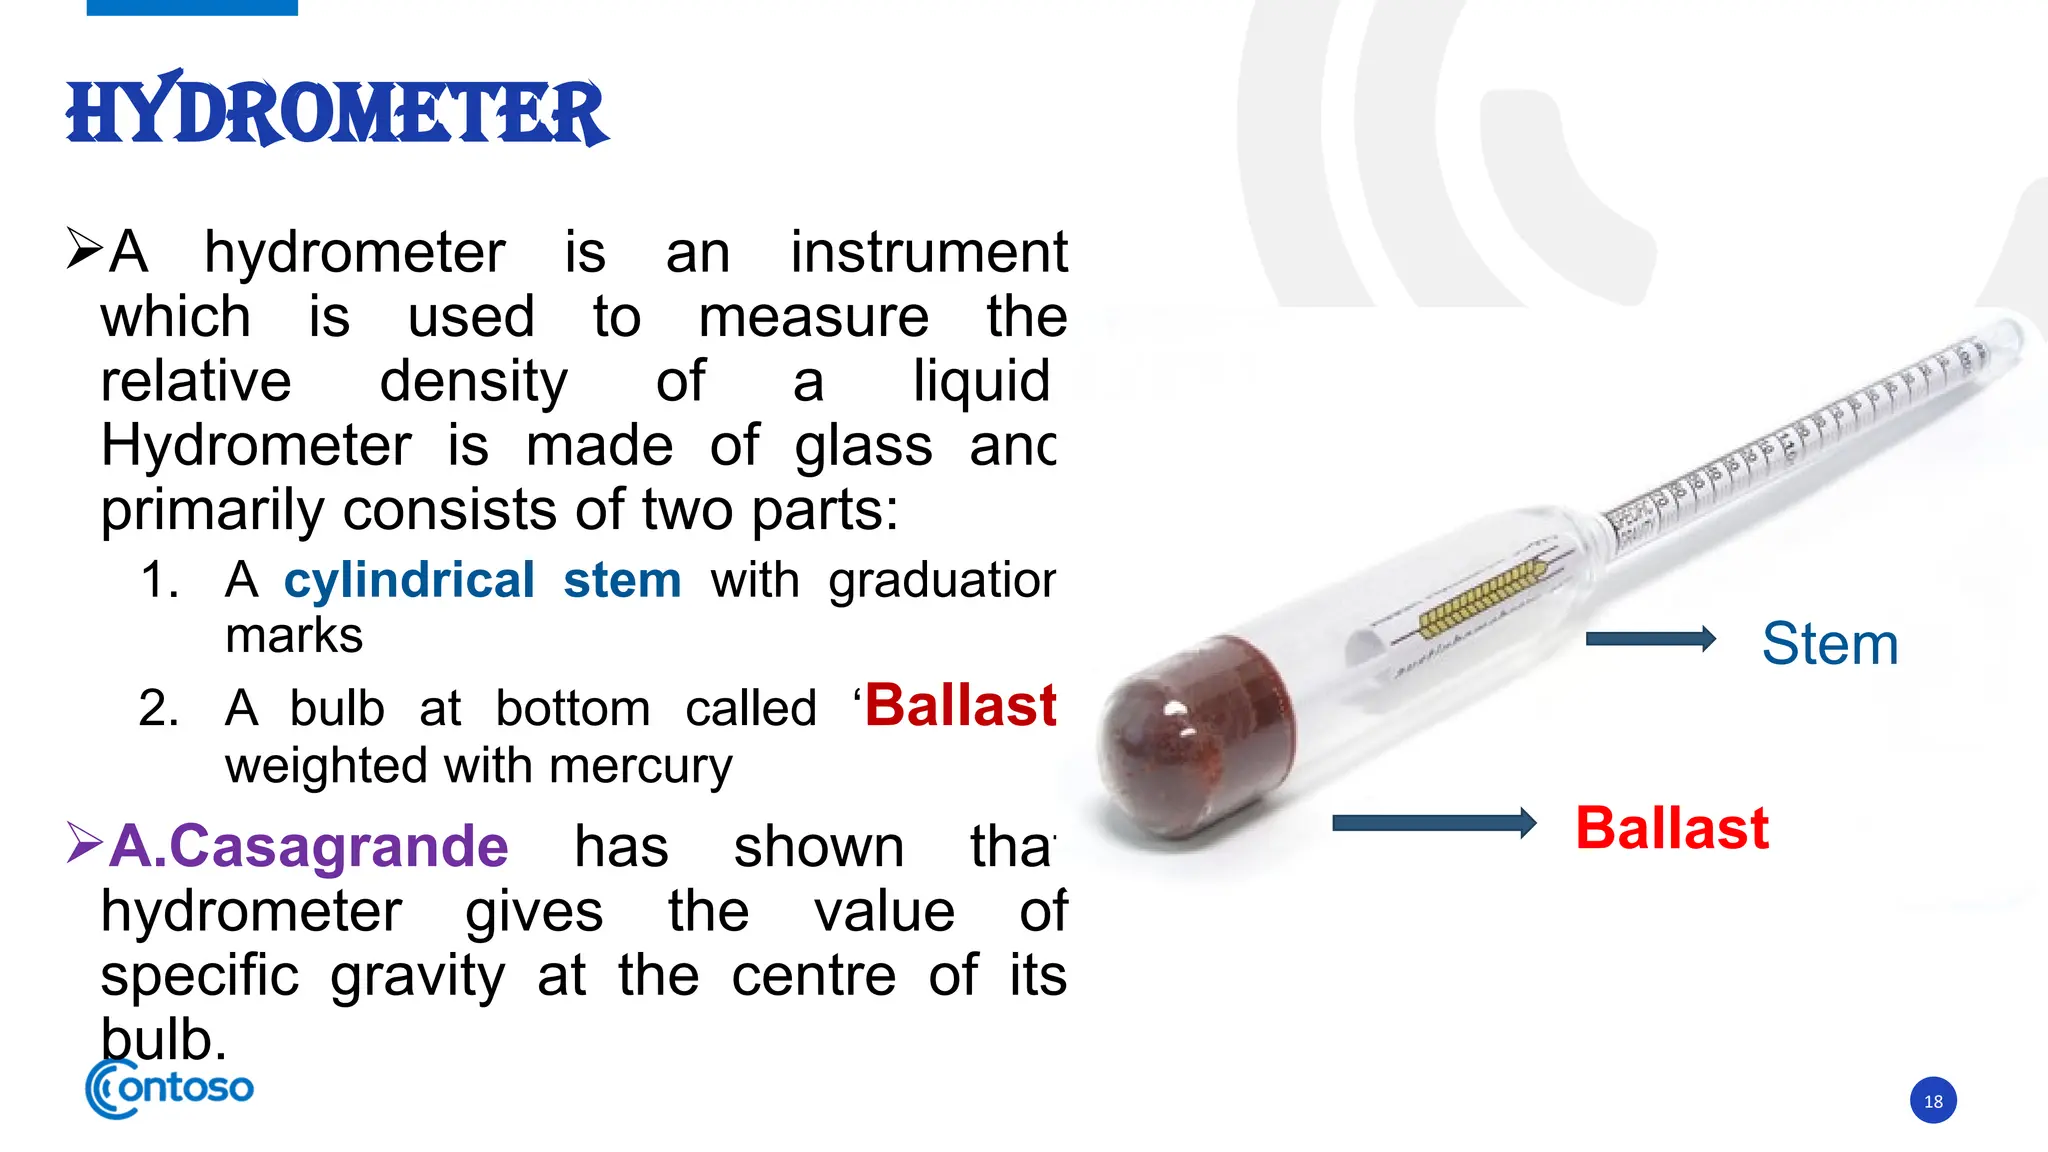
A hydrometer isan instrument
which is used to measure the
relative density of a liquid.
Hydrometer is made of glass and
primarily consists of two parts:
1. A cylindrical stem with graduation
marks
2. A bulb at bottom called ‘Ballast’
weighted with mercury
A.Casagrande has shown that
hydrometer gives the value of
specific gravity at the centre of its
bulb.
HYDROMETER
Ballast
Stem
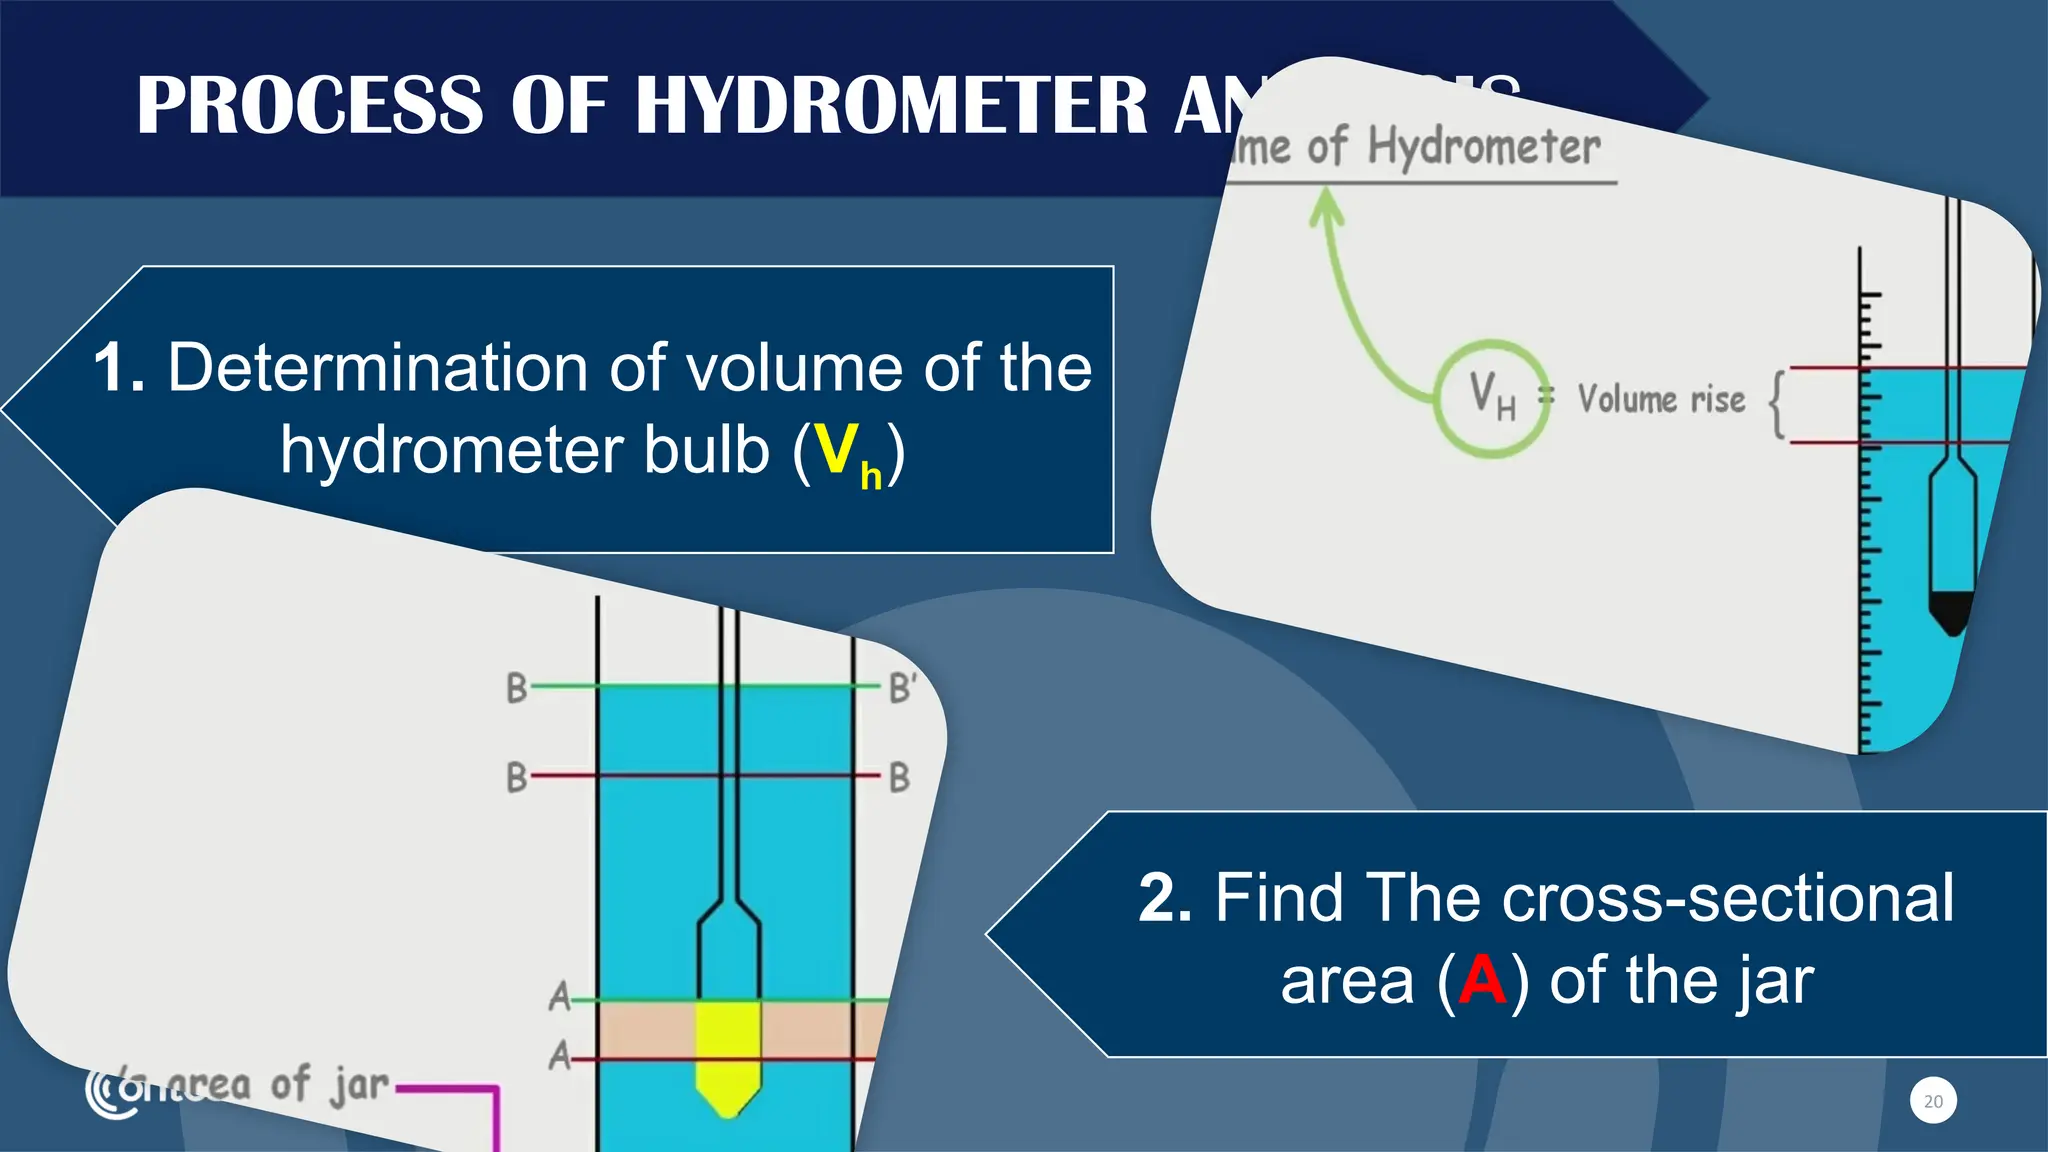
1. Determination ofvolume of the
hydrometer bulb (Vh)
2. Find The cross-sectional
area (A) of the jar
20
PROCESS OF HYDROMETER ANALYSIS
21.
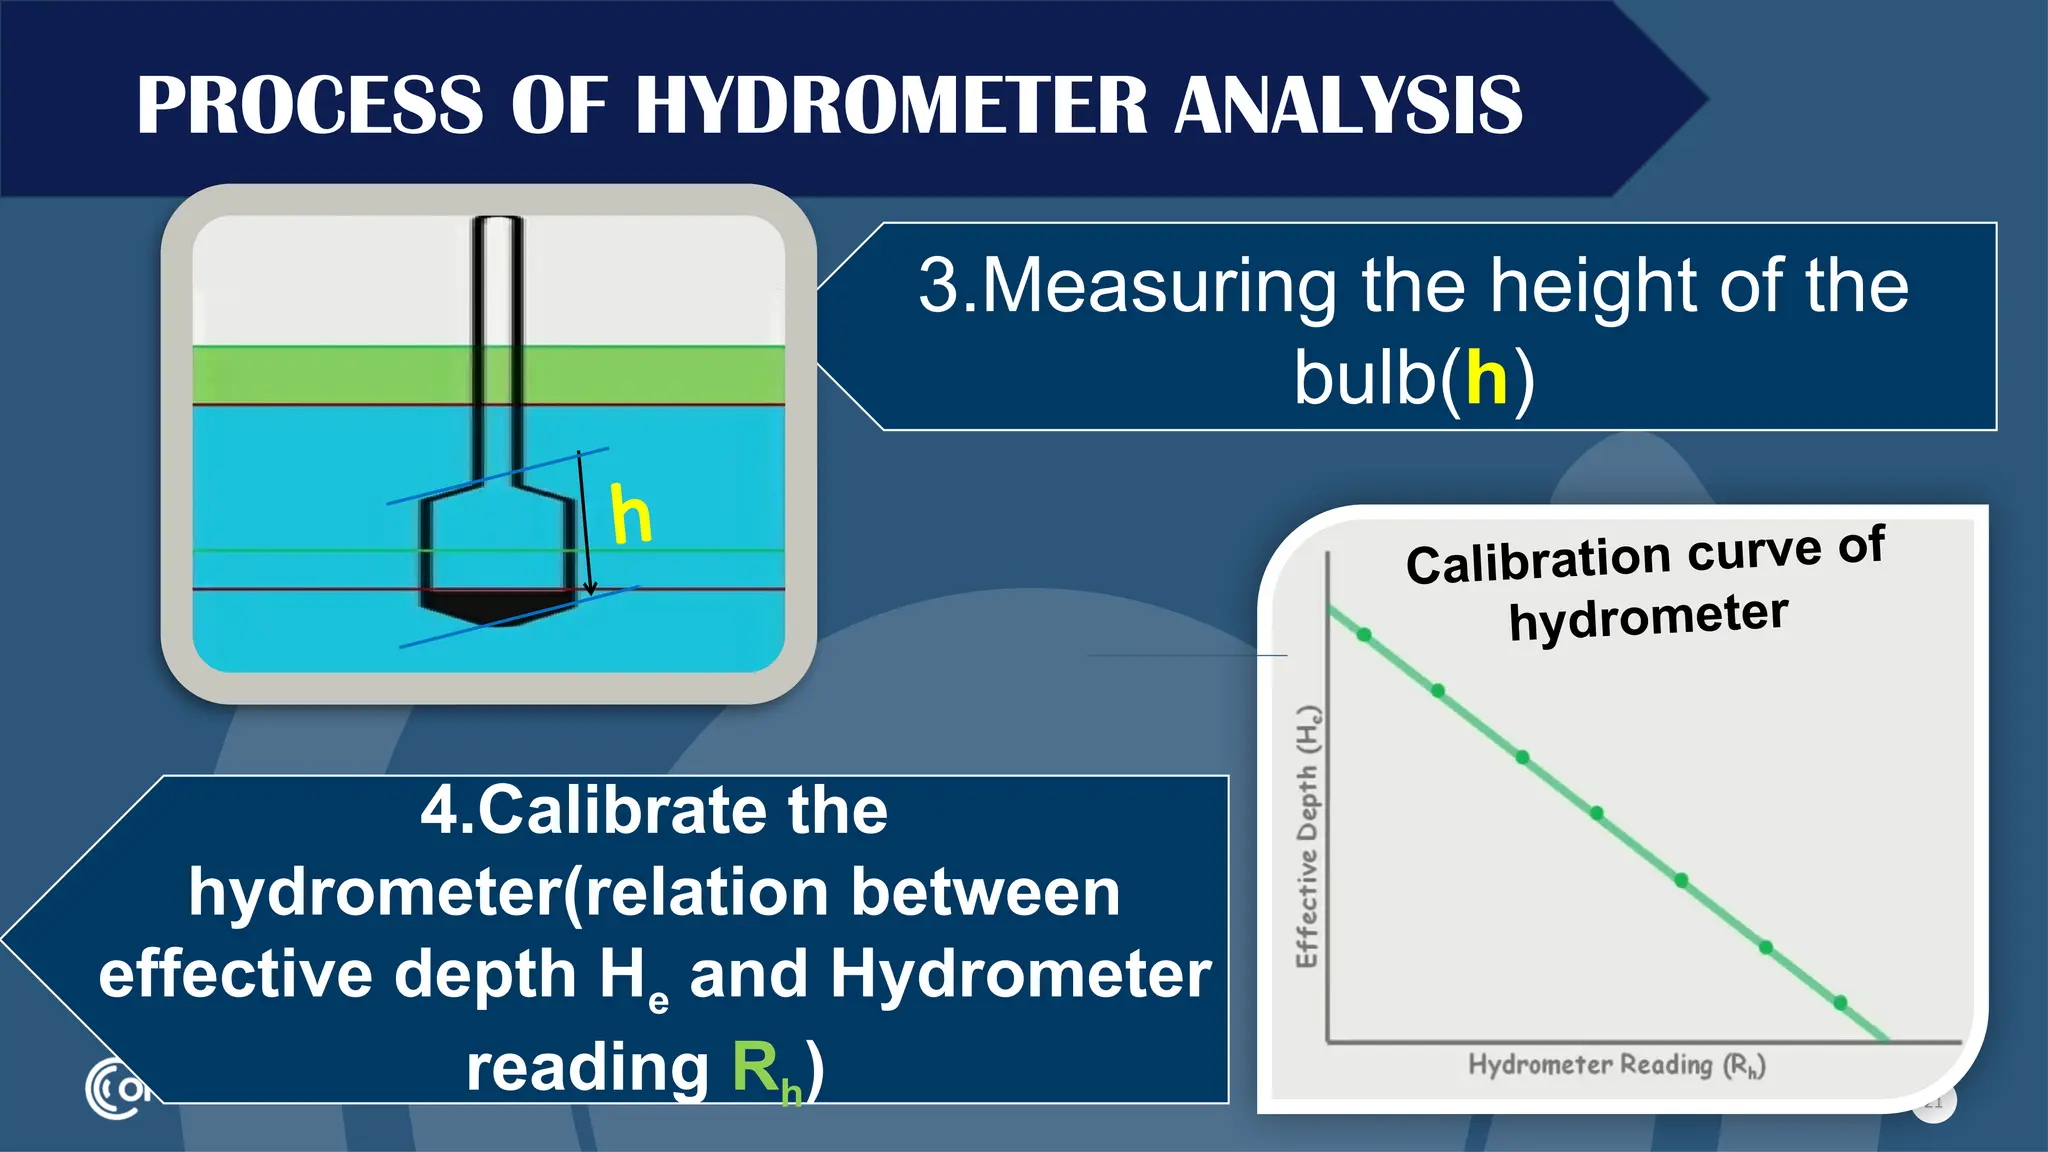
3.Measuring the heightof the
bulb(h)
4.Calibrate the
hydrometer(relation between
effective depth He and Hydrometer
reading Rh) 21
PROCESS OF HYDROMETER ANALYSIS
h Calibration curve of
hydrometer
22.
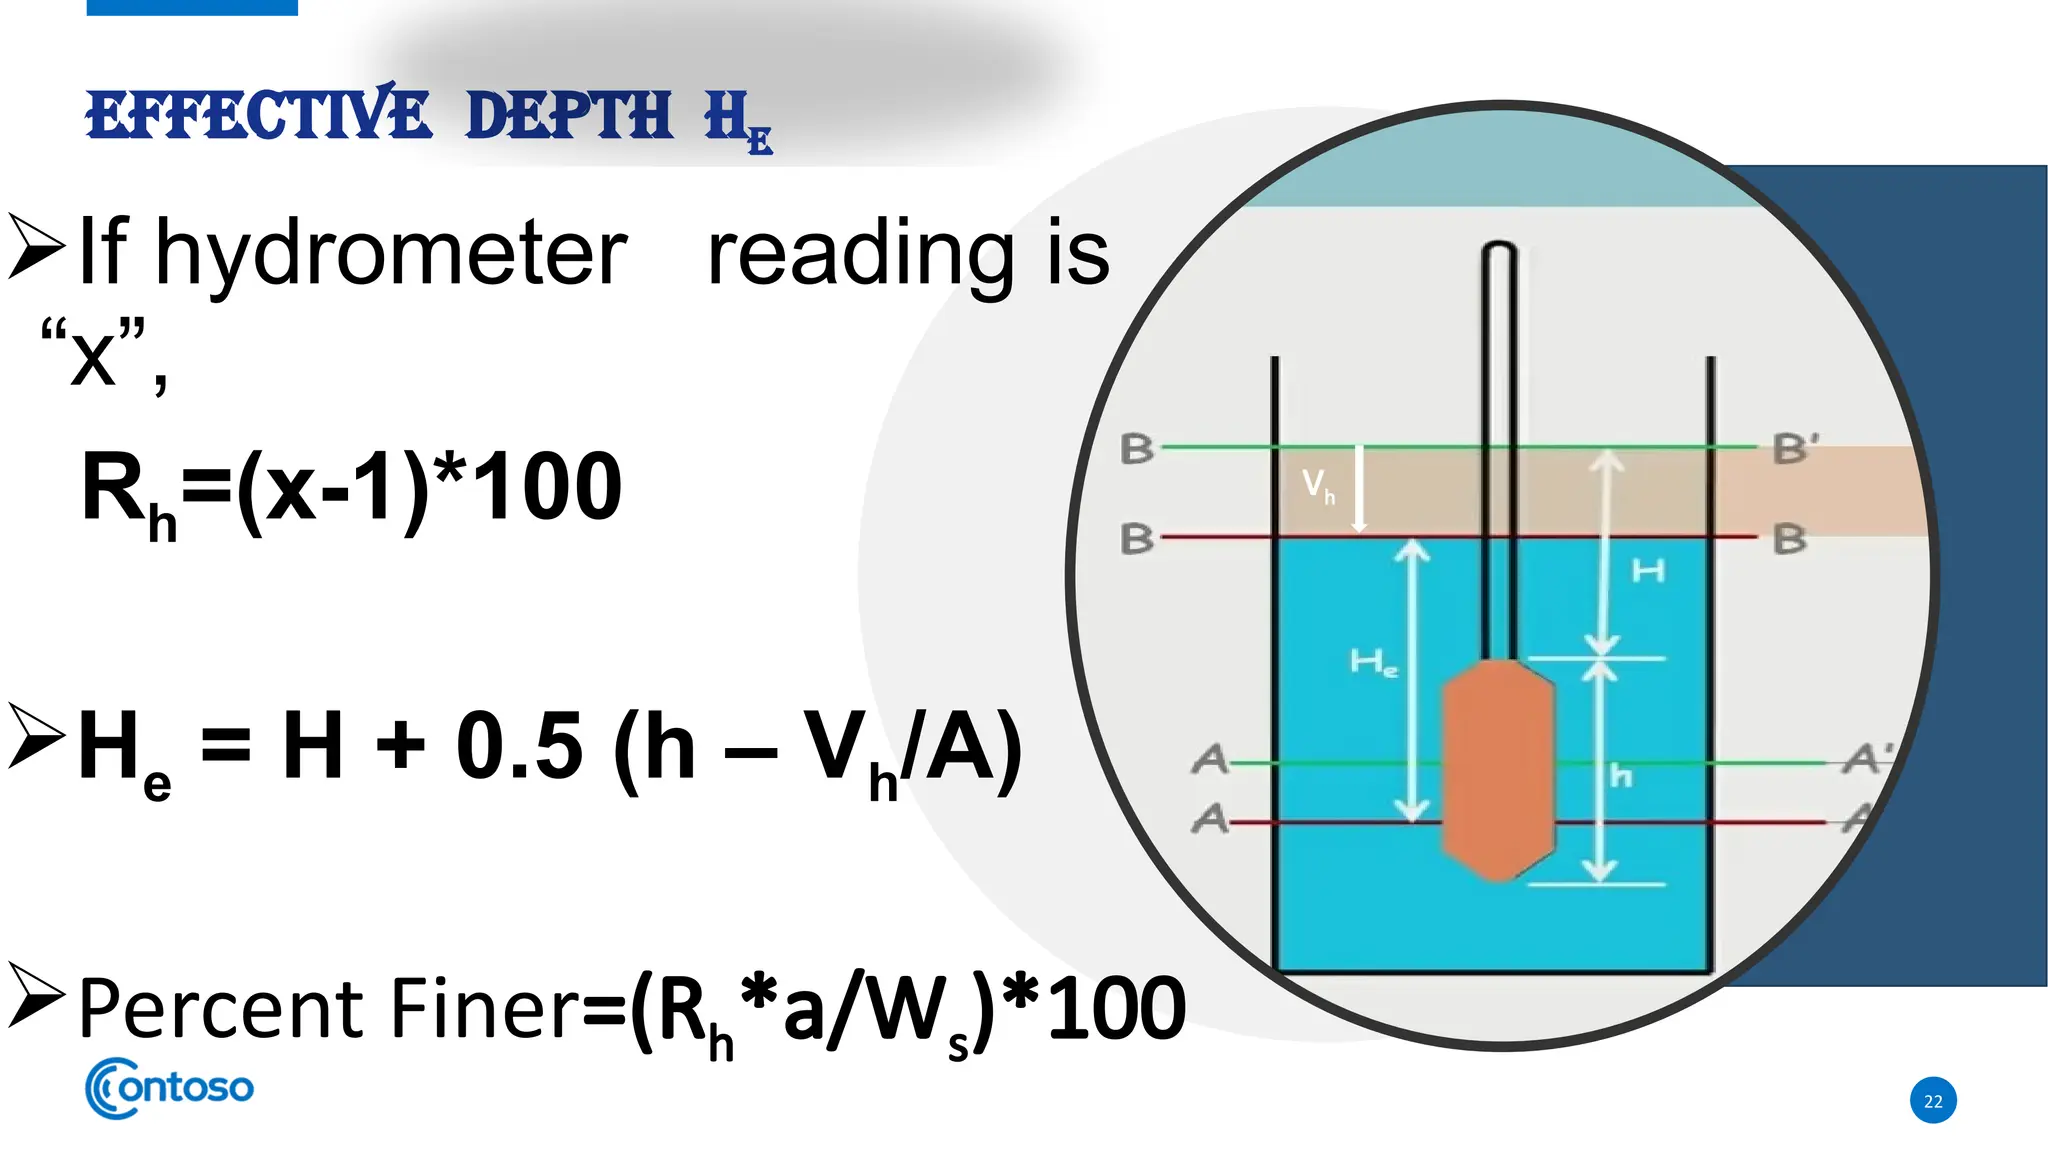
EFFECTIVE DEPTH
If hydrometerreading is
“x”,
Rh=(x-1)*100
He = H + 0.5 (h – Vh/A)
Percent Finer=(Rh*a/Ws)*100
22
He
Vh
23.
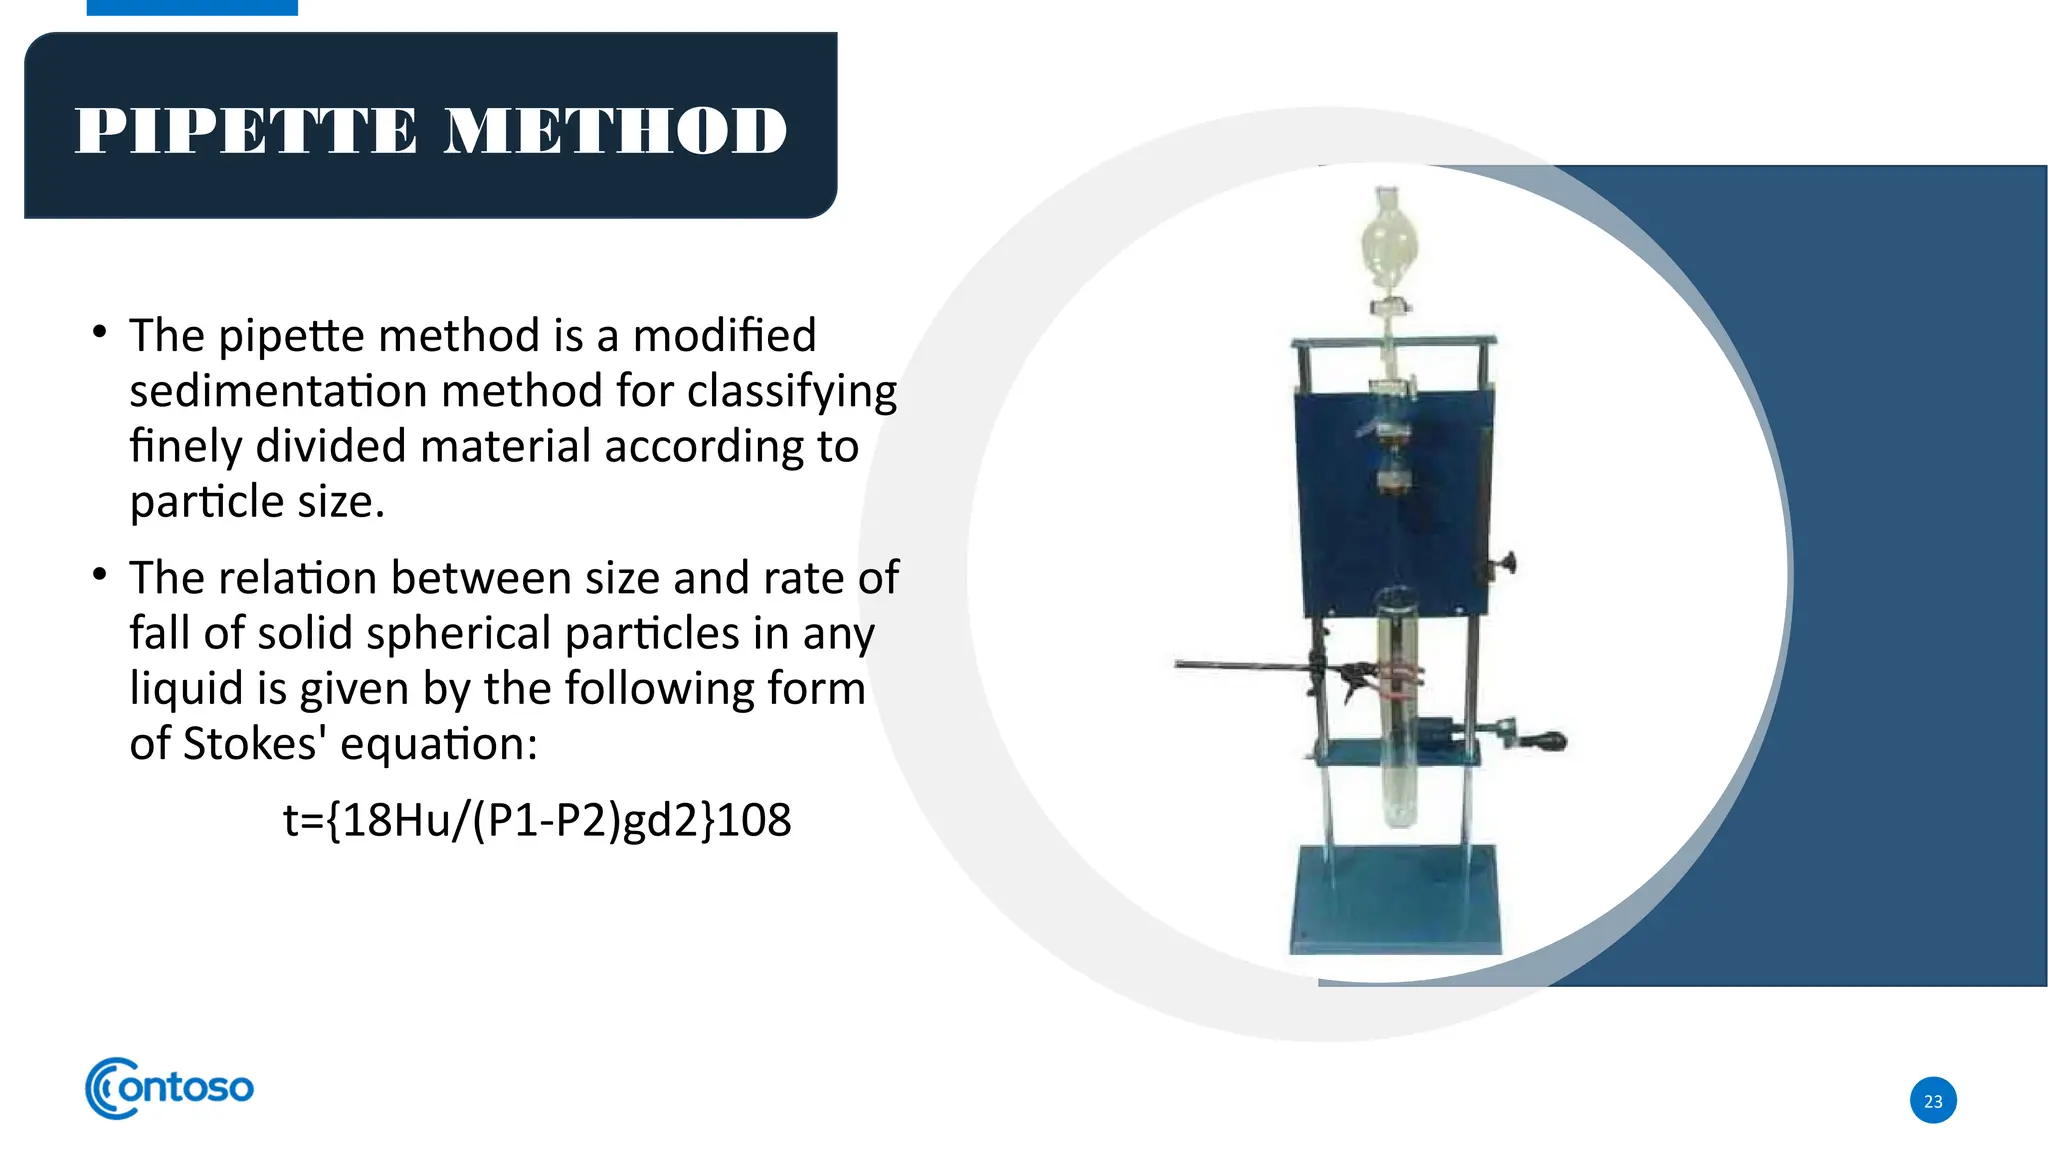
• The pipettemethod is a modified
sedimentation method for classifying
finely divided material according to
particle size.
• The relation between size and rate of
fall of solid spherical particles in any
liquid is given by the following form
of Stokes' equation:
t={18Hu/(P1-P2)gd2}108
23
PIPETTE METHOD
24.
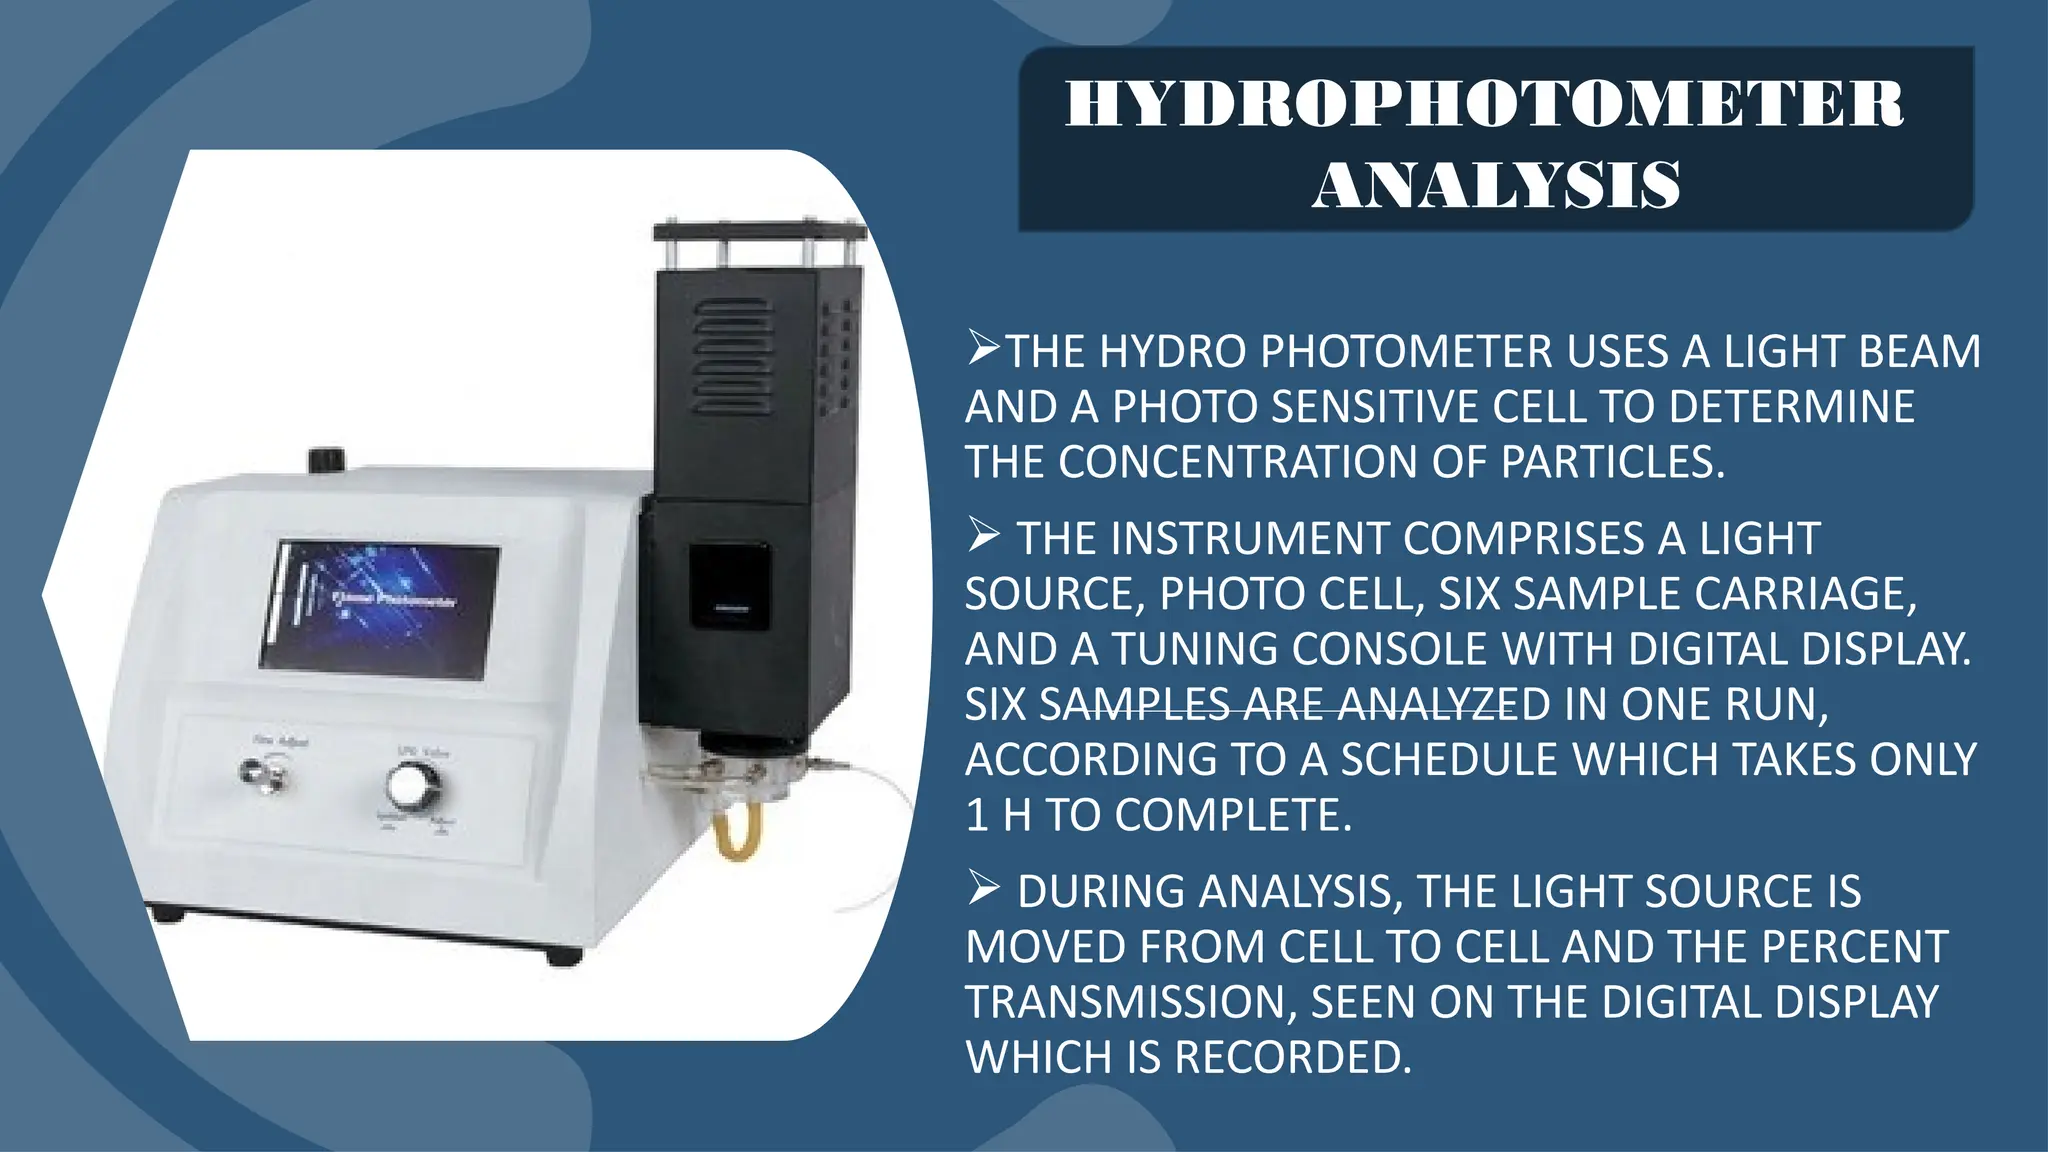
THE HYDRO PHOTOMETERUSES A LIGHT BEAM
AND A PHOTO SENSITIVE CELL TO DETERMINE
THE CONCENTRATION OF PARTICLES.
THE INSTRUMENT COMPRISES A LIGHT
SOURCE, PHOTO CELL, SIX SAMPLE CARRIAGE,
AND A TUNING CONSOLE WITH DIGITAL DISPLAY.
SIX SAMPLES ARE ANALYZED IN ONE RUN,
ACCORDING TO A SCHEDULE WHICH TAKES ONLY
1 H TO COMPLETE.
DURING ANALYSIS, THE LIGHT SOURCE IS
MOVED FROM CELL TO CELL AND THE PERCENT
TRANSMISSION, SEEN ON THE DIGITAL DISPLAY
WHICH IS RECORDED.
HYDROPHOTOMETER
ANALYSIS
25.
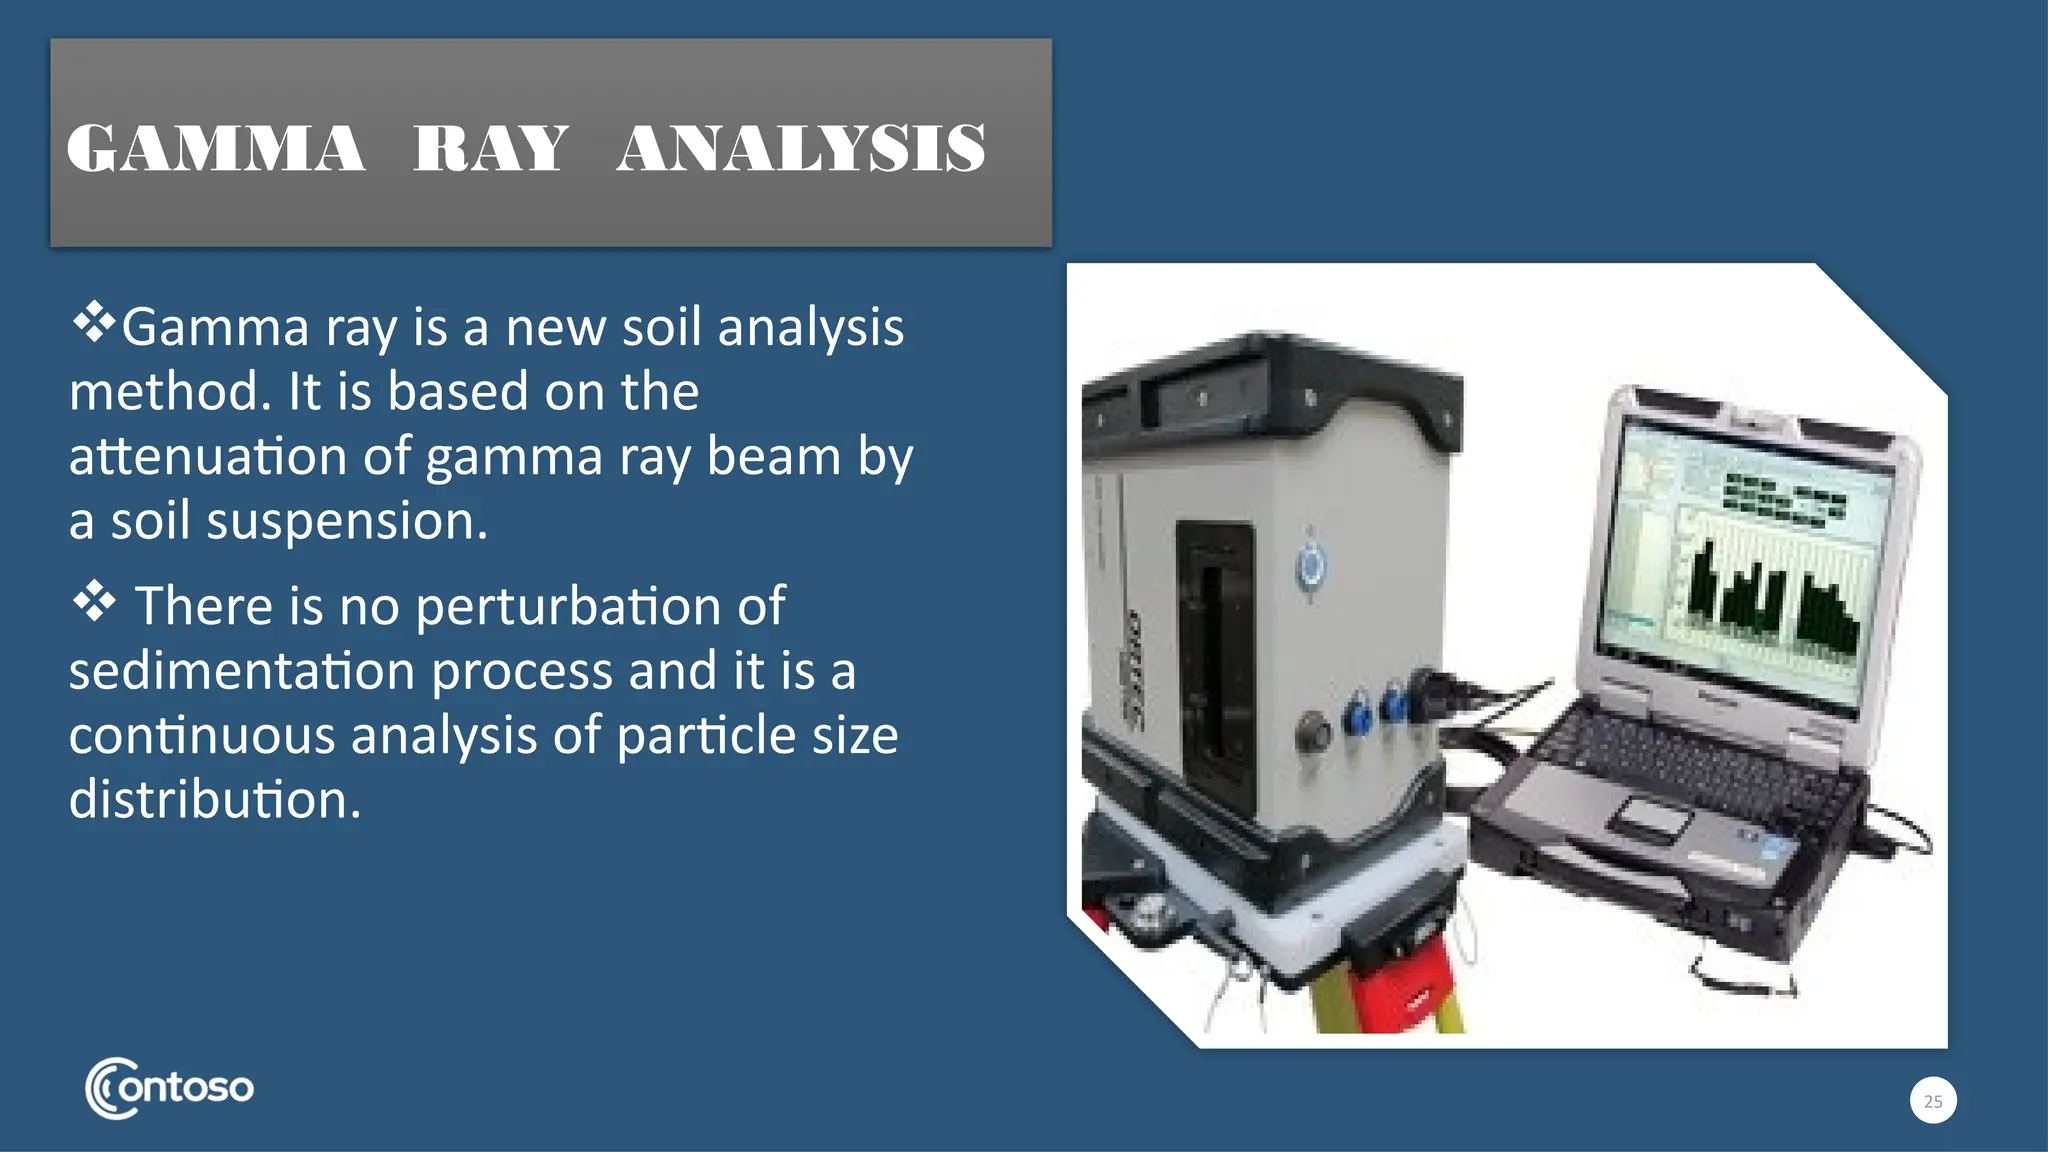
Gamma ray isa new soil analysis
method. It is based on the
attenuation of gamma ray beam by
a soil suspension.
There is no perturbation of
sedimentation process and it is a
continuous analysis of particle size
distribution.
25
GAMMA RAY ANALYSIS
26.
9
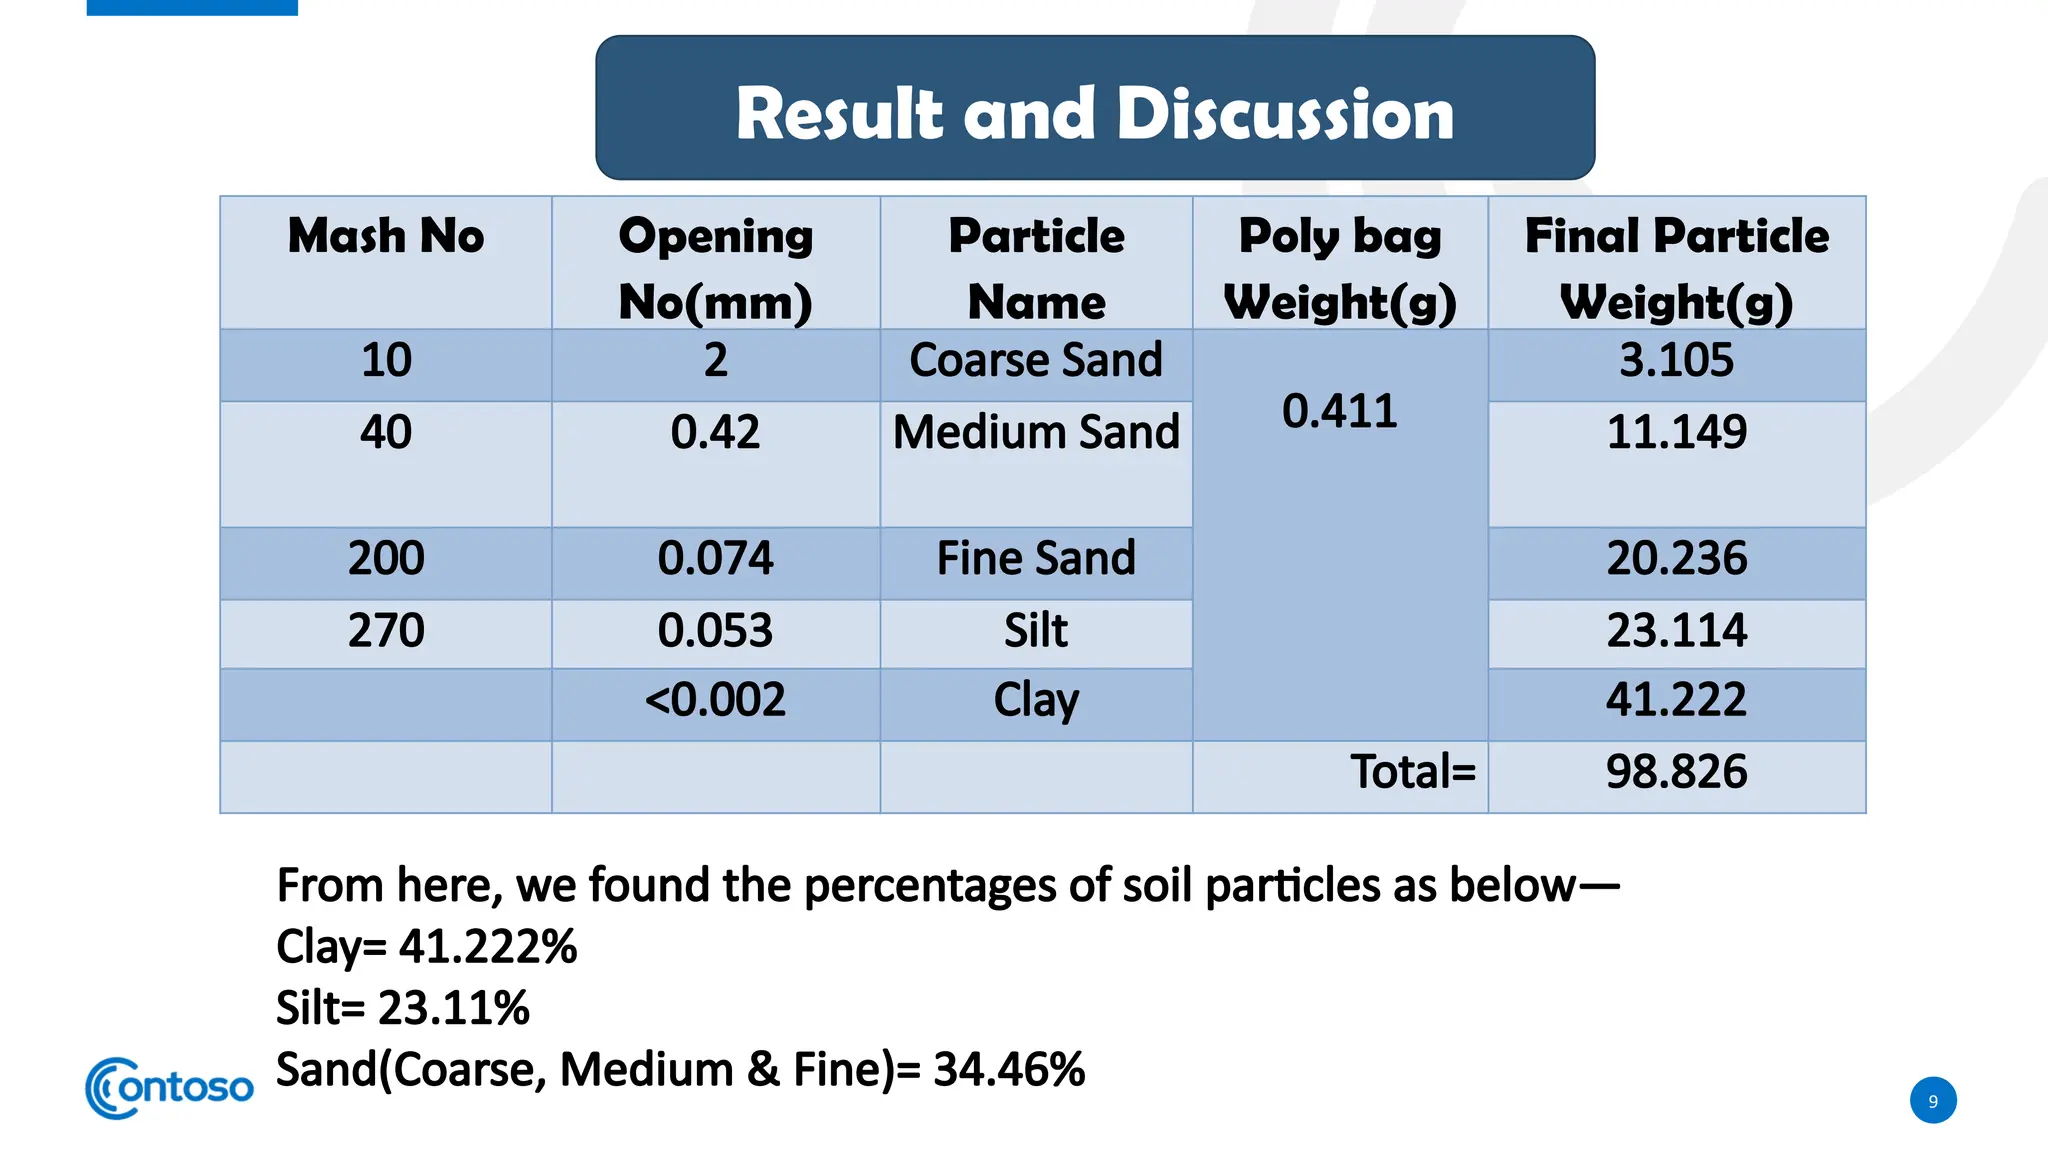
Mash No Opening
No(mm)
Particle
Name
Polybag
Weight(g)
Final Particle
Weight(g)
10 2 Coarse Sand
0.411
3.105
40 0.42 Medium Sand 11.149
200 0.074 Fine Sand 20.236
270 0.053 Silt 23.114
<0.002 Clay 41.222
Total= 98.826
From here, we found the percentages of soil particles as below—
Clay= 41.222%
Silt= 23.11%
Sand(Coarse, Medium & Fine)= 34.46%
Result and Discussion
29
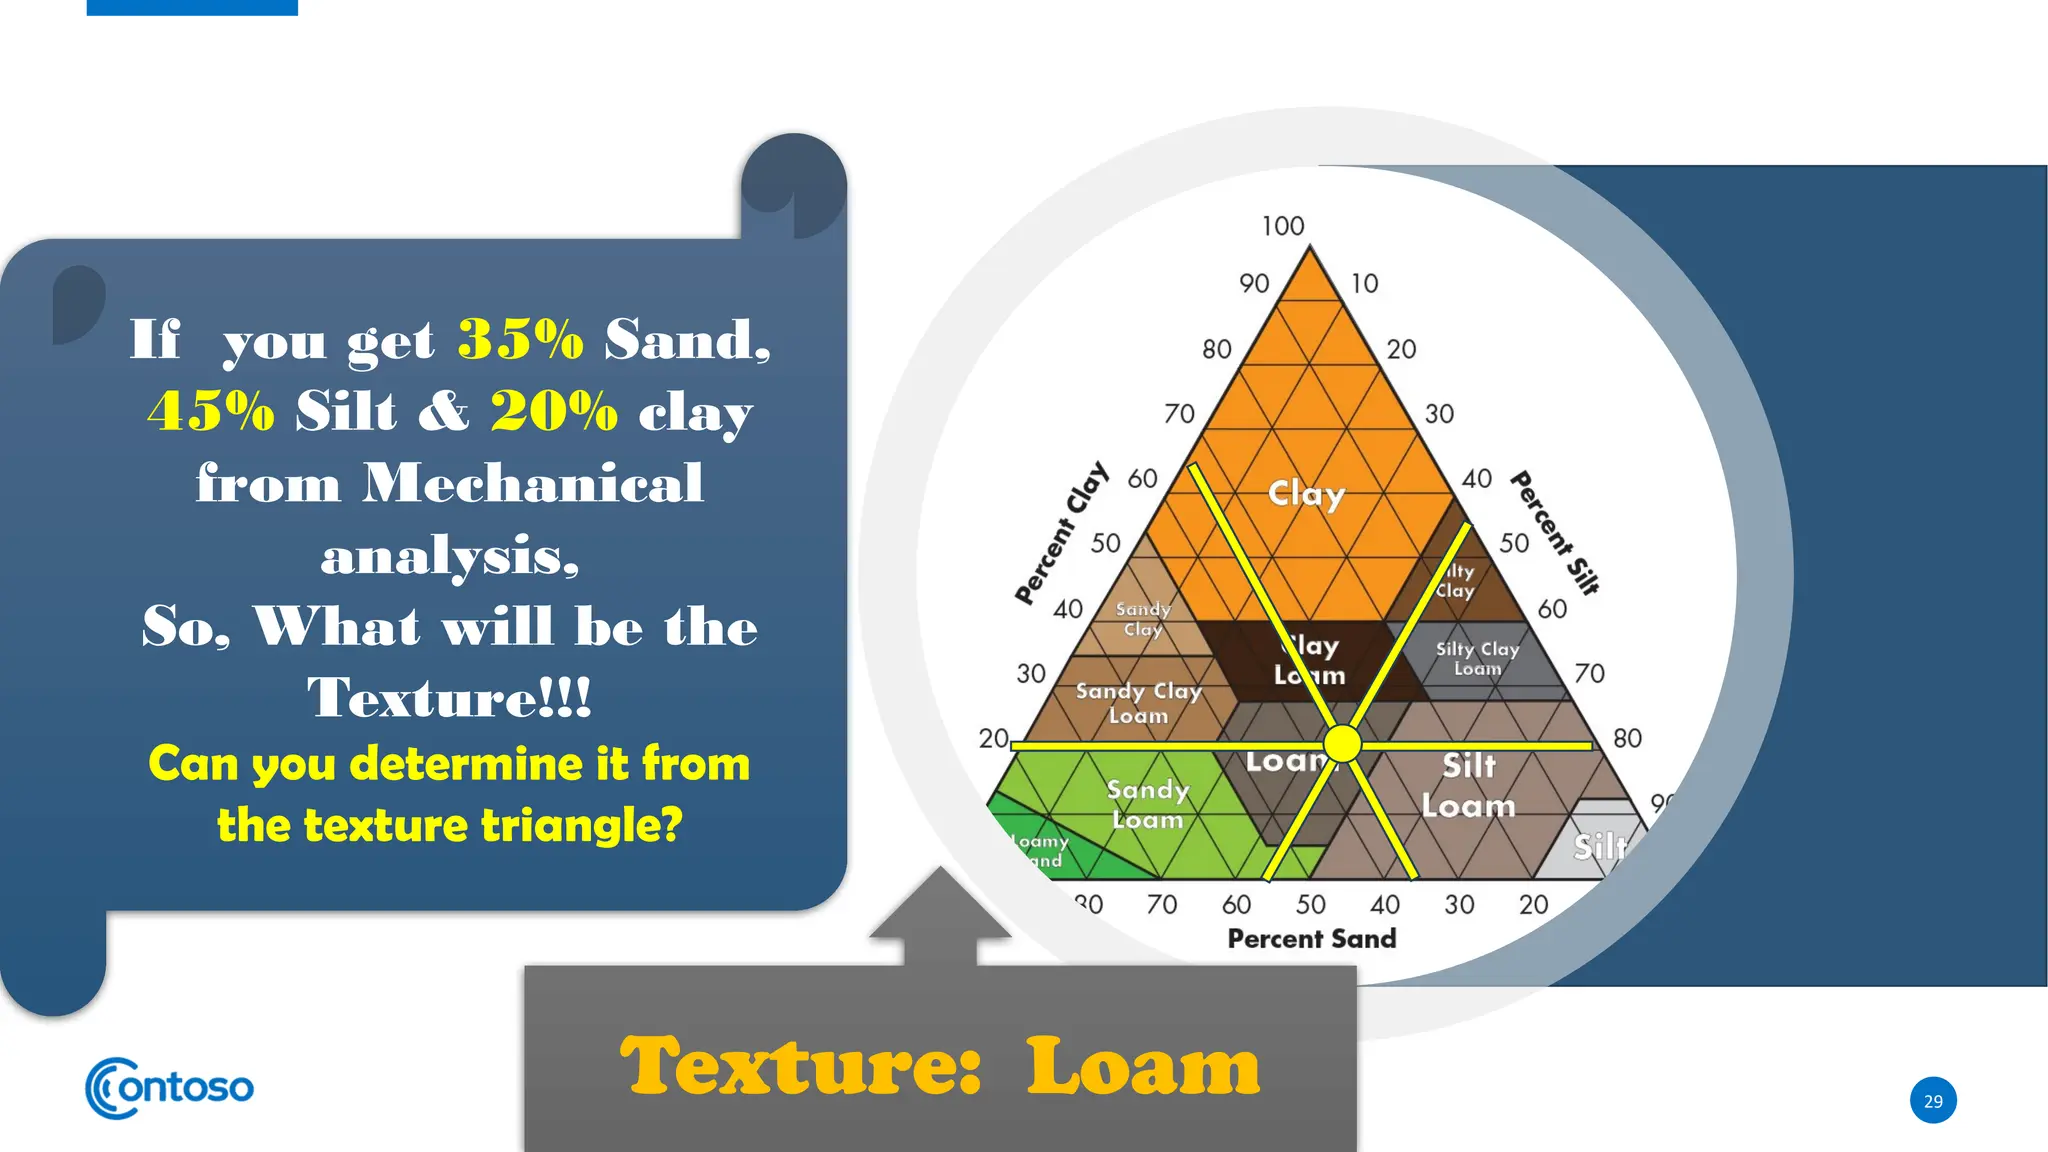
If you get35% Sand,
45% Silt & 20% clay
from Mechanical
analysis,
So, What will be the
Texture!!!
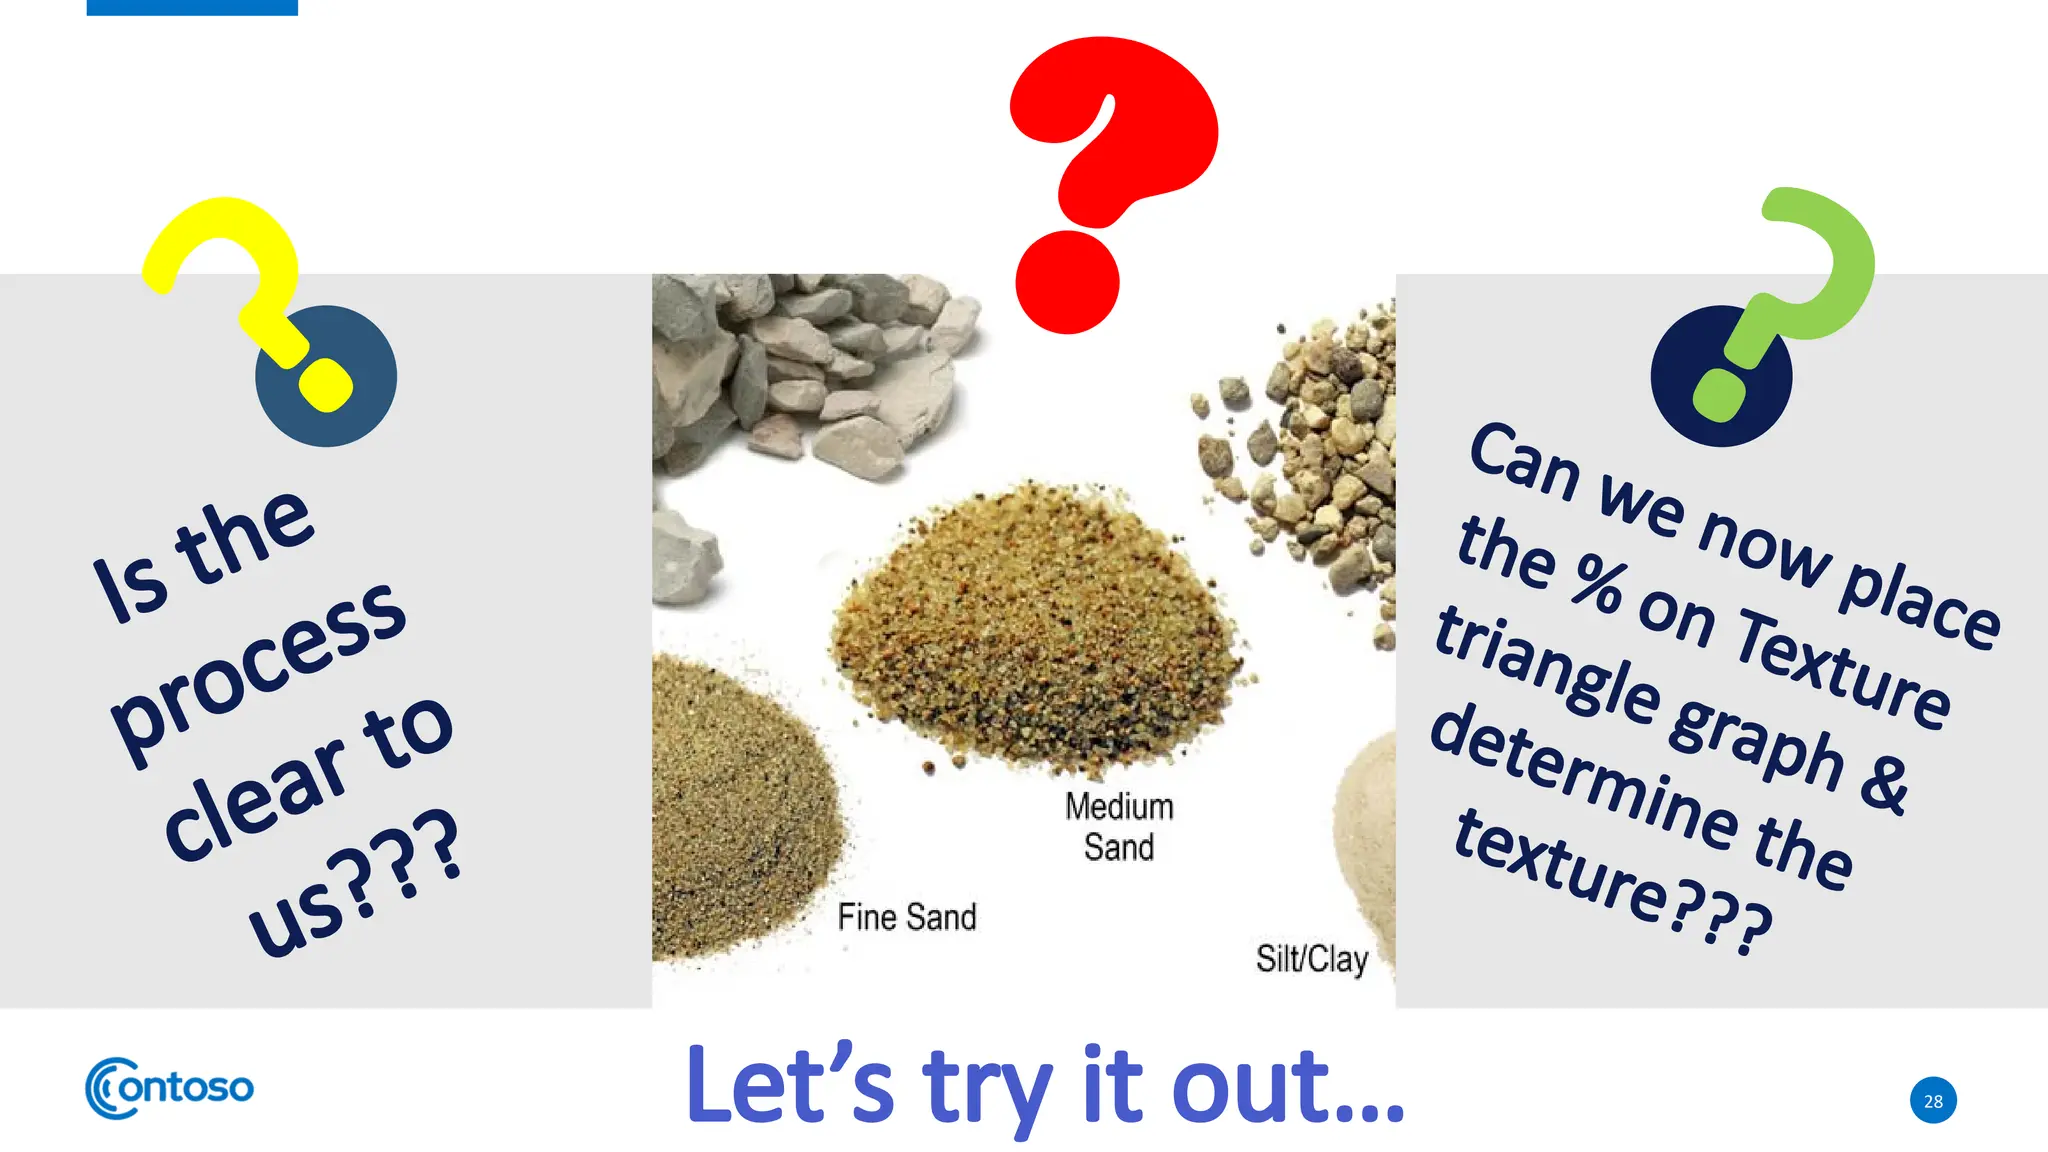
Can you determine it from
the texture triangle?
Texture: Loam
30.
30
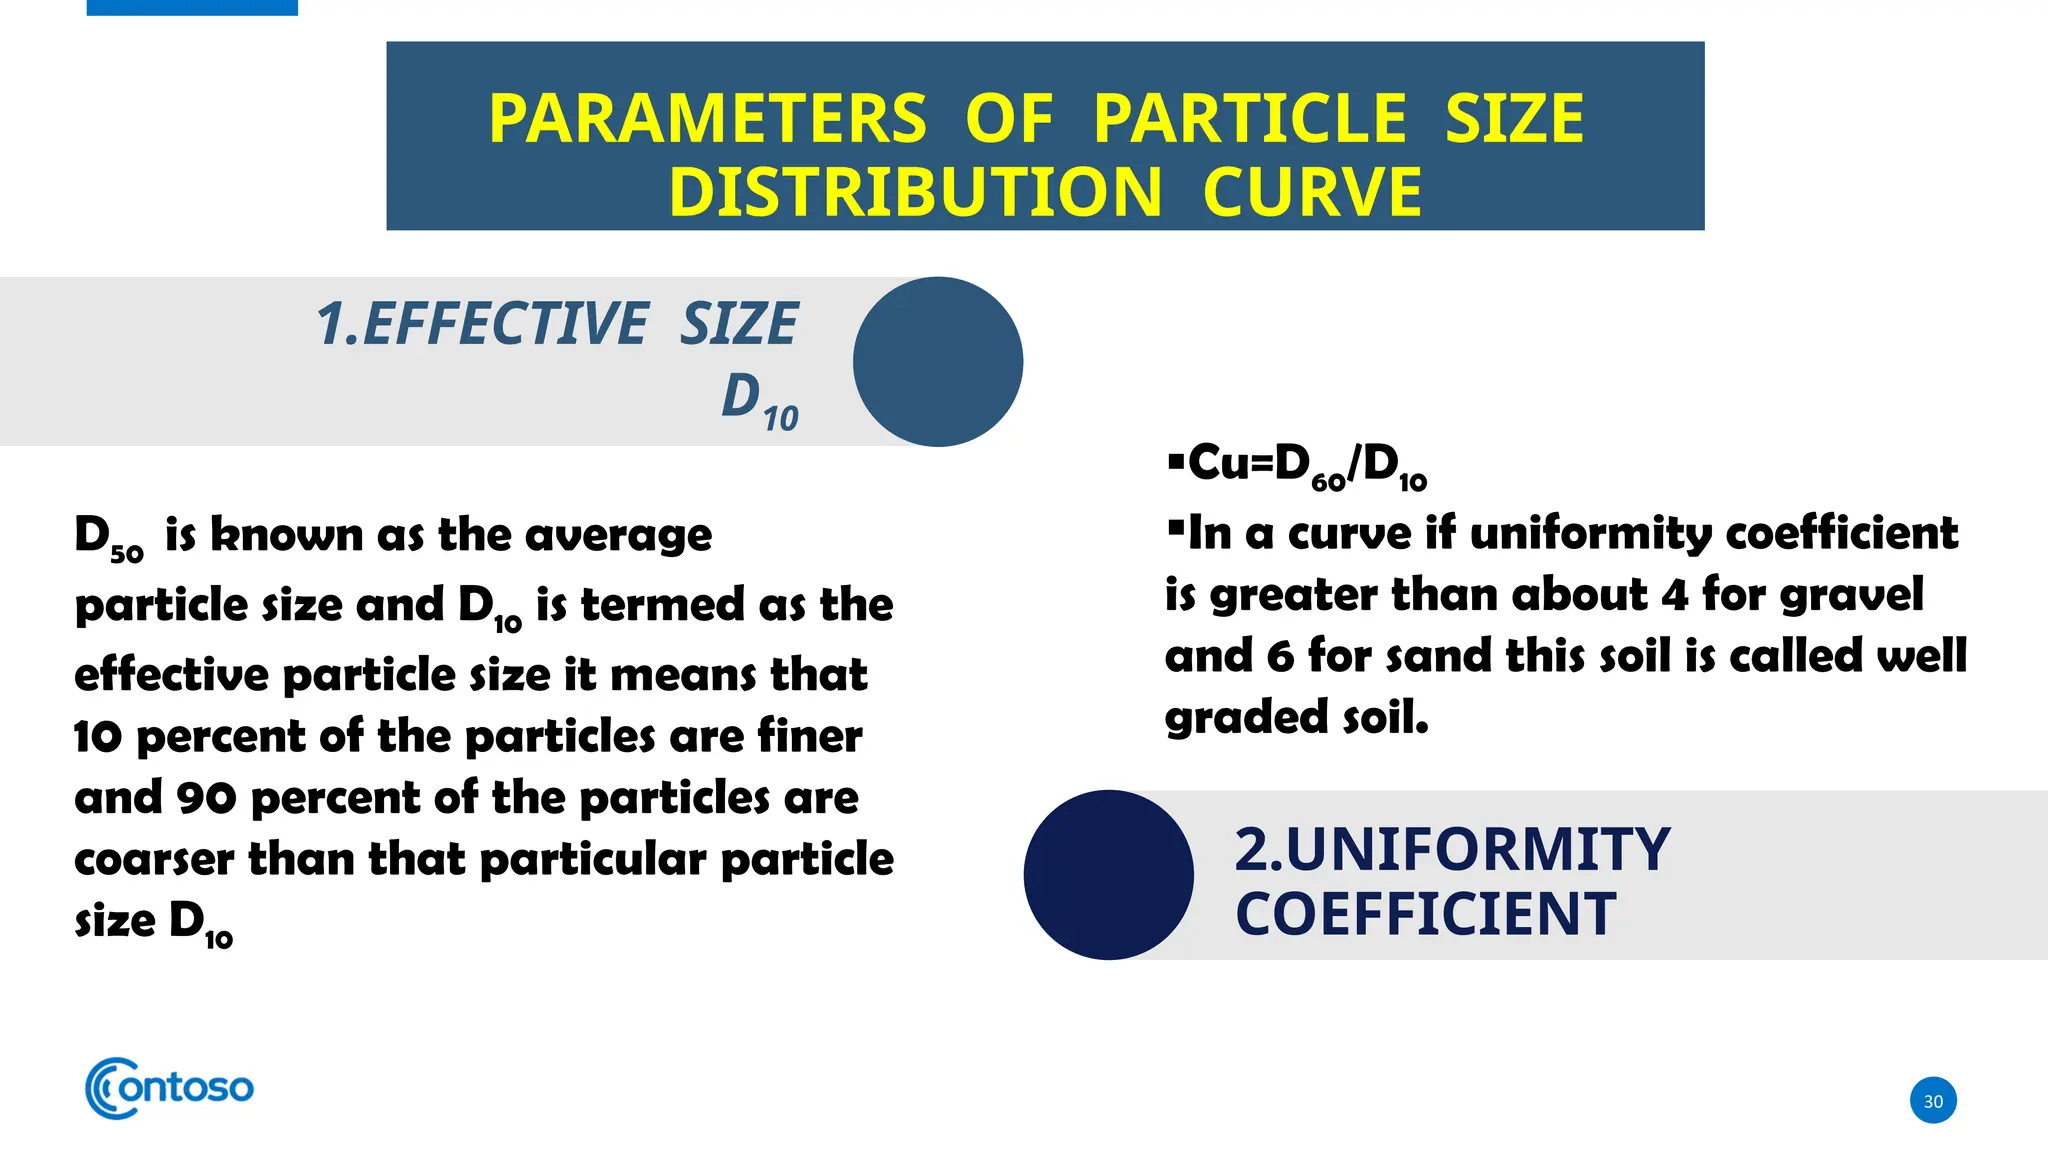
PARAMETERS OF PARTICLESIZE
DISTRIBUTION CURVE
1.EFFECTIVE SIZE
D10
2.UNIFORMITY
COEFFICIENT
D50 is known as the average
particle size and D10 is termed as the
effective particle size it means that
10 percent of the particles are finer
and 90 percent of the particles are
coarser than that particular particle
size D10
Cu=D60/D10
In a curve if uniformity coefficient
is greater than about 4 for gravel
and 6 for sand this soil is called well
graded soil.
31.
31
3. COEFFICIENT OFGRADATION
4. SORTING COEFFICIENT( SO)
The equation for this coefficient is,
Cc =[D30]2
/[(D60)(D10)]
If it ranges between 1 to 3( for
gravel and sands) in a curve so this
kind of soil is also called well
graded soil.
So=(D75/D25 )1/2
It is also a determinate for sorting
condition of soil.
PARAMETERS OF PARTICLE SIZE
DISTRIBUTION CURVE
32.
32
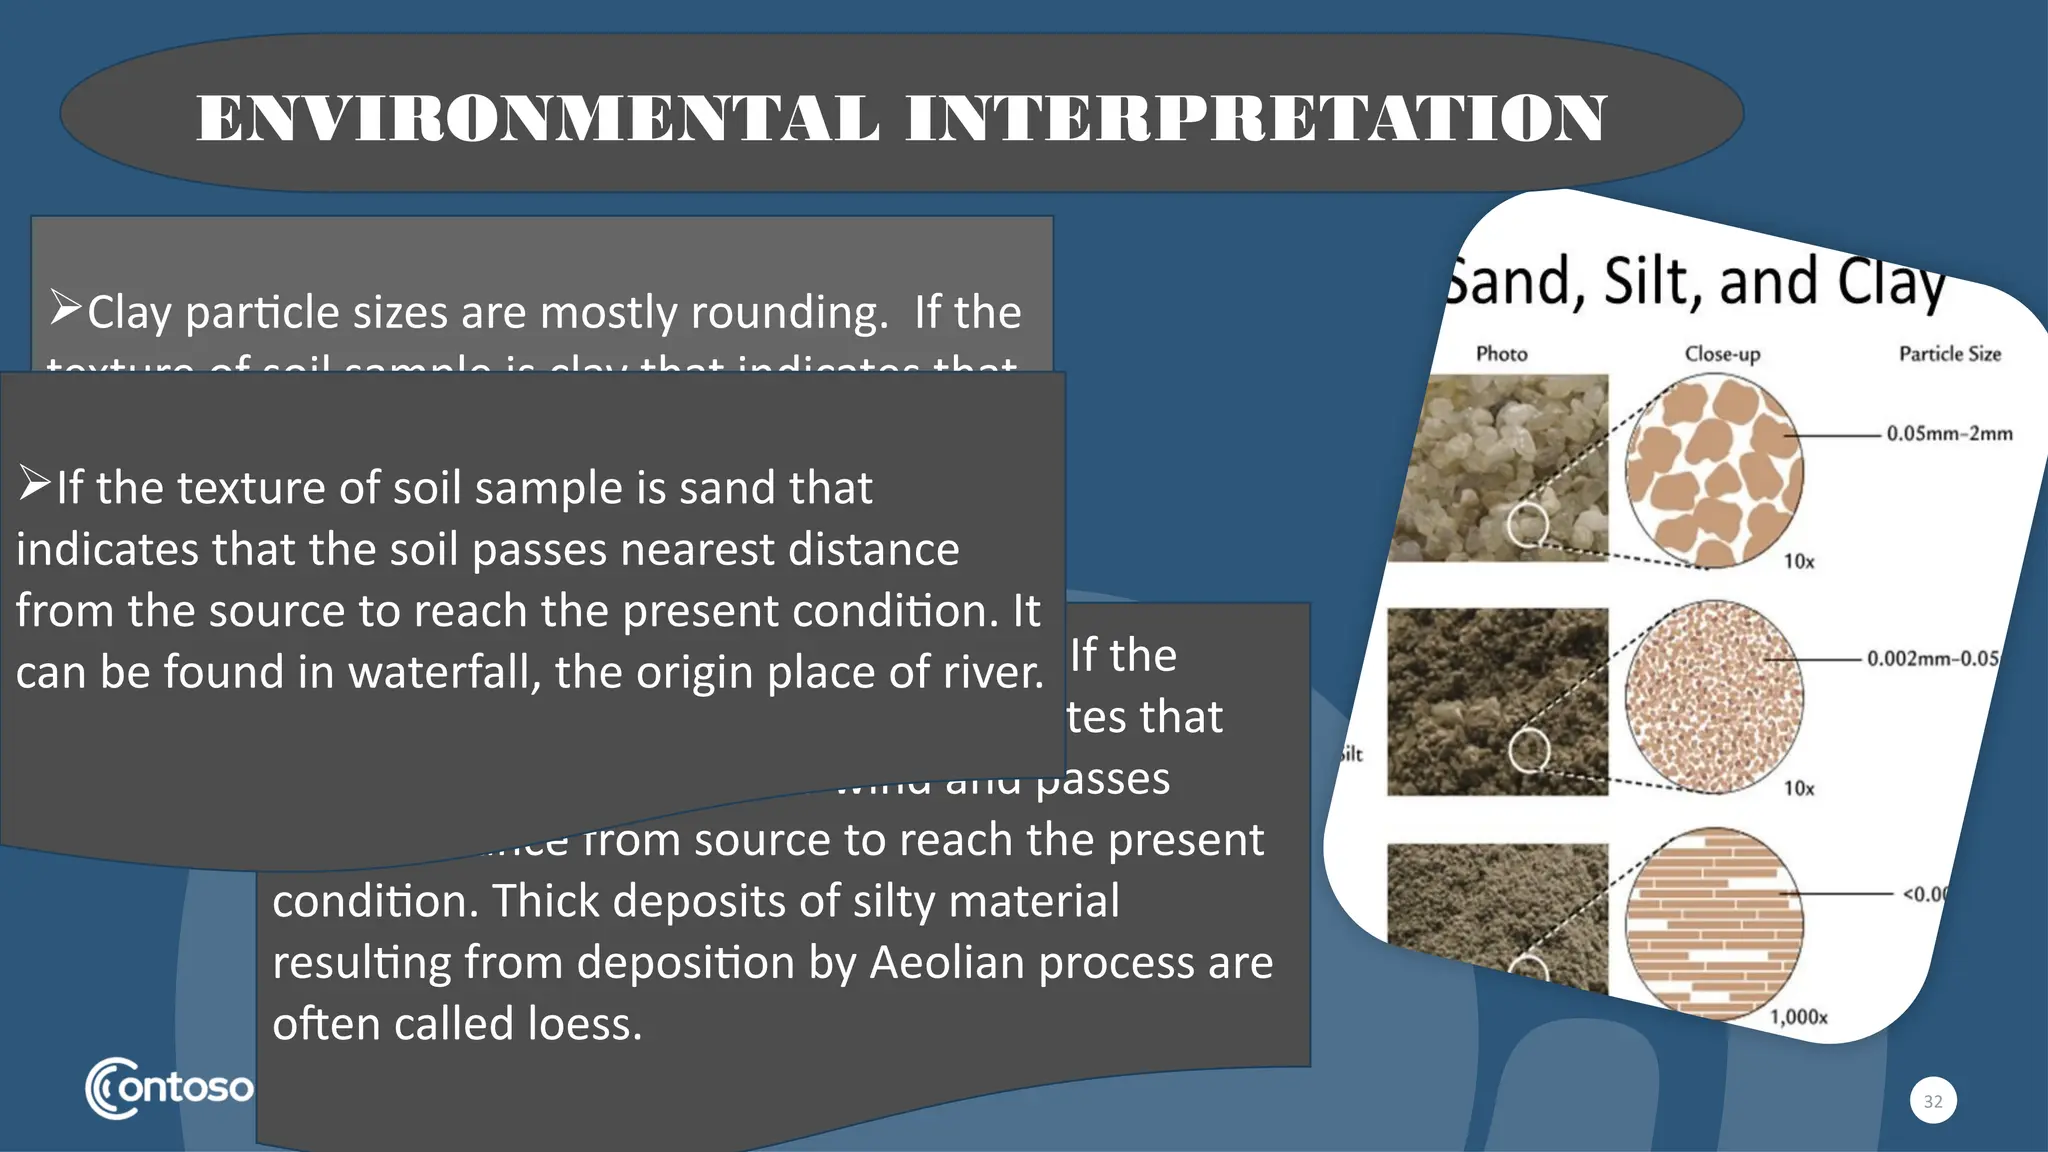
ENVIRONMENTAL INTERPRETATION
Clay particlesizes are mostly rounding. If the
texture of soil sample is clay that indicates that
the soil took so much time and long distance to
reach the present condition. It can be found in
river bank, beneath of inland water bodies.
Silt particles have a spherical shape. If the
texture of soil sample is silt that indicates that
the soils flow by stream or wind and passes
some distance from source to reach the present
condition. Thick deposits of silty material
resulting from deposition by Aeolian process are
often called loess.
If the texture of soil sample is sand that
indicates that the soil passes nearest distance
from the source to reach the present condition. It
can be found in waterfall, the origin place of river.
33.
33
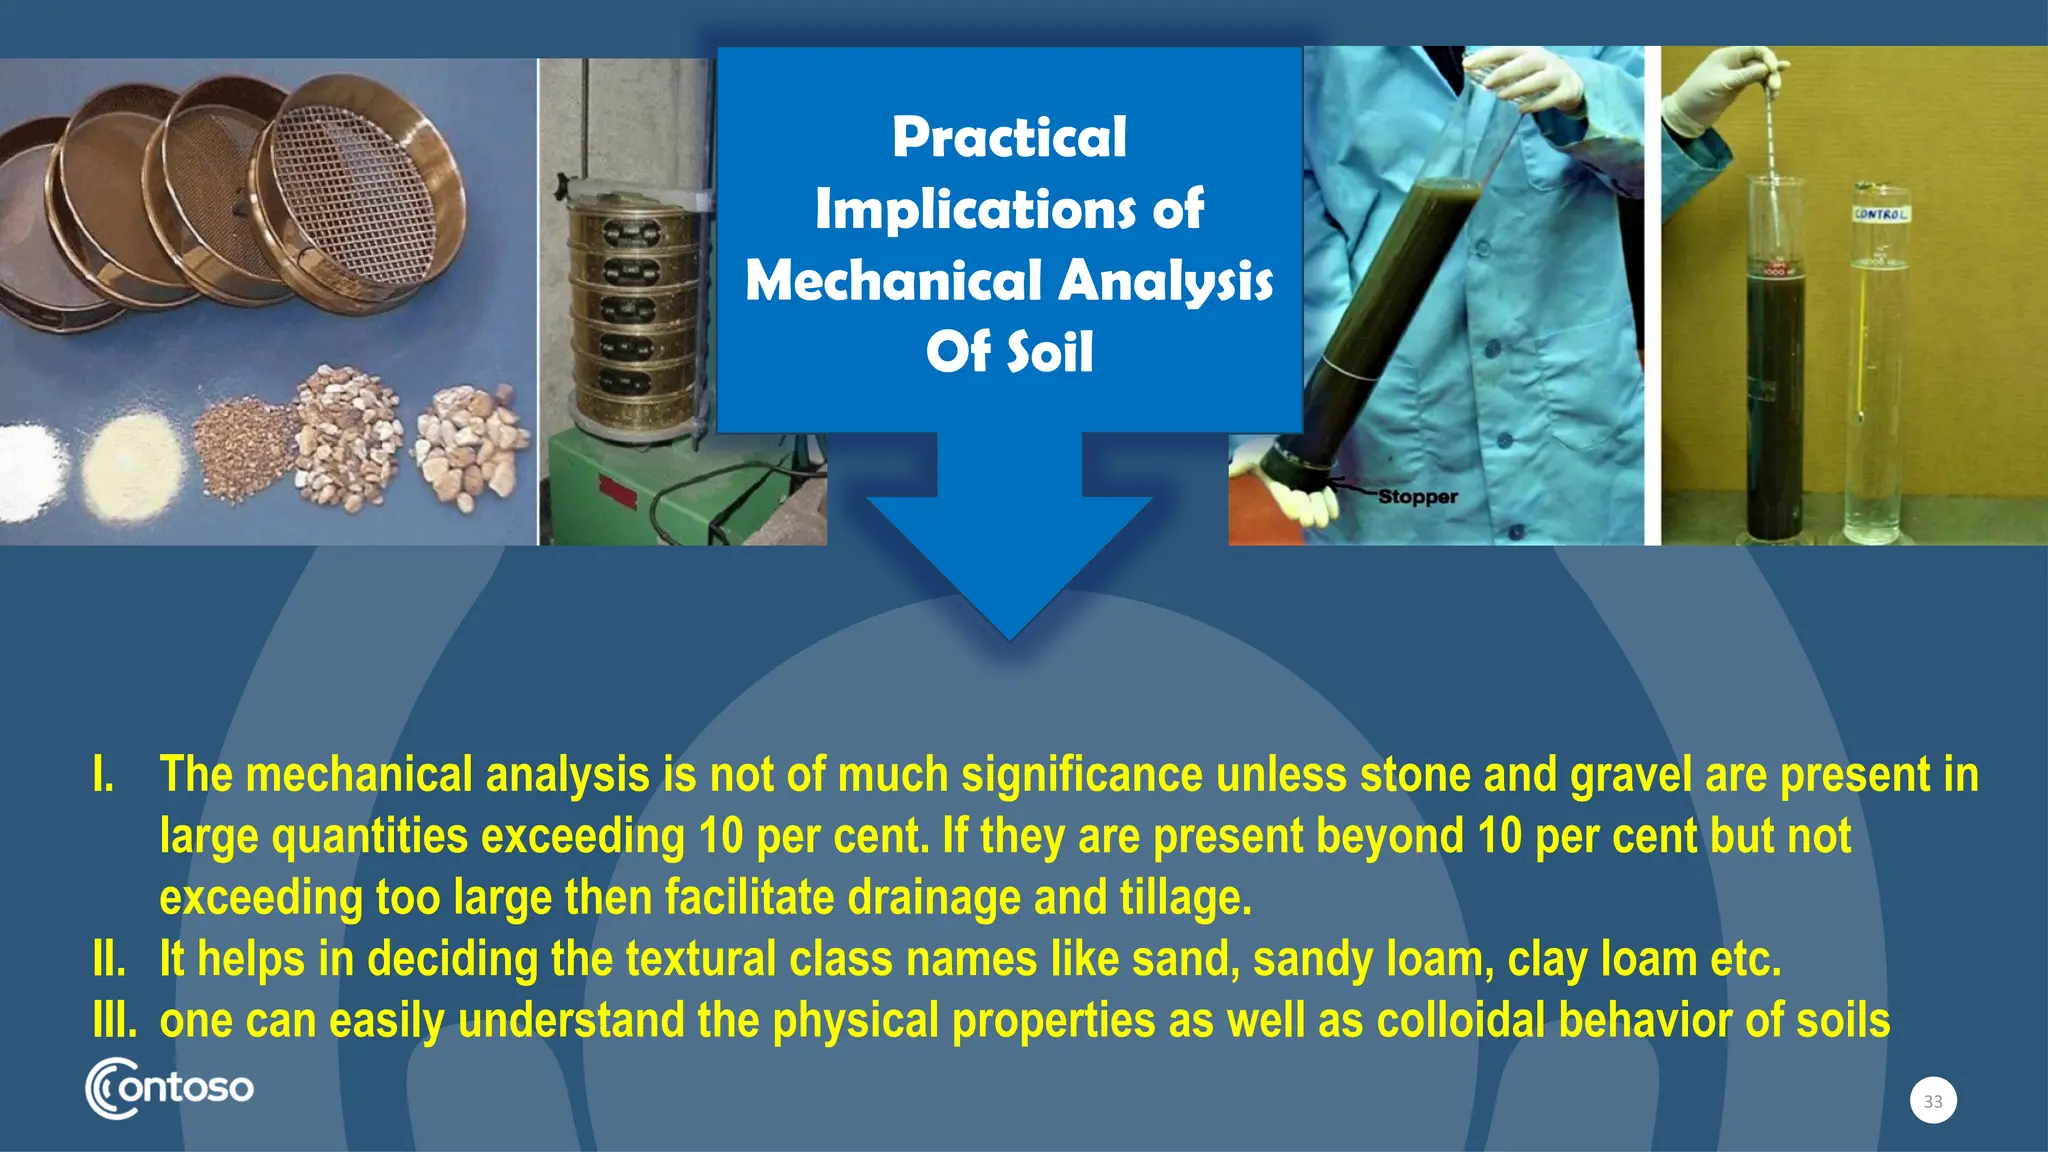
Practical
Implications of
Mechanical Analysis
OfSoil
I. The mechanical analysis is not of much significance unless stone and gravel are present in
large quantities exceeding 10 per cent. If they are present beyond 10 per cent but not
exceeding too large then facilitate drainage and tillage.
II. It helps in deciding the textural class names like sand, sandy loam, clay loam etc.
III. one can easily understand the physical properties as well as colloidal behavior of soils
34.
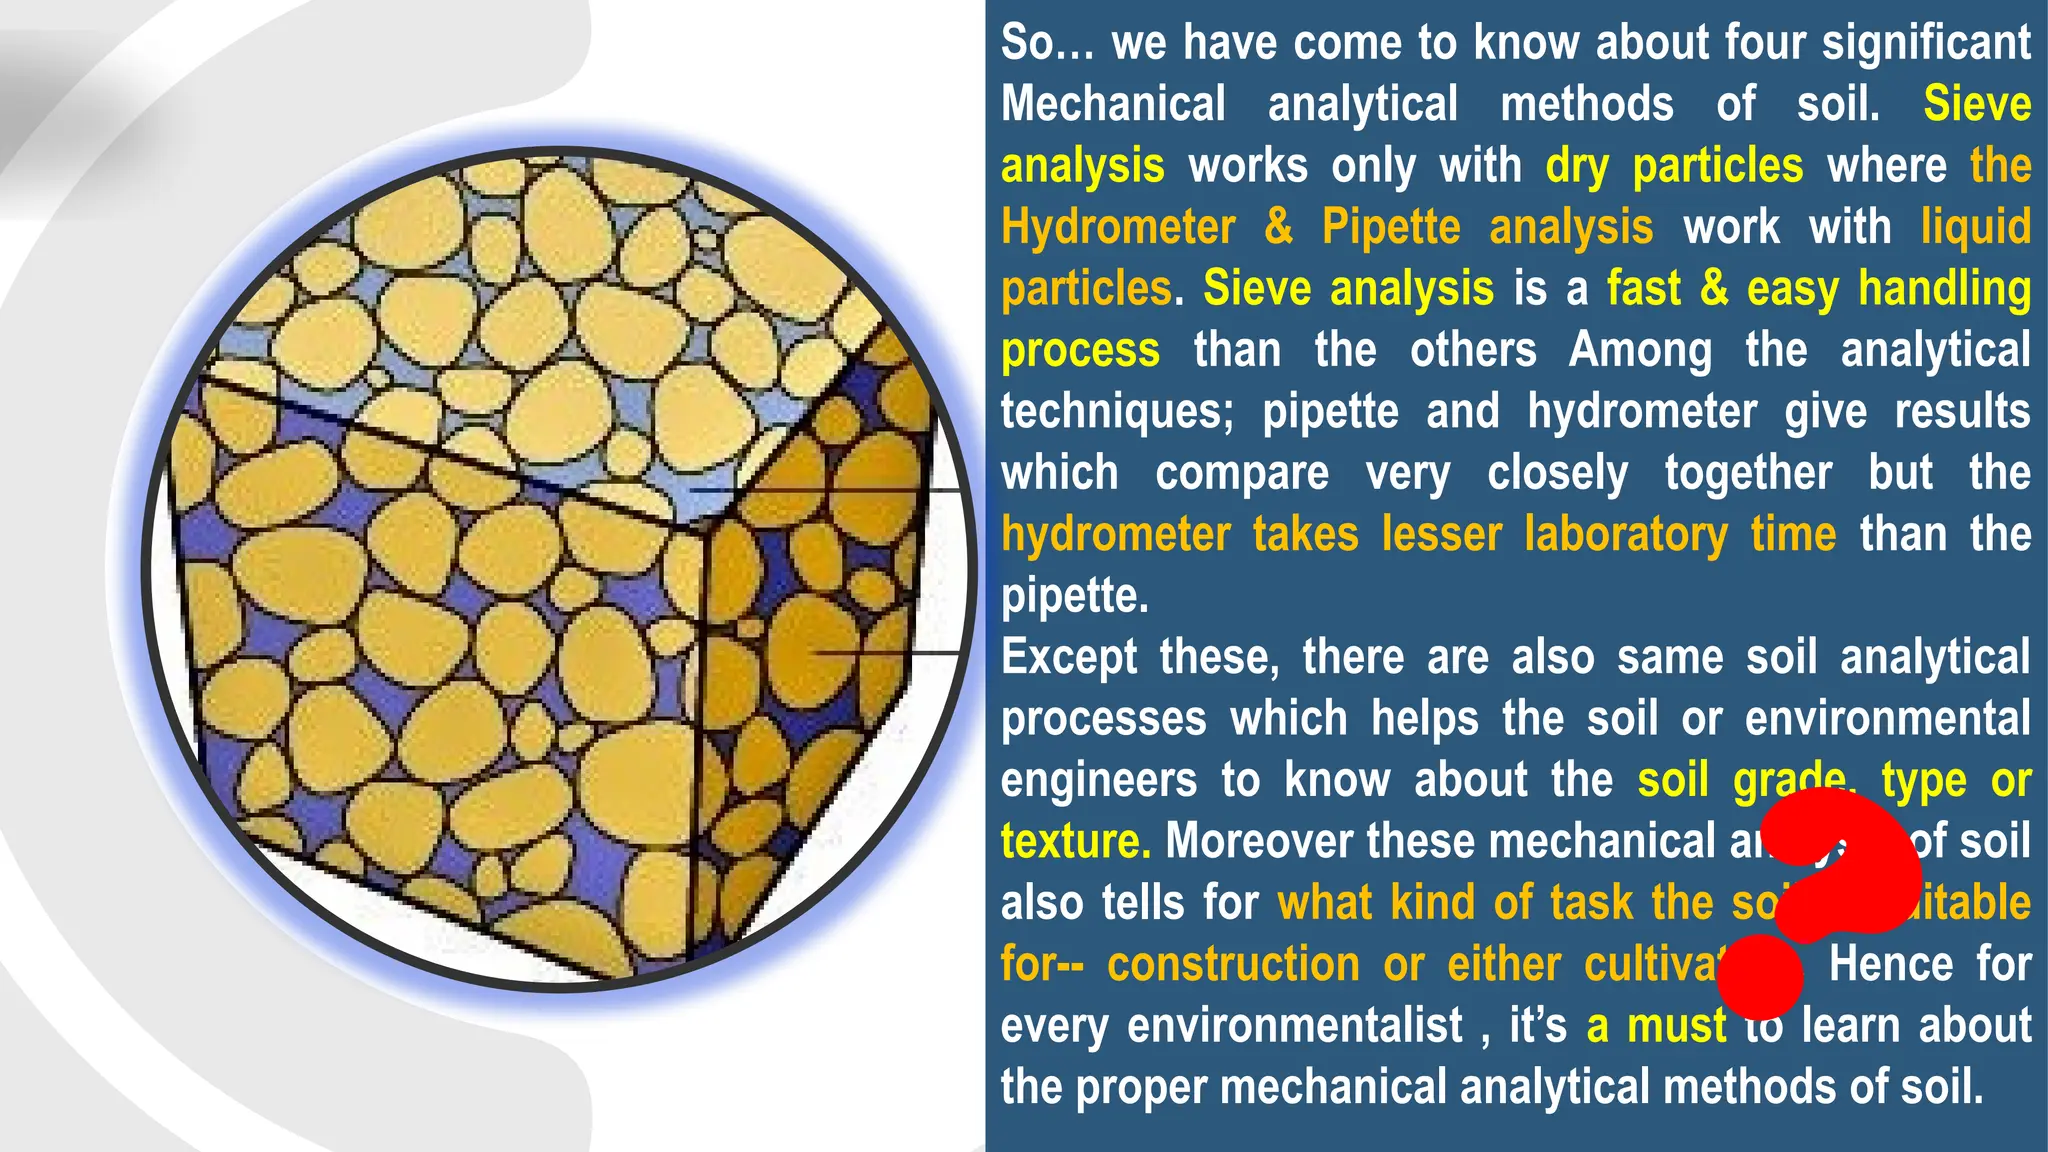
So… we havecome to know about four significant
Mechanical analytical methods of soil. Sieve
analysis works only with dry particles where the
Hydrometer & Pipette analysis work with liquid
particles. Sieve analysis is a fast & easy handling
process than the others Among the analytical
techniques; pipette and hydrometer give results
which compare very closely together but the
hydrometer takes lesser laboratory time than the
pipette.
Except these, there are also same soil analytical
processes which helps the soil or environmental
engineers to know about the soil grade, type or
texture. Moreover these mechanical analysis of soil
also tells for what kind of task the soil is suitable
for-- construction or either cultivation. Hence for
every environmentalist , it’s a must to learn about
the proper mechanical analytical methods of soil.
?
35.
35
SAIDA ISLAM SEJUTI
18103432
AMINABEGUM
18103431
RIFAT ARA SHUCHE
18103403
FATEMA KHAN TAMANNA
18103404
HAMIDA JANNAT
17103420
SABINA YASMIN ETI
18103440
Team Seekers


![31
3. COEFFICIENT OF GRADATION
4. SORTING COEFFICIENT( SO)
The equation for this coefficient is,
Cc =[D30]2
/[(D60)(D10)]
If it ranges between 1 to 3( for
gravel and sands) in a curve so this
kind of soil is also called well
graded soil.
So=(D75/D25 )1/2
It is also a determinate for sorting
condition of soil.
PARAMETERS OF PARTICLE SIZE
DISTRIBUTION CURVE](https://image.slidesharecdn.com/grp-1seekers-250225190251-637824a4/75/Group-ppt-on-Mechanical-Analysis-of-Soil-31-2048.jpg)


![Geotechnical Engineering-I [Lec #7: Sieve Analysis-2]](https://cdn.slidesharecdn.com/ss_thumbnails/7-180923180808-thumbnail.jpg?width=640&height=640&fit=bounds)


![Quaternary Geomorphology [ On Prospect of Bangladesh ]](https://cdn.slidesharecdn.com/ss_thumbnails/sejutiquaternarygeomorphologypresentation-250225183418-ae164047-thumbnail.jpg?width=640&height=640&fit=bounds)


