Topics to becovered
Grain size Analysis (Introduction)
Grain Size and Shapes
Methods to determine Grain size
Sieve Analysis
Hydrometer Analysis
3.
GRAIN SIZE
ANALYSIS
•Definition
• Grainsize analysis is an analytical technique typically conducted
within the earth sciences and implemented as a routine laboratory
study. Other disciplines, such as archaeology and geoarchaeology,
also use it regularly. It is a sedimentological analysis carried out in
order to determine the size of the different particles that
constitute a particular unconsolidated sedimentary deposit,
sedimentary rock,archaeological locus, or soil unit. The main goal
of this procedure is to determine the type of environment and
energy associated with the transport mechanism at the time of
deposition; this is done by inference from the sizes of the sediment
particles analyzed and their distributions
4.
• Granulometry isa basic analytical technique that
has wide applications within the earth and
archaeological sciences. Particle or grain size is a
fundamental attribute or physical property of
particulate samples or sediments and sedimentary
rocks (Folk, 1980; Friedman and Sanders, 1978).
Much can be said from analyzing not only the size
of clastic or detrital (inorganic), bioclastic (organic),
or chemical particles but also from the overall size
distribution, size fraction percentages, textural
maturity of the sediment or sorting, surface texture
attributes of a particle, and sphericity/angularity
and shape of a particle (Krumbein and Sloss, 1963;
Syvitsky, 2007). Several sediment, soil, or material
properties are directly influenced by the size of its
particles, as well as their shape (form, roundness
and surface texture or the grains) and fabric (grain-
to-grain interrelation and grain orientation), such
as texture and appearance, density, porosity, and
permeability.
5.
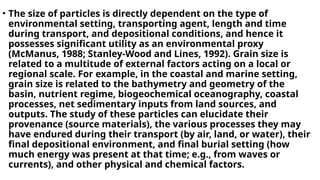
• The sizeof particles is directly dependent on the type of
environmental setting, transporting agent, length and time
during transport, and depositional conditions, and hence it
possesses significant utility as an environmental proxy
(McManus, 1988; Stanley-Wood and Lines, 1992). Grain size is
related to a multitude of external factors acting on a local or
regional scale. For example, in the coastal and marine setting,
grain size is related to the bathymetry and geometry of the
basin, nutrient regime, biogeochemical oceanography, coastal
processes, net sedimentary inputs from land sources, and
outputs. The study of these particles can elucidate their
provenance (source materials), the various processes they may
have endured during their transport (by air, land, or water), their
final depositional environment, and final burial setting (how
much energy was present at that time; e.g., from waves or
currents), and other physical and chemical factors.
6.
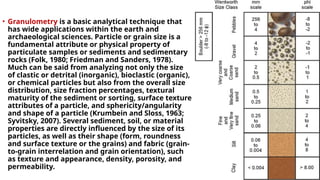
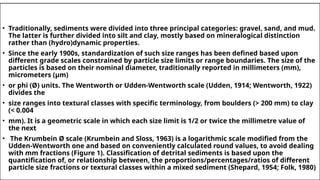
• Traditionally, sedimentswere divided into three principal categories: gravel, sand, and mud.
The latter is further divided into silt and clay, mostly based on mineralogical distinction
rather than (hydro)dynamic properties.
• Since the early 1900s, standardization of such size ranges has been defined based upon
different grade scales constrained by particle size limits or range boundaries. The size of the
particles is based on their nominal diameter, traditionally reported in millimeters (mm),
micrometers (µm)
• or phi (Ø) units. The Wentworth or Udden-Wentworth scale (Udden, 1914; Wentworth, 1922)
divides the
• size ranges into textural classes with specific terminology, from boulders (> 200 mm) to clay
(< 0.004
• mm). It is a geometric scale in which each size limit is 1/2 or twice the millimetre value of
the next
• The Krumbein Ø scale (Krumbein and Sloss, 1963) is a logarithmic scale modified from the
Udden-Wentworth one and based on conveniently calculated round values, to avoid dealing
with mm fractions (Figure 1). Classification of detrital sediments is based upon the
quantification of, or relationship between, the proportions/percentages/ratios of different
particle size fractions or textural classes within a mixed sediment (Shepard, 1954; Folk, 1980)
7.
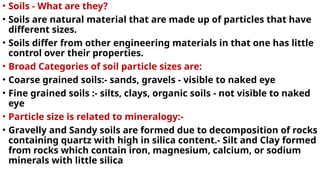
• Soils -What are they?
• Soils are natural material that are made up of particles that have
different sizes.
• Soils differ from other engineering materials in that one has little
control over their properties.
• Broad Categories of soil particle sizes are:
• Coarse grained soils:- sands, gravels - visible to naked eye
• Fine grained soils :- silts, clays, organic soils - not visible to naked
eye
• Particle size is related to mineralogy:-
• Gravelly and Sandy soils are formed due to decomposition of rocks
containing quartz with high in silica content.- Silt and Clay formed
from rocks which contain iron, magnesium, calcium, or sodium
minerals with little silica
8.
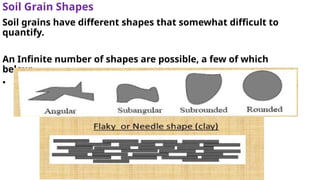
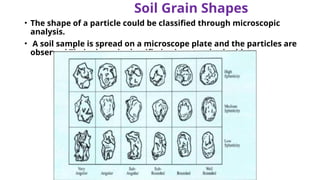
Soil Grain Shapes
Soilgrains have different shapes that somewhat difficult to
quantify.
An Infinite number of shapes are possible, a few of which
below:
• Bulky (sands and gravel)
9.
Soil Grain Shapes
•The shape of a particle could be classified through microscopic
analysis.
• A soil sample is spread on a microscope plate and the particles are
observed.Their shape is classified using standard tables.
10.
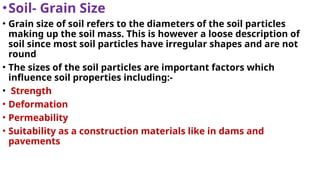
•Soil- Grain Size
•Grain size of soil refers to the diameters of the soil particles
making up the soil mass. This is however a loose description of
soil since most soil particles have irregular shapes and are not
round
• The sizes of the soil particles are important factors which
influence soil properties including:-
• Strength
• Deformation
• Permeability
• Suitability as a construction materials like in dams and
pavements
11.
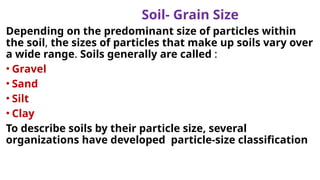
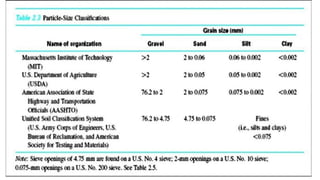
Soil- Grain Size
Dependingon the predominant size of particles within
the soil, the sizes of particles that make up soils vary over
a wide range. Soils generally are called :
• Gravel
• Sand
• Silt
• Clay
To describe soils by their particle size, several
organizations have developed particle-size classification
14.
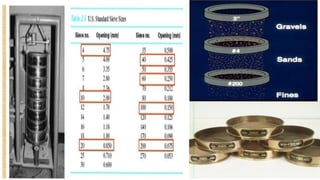
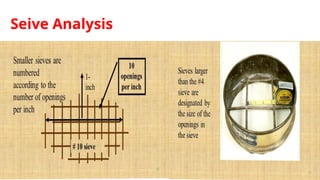
Methods to determineGrain Size
Sieving analysis
Sieving is the most basic of the particle sizing techniques. It consists of
having the sediment pass through (by agitation) a series of stacked sieve
meshes with defined opening sizes. Each sieve catches
the size fraction that is larger than its mesh size, so that the successive
sieves break up the sample into decreasing size fractions. The sediment
fraction retained in each sieve is weighed in order to obtain its percentage
relative to the whole sample. This technique can be used under dry or wet
conditions.
The advantages of sieving are that it is cheap and user friendly, useful when
dealing with very coarse
samples and the physical separation of the sample is the end result. Its
limitations are its low resolution
and precision, that dry particles smaller than 50 µm or cohesive materials
are very difficult to separate
using this technique, and that results are influenced by the operator and
the duration of agitation/shaking
used, i.e., the technique itself (Folk, 1980; Krumbein and Sloss, 1963).
15.
• Sedimentation orsettling
• Sedimentation is the oldest of the techniques used in particle size analysis. It measures
the rate of sedimentation of particles suspended in a liquid. Its advantages include its
relatively low cost, and its ease of applicability to soils or very fine sediments (for which it
is the traditional method). Its limitations are that it is useful only for a limited range of
particle sizes, that it is not useful for sediment < 5 µm, and that it is extremely sensitive
to particle shape (geometry) (Jennings and Parslow, 1988; Stanley-Wood and Lines, 1992).
• Laser diffraction
• Laser diffraction measures the angular dependence of laser light scattered by an
ensemble of particles. Its advantages are that it can handle a very wide range of particle
sizes (from < 100 nm to ~ 2–3 mm), that measurements can be made rapidly and thus
large numbers of samples can be processed, and that results are accurate and
repeatable (Syvitski, 2007).Laser diffraction measurements provide particle size
distributions with great detail. This enhancement in technical size measurement has
greatly improved the ability to differentiate and compare different environments, and
sometimes even better understand their dynamics.When using a laser diffraction particle
size analyzer, sediment can be run dry or wet. If wet, however, it is advised to pour out as
much water as possible from the container to minimize errors. In either case,
homogenizing and dispersing the sample prior to insertion into the machine is always a
must, in order to analyze a truly representative portion of the sampl
16.
• Dynamic lightscattering
Dynamic light scattering measures scattered light intensity variations
due to Brownian motion of particles in suspension within a liquid. Its
advantages are that its dynamic range is well suited to nano-materials
(< 1 nm to 1 µm), its measurement speed is rapid so that it can handle
larger numbers of samples, and its results are accurate and
repeatable. Its limitations include the inability to analyze dense
materials, and its medium resolution (Syvitski, 2007
17.
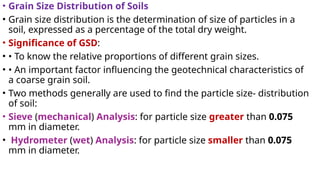
• Grain SizeDistribution of Soils
• Grain size distribution is the determination of size of particles in a
soil, expressed as a percentage of the total dry weight.
• Significance of GSD:
• • To know the relative proportions of different grain sizes.
• • An important factor influencing the geotechnical characteristics of
a coarse grain soil.
• Two methods generally are used to find the particle size- distribution
of soil:
• Sieve (mechanical) Analysis: for particle size greater than 0.075
mm in diameter.
• Hydrometer (wet) Analysis: for particle size smaller than 0.075
mm in diameter.
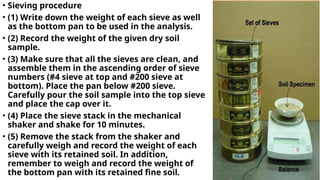
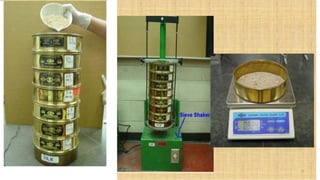
• Sieving procedure
•(1) Write down the weight of each sieve as well
as the bottom pan to be used in the analysis.
• (2) Record the weight of the given dry soil
sample.
• (3) Make sure that all the sieves are clean, and
assemble them in the ascending order of sieve
numbers (#4 sieve at top and #200 sieve at
bottom). Place the pan below #200 sieve.
Carefully pour the soil sample into the top sieve
and place the cap over it.
• (4) Place the sieve stack in the mechanical
shaker and shake for 10 minutes.
• (5) Remove the stack from the shaker and
carefully weigh and record the weight of each
sieve with its retained soil. In addition,
remember to weigh and record the weight of
the bottom pan with its retained fine soil.
22.
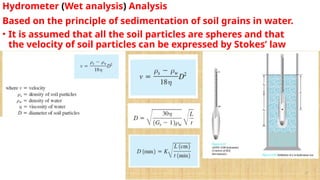
Hydrometer (Wet analysis)Analysis
Based on the principle of sedimentation of soil grains in water.
• It is assumed that all the soil particles are spheres and that
the velocity of soil particles can be expressed by Stokes’ law
23.
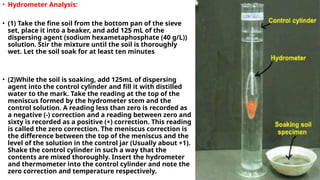
• Hydrometer Analysis:
•(1) Take the fine soil from the bottom pan of the sieve
set, place it into a beaker, and add 125 mL of the
dispersing agent (sodium hexametaphosphate (40 g/L))
solution. Stir the mixture until the soil is thoroughly
wet. Let the soil soak for at least ten minutes
• (2)While the soil is soaking, add 125mL of dispersing
agent into the control cylinder and fill it with distilled
water to the mark. Take the reading at the top of the
meniscus formed by the hydrometer stem and the
control solution. A reading less than zero is recorded as
a negative (-) correction and a reading between zero and
sixty is recorded as a positive (+) correction. This reading
is called the zero correction. The meniscus correction is
the difference between the top of the meniscus and the
level of the solution in the control jar (Usually about +1).
Shake the control cylinder in such a way that the
contents are mixed thoroughly. Insert the hydrometer
and thermometer into the control cylinder and note the
zero correction and temperature respectively.
24.
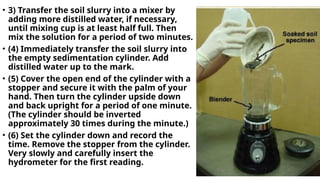
• 3) Transferthe soil slurry into a mixer by
adding more distilled water, if necessary,
until mixing cup is at least half full. Then
mix the solution for a period of two minutes.
• (4) Immediately transfer the soil slurry into
the empty sedimentation cylinder. Add
distilled water up to the mark.
• (5) Cover the open end of the cylinder with a
stopper and secure it with the palm of your
hand. Then turn the cylinder upside down
and back upright for a period of one minute.
(The cylinder should be inverted
approximately 30 times during the minute.)
• (6) Set the cylinder down and record the
time. Remove the stopper from the cylinder.
Very slowly and carefully insert the
hydrometer for the first reading.
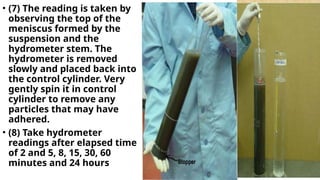
25.
• (7) Thereading is taken by
observing the top of the
meniscus formed by the
suspension and the
hydrometer stem. The
hydrometer is removed
slowly and placed back into
the control cylinder. Very
gently spin it in control
cylinder to remove any
particles that may have
adhered.
• (8) Take hydrometer
readings after elapsed time
of 2 and 5, 8, 15, 30, 60
minutes and 24 hours
26.
• Reference
• www.geoengineering.com
•http//uta.pressbook.pub
• www.researchgate.net
.https//geologyistheway.com
Gloria I. López
Luminescence Dating Laboratory, Centro Nacional de
Investigación sobre la Evolución Humana CENIEH,
Burgos, 09002, Spain
Leon Recanati Institute for Maritime Studies RIMS, University of
Haifa, Haifa, Israe


![THE SEDIMENTARY TEXTURE [ONLY GRAIN SIZES]](https://cdn.slidesharecdn.com/ss_thumbnails/mynameisdeo-240810105647-b5d3f5dc-thumbnail.jpg?width=640&height=640&fit=bounds)


