From the audience survey results, the following key points were found:
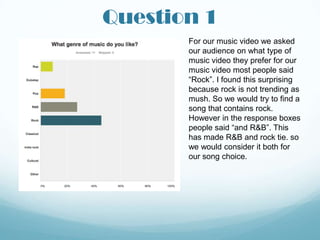
- For music genre, rock and R&B tied as the most preferred options.
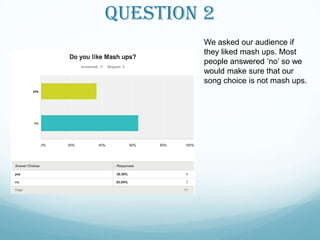
- Mash-ups were not a preferred song choice.
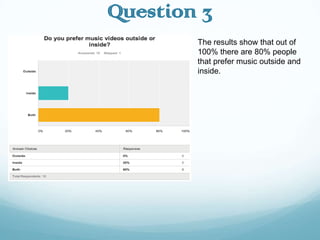
- Most people preferred having music videos filmed both outside and inside.
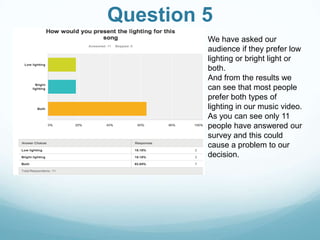
- There was a preference for using both bright and low lighting in videos.
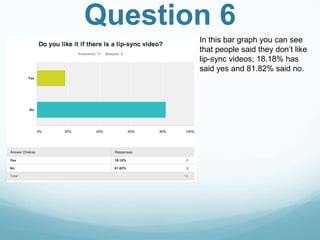
- Lip-sync videos were not popular according to the survey results.
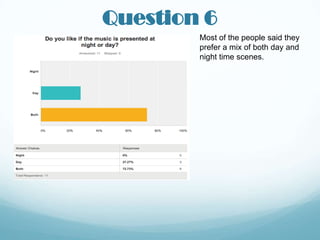
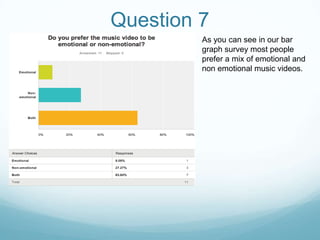
- Respondents indicated a preference for music videos that incorporated both day and night scenes as well as emotional and non-emotional elements.
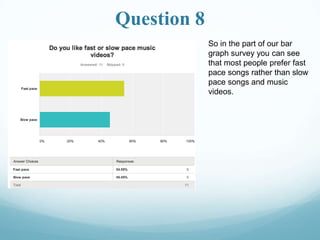
- Fast-paced songs were favored over slow songs for music videos.