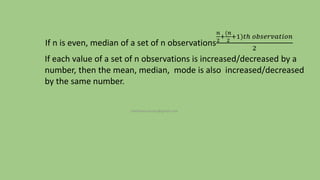
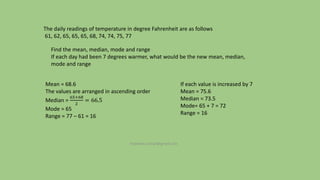
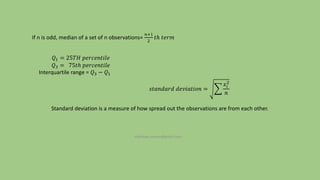
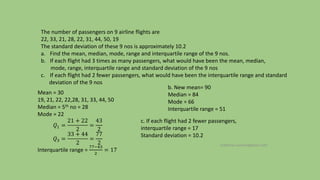
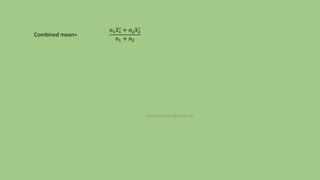
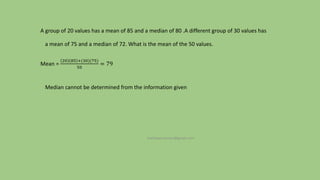
GRE QUANT
STATISTICS
mathews.suman@gmail.com
If n is even, median of a set of n observations
𝑛
2
+
(𝑛
2
+1)𝑡ℎ 𝑜𝑏𝑠𝑒𝑟𝑣𝑎𝑡𝑖𝑜𝑛
2
If each value of a set of n observations is increased/decreased by a
number, then the mean, median, mode is also increased/decreased
by the same number.
mathews.suman@gmail.com
The daily readings of temperature in degree Fahrenheit are as follows
61, 62, 65, 65, 65, 68, 74, 74, 75, 77
Find the mean, median, mode and range
If each day had been 7 degrees warmer, what would be the new mean, median,
mode and range
Mean = 68.6
The values are arranged in ascending order
Median =
65+68
2
= 66.5
Mode = 65
Range = 77 – 61 = 16
If each value is increased by 7
Mean = 75.6
Median = 73.5
Mode= 65 + 7 = 72
Range = 16
mathews.suman@gmail.com
If n is odd, median of a set of n observations=
𝑛+1
2
𝑡ℎ 𝑡𝑒𝑟𝑚
𝑄1 = 25𝑇𝐻 𝑝𝑒𝑟𝑐𝑒𝑛𝑡𝑖𝑙𝑒
𝑄3 = 75𝑡ℎ 𝑝𝑒𝑟𝑐𝑒𝑛𝑡𝑖𝑙𝑒
Interquartile range = 𝑄3 − 𝑄1
𝑠𝑡𝑎𝑛𝑑𝑎𝑟𝑑 𝑑𝑒𝑣𝑖𝑎𝑡𝑖𝑜𝑛 =
𝑥𝑖
2
𝑛
Standard deviation is a measure of how spread out the observations are from each other.
mathews.suman@gmail.com
The number of passengers on 9 airline flights are
22, 33, 21, 28, 22, 31, 44, 50, 19
The standard deviation of these 9 nos is approximately 10.2
a. Find the mean, median, mode, range and interquartile range of the 9 nos.
b. If each flight had 3 times as many passengers, what would have been the mean, median,
mode, range, interquartile range and standard deviation of the 9 nos
c. If each flight had 2 fewer passengers, what would have been the interquartile range and standard
deviation of the 9 nos
Mean = 30
19, 21, 22, 22,28, 31, 33, 44, 50
Median = 5th no = 28
Mode = 22
𝑄1 =
21 + 22
2
=
43
2
𝑄3 =
33 + 44
2
=
77
2
Interquartile range =
77−43
2
= 17
b. New mean= 90
Median = 84
Mode = 66
Interquartile range = 51
c. If each flight had 2 fewer passengers,
interquartile range = 17
Standard deviation = 10.2
mathews.suman@gmail.com
Combined mean=
𝑛1 𝑥1 + 𝑛2 𝑥2
𝑛1 + 𝑛2
mathews.suman@gmail.com
A group of 20 values has a mean of 85 and a median of 80 .A different group of 30 values has
a mean of 75 and a median of 72. What is the mean of the 50 values.
Mean =
20 85 +(30)(75)
50
= 79
Median cannot be determined from the information given
mathews.suman@gmail.com

Gre statistics

  • 1.
  • 2.
    If n iseven, median of a set of n observations 𝑛 2 + (𝑛 2 +1)𝑡ℎ 𝑜𝑏𝑠𝑒𝑟𝑣𝑎𝑡𝑖𝑜𝑛 2 If each value of a set of n observations is increased/decreased by a number, then the mean, median, mode is also increased/decreased by the same number. mathews.suman@gmail.com
  • 3.
    The daily readingsof temperature in degree Fahrenheit are as follows 61, 62, 65, 65, 65, 68, 74, 74, 75, 77 Find the mean, median, mode and range If each day had been 7 degrees warmer, what would be the new mean, median, mode and range Mean = 68.6 The values are arranged in ascending order Median = 65+68 2 = 66.5 Mode = 65 Range = 77 – 61 = 16 If each value is increased by 7 Mean = 75.6 Median = 73.5 Mode= 65 + 7 = 72 Range = 16 mathews.suman@gmail.com
  • 4.
    If n isodd, median of a set of n observations= 𝑛+1 2 𝑡ℎ 𝑡𝑒𝑟𝑚 𝑄1 = 25𝑇𝐻 𝑝𝑒𝑟𝑐𝑒𝑛𝑡𝑖𝑙𝑒 𝑄3 = 75𝑡ℎ 𝑝𝑒𝑟𝑐𝑒𝑛𝑡𝑖𝑙𝑒 Interquartile range = 𝑄3 − 𝑄1 𝑠𝑡𝑎𝑛𝑑𝑎𝑟𝑑 𝑑𝑒𝑣𝑖𝑎𝑡𝑖𝑜𝑛 = 𝑥𝑖 2 𝑛 Standard deviation is a measure of how spread out the observations are from each other. mathews.suman@gmail.com
  • 5.
    The number ofpassengers on 9 airline flights are 22, 33, 21, 28, 22, 31, 44, 50, 19 The standard deviation of these 9 nos is approximately 10.2 a. Find the mean, median, mode, range and interquartile range of the 9 nos. b. If each flight had 3 times as many passengers, what would have been the mean, median, mode, range, interquartile range and standard deviation of the 9 nos c. If each flight had 2 fewer passengers, what would have been the interquartile range and standard deviation of the 9 nos Mean = 30 19, 21, 22, 22,28, 31, 33, 44, 50 Median = 5th no = 28 Mode = 22 𝑄1 = 21 + 22 2 = 43 2 𝑄3 = 33 + 44 2 = 77 2 Interquartile range = 77−43 2 = 17 b. New mean= 90 Median = 84 Mode = 66 Interquartile range = 51 c. If each flight had 2 fewer passengers, interquartile range = 17 Standard deviation = 10.2 mathews.suman@gmail.com
  • 6.
    Combined mean= 𝑛1 𝑥1+ 𝑛2 𝑥2 𝑛1 + 𝑛2 mathews.suman@gmail.com
  • 7.
    A group of20 values has a mean of 85 and a median of 80 .A different group of 30 values has a mean of 75 and a median of 72. What is the mean of the 50 values. Mean = 20 85 +(30)(75) 50 = 79 Median cannot be determined from the information given mathews.suman@gmail.com