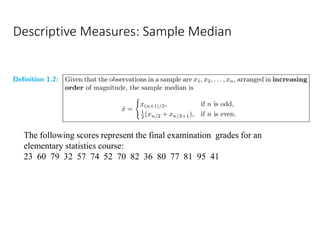
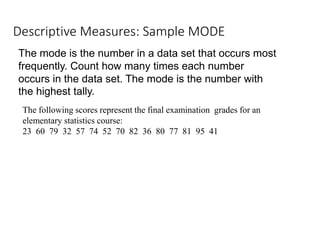
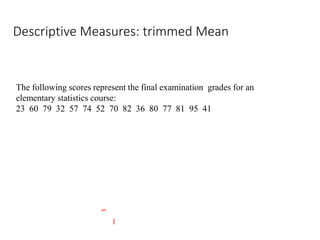
Introduction
MATH-361 PROBABILITY AND
STATISTICS
Descriptive statistics
CLO2-PLO2: Probability and Probability
Distributions
Descriptive statistics
• CLO1-PLO2: Present sample data and extract its important features
• Dot Plot
• Stem and Leaf Plot
• Frequency Distribution and Histogram Plot
• Descriptive Measures
➢ Sample Mean
➢ Sample Variance
➢ Sample Mode
➢ Sample Median
• Box Plot
Histogram plot
Histogram plot
Descriptive Measures: Sample Mean
The following scores represent the final examination grades for an
elementary statistics course:
23 60 79 32 57 74 52 70 82 36 80 77 81 95 41
Descriptive Measures: Sample Median
The following scores represent the final examination grades for an
elementary statistics course:
23 60 79 32 57 74 52 70 82 36 80 77 81 95 41
Descriptive Measures: Sample MODE
The following scores represent the final examination grades for an
elementary statistics course:
23 60 79 32 57 74 52 70 82 36 80 77 81 95 41
The mode is the number in a data set that occurs most
frequently. Count how many times each number
occurs in the data set. The mode is the number with
the highest tally.
Descriptive Measures: trimmed Mean
The following scores represent the final examination grades for an
elementary statistics course:
23 60 79 32 57 74 52 70 82 36 80 77 81 95 41
Descriptive Measures: Measure Of Variability
Sample Variance and Standard deviation
The following scores represent the final examination grades for an
elementary statistics course:
23 60 79 32 57 74 52 70 82 36 80 77 81 95 41
Descriptive Measures: Measure Of Variability
Sample Variance and Standard deviation
The following scores represent the final examination grades for an
elementary statistics course:
23 60 79 32 57 74 52 70 82 36 80 77 81 95 41
Descriptive Measures
Q1- In order to control costs, a company collects data on the weekly
number of meals claimed on expense accounts. The numbers for five
weeks are
15 14 2 7 and 13.
Find the mean and the median.
Q2-An engineering group receives email requests for technical
information from sales and service persons. The daily numbers for six
days are
11 9 17 19 4 and 15.
Find the mean and the median.
Histogram Plot
Box and Whisker Plot:Quartiles
And Percentiles
• In descriptive statistics, a box plot or
boxplot (also known as box and whisker
plot) is a type of chart often used in
explanatory data analysis.
• Box plots visually show the distribution of
numerical data and skewness through
displaying the data quartiles (or
percentiles) and averages.
• Box plots show the five-number summary
of a set of data: including the minimum
score, first (lower) quartile, median, third
(upper) quartile, and maximum score.
Minimum Score
The lowest score, excluding outliers (shown at the end of the left whisker).
Lower Quartile
Twenty-five percent of scores fall below the lower quartile value (also known as the
first quartile).
Median
The median marks the mid-point of the data and is shown by the line that divides the
box into two parts (sometimes known as the second quartile). Half the scores are
greater than or
Upper Quartile
Seventy-five percent of the scores fall below the upper quartile value (also known as
the third quartile). Thus, 25% of data are above this value.
Maximum Score
The highest score, excluding outliers (shown at the end of the right whisker).
Whiskers
The upper and lower whiskers represent scores outside the middle 50% (i.e. the lower
25% of scores and the upper 25% of scores).
The Interquartile Range (or IQR)
This is the box plot showing the middle 50% of scores (i.e., the range between the
25th and 75th percentile).
Modified Box and Whisker Plot
Descriptive Measures: trimmed Mean
The following scores represent the final examination grades for an
elementary statistics course:
23 60 79 32 57 74 52 70 82 36 80 77 81 95 41
Descriptive Measures: trimmed Mean
The following scores represent the final examination grades for an
elementary statistics course:
23 60 79 32 57 74 52 70 82 36 80 77 81 95 41
Box Plot
When the median is in the middle
of the box, and the whiskers are
about the same on both sides of
the box, then the distribution is
symmetric.
When the median is closer to the
bottom of the box, and if the
whisker is shorter on the lower
end of the box, then the
distribution is positively skewed
(skewed right).
When the median is closer to the
top of the box, and if the whisker
is shorter on the upper end of the
box, then the distribution is
negatively skewed (skewed left).
Box plots are useful as they show the
skewness of a data set
Sign of skewness of boxplot in Comparison to
Histogrws
Box Plot
Quartiles and Percentiles
Obtain the quartiles and the 97th percentile for the sulfur emission data on page ??.
15.8 26.4 17.3 11.2 23.9 24.8 18.7 13.9 9.0 13.2 22.7 9.8 6.2 14.7 17.5 26.1
12.8 28.6 17.6 23.7 26.8 22.7 18.0 20.5 11.0 20.9 15.5 19.4 16.7 10.7 19.1
15.2 22.9 26.6 20.4 21.4 19.2 21.6 16.9 19.0 18.5 23.0 24.6 20.1 16.2 18.0
7.7 13.5 23.5 14.5 14.4 29.6 19.4 17.0 20.8 24.3 22.5 24.6 18.4 18.1 8.3 21.9
12.3 22.3 13.3 11.8 19.3 20.0 25.7 31.8 25.9 10.5 15.9 27.5 18.1 17.9 9.4
24.1 20.1 28.5
The ordered data are:
6.2 7.7 8.3 9.0 9.4 9.8 10.5 10.7 11.0 11.2 11.8 12.3 12.8 13.2 13.3 13.5 13.9 14.4
14.5 14.7 15.2 15.5 15.8 15.9 16.2 16.7 16.9 17.0 17.3 17.5 17.6 17.9 18.0 18.0 18.1
18.1 18.4 18.5 18.7 19.0 19.1 19.2 19.3 19.4 19.4 20.0 20.1 20.1 20.4 20.5 20.8 20.9
21.4 21.6 21.9 22.3 22.5 22.7 22.7 22.9 23.0 23.5 23.7 23.9 24.1 24.3 24.6 24.6 24.8
25.7 25.9 26.1 26.4 26.6 26.8 27.5 28.5 28.6 29.6 31.8
Problems
Q1- 20 21 20 19 20 19 21 19
Q2- 7 6 4 0 7 1 2 4 6 6
Q3. -0.52 0.11 -0.48 0.94 0.24 -0.19 -0.55
Matlab Command Prompt
Matlab Commands Summary
Matlab Command
Prompt
Hospitals The following set of data represents the number of
hospitals for selected states. Find the mean, median, mode,
midrange, range, variance, and standard deviation for the data.
53 84 28 78 35 111 40 166 108 60 123 87 84 74 80 62
Hospitals The following set of data represents the number of
hospitals for selected states. Find the mean, median, mode,
midrange, range, variance, and standard deviation for the data.
53 84 28 78 35 111 40 166 108 60 123 87 84 74 80 62
Frequency Distribution
15.8 26.4 17.3 11.2 23.9 24.8 18.7 13.9 9.0 13.2
22.7 9.8 6.2 14.7 17.5 26.1 12.8 28.6 17.6
23.726.8 22.7 18.0 20.5 11.0 20.9 15.5 19.4 16.7
10.7 19.1 15.2 22.9 26.6 20.4 21.4 19.2 21.6
16.9 19.0 18.5 23.0 24.6 20.1 16.2 18.0 7.7 13.5
23.5 14.5 14.4 29.6 19.4 17.0 20.8 24.3 22.5
24.6 18.4 18.1 8.3 21.9 12.3 22.3 13.3 11.8 19.3
20.0 25.7 31.8 25.9 10.5 15.9 27.5 18.1 17.9 9.4
24.1 20.1 28.5
To illustrate the construction of a frequency distribution, let us
consider the following 80 determinations of the daily emission (in
tons) of sulfur oxides from an industrial plant:
Quartiles and Percentiles
Obtain the quartiles and the 97th percentile for the
sulfur emission data on page ??.
15.8 26.4 17.3 11.2 23.9 24.8 18.7 13.9 9.0 13.2
22.7 9.8 6.2 14.7 17.5 26.1 12.8 28.6 17.6 23.7
26.8 22.7 18.0 20.5 11.0 20.9 15.5 19.4 16.7 10.7
19.1 15.2 22.9 26.6 20.4 21.4 19.2 21.6 16.9 19.0
18.5 23.0 24.6 20.1 16.2 18.0 7.7 13.5 23.5 14.5
14.4 29.6 19.4 17.0 20.8 24.3 22.5 24.6 18.4 18.1
8.3 21.9 12.3 22.3 13.3 11.8 19.3 20.0 25.7 31.8
25.9 10.5 15.9 27.5 18.1 17.9 9.4 24.1 20.1 28.5
CLO- 2 Probability and Probability Distributions
Experiments, Sample Spaces Outcomes, Events
Random Experiments. Sample Spaces and Events
• Statisticians use the word experiment to describe any
process that generates a set of data. A simple example
of a statistical experiment is the tossing of a coin.
• The set of all possible outcomes of a statistical
experiment is called the sample space and is
represented by the symbol S.
• An event is a subset of a sample space.
Unions, Intersections, Complements of Events
• The complement of an event A with respect to S is the subset of all
elements of S that are not in A. We denote the complement of A by
the symbol A.
• The intersection of two events A and B, denoted by the symbol A ∩ B,
is the event containing all elements that are common to A and B.
• Two events A and B are mutually exclusive, or disjoint, if A ∩ B = φ,
that is, if A and B have no elements in common.
• The union of the two events A and B, denoted by the symbol A∪B, is
the event containing all the elements that belong to A or B or both.
Practice Problems
• An experiment consists of tossing a die and then flipping a coin
once if the number on the die is even. If the number on the die is
odd, the coin is flipped twice. Using the notation 4H, for example,
to denote the outcome that the die comes up 4 and then the coin
comes up heads, and 3HT to denote the outcome that the die
comes up 3 followed by a head and then a tail on the coin,
construct a tree diagram to show the 18 elements of the sample
space S.
Practice Problems
• Two jurors are selected from 4 alternates to serve at a murder trial.
Using the notation A1A3, for example, to denote the simple event
that alternates 1 and 3 are selected, list the 6 elements of the sample
space S.
Practice Problems
An engineering firm is hired to determine if certain waterways in Virginia are
safe for fishing. Samples
are taken from three rivers.
(a) List the elements of a sample space S, using the letters F for safe to fish
and N for not safe to fish.
(b) List the elements of S corresponding to event E that at least two of the
rivers are safe for fishing.
(c) Define an event that has as its elements the points
{FFF,NFF,FFN,NFN}.
Example 2.3: Suppose that three items are selected at random from a
manufacturing process. Each item is inspected and classified defective, D, or
nondefective, N. To list the elements of the sample space providing the most
information, we construct the tree diagram of Figure 2.2. Now, the various paths
along the branches of the tree give the distinct sample points. Starting with the
first path, we get the sample point DDD, indicating the possibility that all three
items inspected are defective.
2.11 The resumes of two male applicants for a college teaching position in chemistry are placed in the same file as
the resumes of two female applicants. Two positions become available, and the first, at the rank of assistant
professor, is filled by selecting one of the four applicants at random. The second position, at the rank of instructor,
is then filled by selecting at random one of the remaining three applicants. Using the notation M2F1, for example,
to denote the simple event that the first position is filled by the second male applicant and the second position is
then filled by the first female
applicant,
(a) list the elements of a sample space S;
(b) list the elements of S corresponding to event A that the position of assistant professor is filled by a male
applicant;
(c) list the elements of S corresponding to event B that exactly one of the two positions is filled by a male
applicant;
(d) list the elements of S corresponding to event C that neither position is filled by a male applicant;
(e) list the elements of S corresponding to the event A ∩ B;
(f) list the elements of S corresponding to the event A ∪ C;
(g) construct a Venn diagram to illustrate the intersections and unions of the events A, B, and C.

Lecture-2 Descriptive Statistics-Box Plot Descriptive Measures.pdf

  • 1.
  • 2.
    Descriptive statistics CLO2-PLO2: Probabilityand Probability Distributions
  • 3.
    Descriptive statistics • CLO1-PLO2:Present sample data and extract its important features • Dot Plot • Stem and Leaf Plot • Frequency Distribution and Histogram Plot • Descriptive Measures ➢ Sample Mean ➢ Sample Variance ➢ Sample Mode ➢ Sample Median • Box Plot
  • 4.
  • 5.
  • 6.
    Descriptive Measures: SampleMean The following scores represent the final examination grades for an elementary statistics course: 23 60 79 32 57 74 52 70 82 36 80 77 81 95 41
  • 7.
    Descriptive Measures: SampleMedian The following scores represent the final examination grades for an elementary statistics course: 23 60 79 32 57 74 52 70 82 36 80 77 81 95 41
  • 8.
    Descriptive Measures: SampleMODE The following scores represent the final examination grades for an elementary statistics course: 23 60 79 32 57 74 52 70 82 36 80 77 81 95 41 The mode is the number in a data set that occurs most frequently. Count how many times each number occurs in the data set. The mode is the number with the highest tally.
  • 9.
    Descriptive Measures: trimmedMean The following scores represent the final examination grades for an elementary statistics course: 23 60 79 32 57 74 52 70 82 36 80 77 81 95 41
  • 10.
    Descriptive Measures: MeasureOf Variability Sample Variance and Standard deviation The following scores represent the final examination grades for an elementary statistics course: 23 60 79 32 57 74 52 70 82 36 80 77 81 95 41
  • 12.
    Descriptive Measures: MeasureOf Variability Sample Variance and Standard deviation The following scores represent the final examination grades for an elementary statistics course: 23 60 79 32 57 74 52 70 82 36 80 77 81 95 41
  • 13.
    Descriptive Measures Q1- Inorder to control costs, a company collects data on the weekly number of meals claimed on expense accounts. The numbers for five weeks are 15 14 2 7 and 13. Find the mean and the median. Q2-An engineering group receives email requests for technical information from sales and service persons. The daily numbers for six days are 11 9 17 19 4 and 15. Find the mean and the median.
  • 14.
  • 15.
    Box and WhiskerPlot:Quartiles And Percentiles • In descriptive statistics, a box plot or boxplot (also known as box and whisker plot) is a type of chart often used in explanatory data analysis. • Box plots visually show the distribution of numerical data and skewness through displaying the data quartiles (or percentiles) and averages. • Box plots show the five-number summary of a set of data: including the minimum score, first (lower) quartile, median, third (upper) quartile, and maximum score.
  • 16.
    Minimum Score The lowestscore, excluding outliers (shown at the end of the left whisker). Lower Quartile Twenty-five percent of scores fall below the lower quartile value (also known as the first quartile). Median The median marks the mid-point of the data and is shown by the line that divides the box into two parts (sometimes known as the second quartile). Half the scores are greater than or
  • 17.
    Upper Quartile Seventy-five percentof the scores fall below the upper quartile value (also known as the third quartile). Thus, 25% of data are above this value. Maximum Score The highest score, excluding outliers (shown at the end of the right whisker). Whiskers The upper and lower whiskers represent scores outside the middle 50% (i.e. the lower 25% of scores and the upper 25% of scores). The Interquartile Range (or IQR) This is the box plot showing the middle 50% of scores (i.e., the range between the 25th and 75th percentile).
  • 19.
    Modified Box andWhisker Plot
  • 20.
    Descriptive Measures: trimmedMean The following scores represent the final examination grades for an elementary statistics course: 23 60 79 32 57 74 52 70 82 36 80 77 81 95 41
  • 21.
    Descriptive Measures: trimmedMean The following scores represent the final examination grades for an elementary statistics course: 23 60 79 32 57 74 52 70 82 36 80 77 81 95 41
  • 22.
  • 23.
    When the medianis in the middle of the box, and the whiskers are about the same on both sides of the box, then the distribution is symmetric. When the median is closer to the bottom of the box, and if the whisker is shorter on the lower end of the box, then the distribution is positively skewed (skewed right). When the median is closer to the top of the box, and if the whisker is shorter on the upper end of the box, then the distribution is negatively skewed (skewed left). Box plots are useful as they show the skewness of a data set
  • 24.
    Sign of skewnessof boxplot in Comparison to Histogrws
  • 25.
  • 26.
    Quartiles and Percentiles Obtainthe quartiles and the 97th percentile for the sulfur emission data on page ??. 15.8 26.4 17.3 11.2 23.9 24.8 18.7 13.9 9.0 13.2 22.7 9.8 6.2 14.7 17.5 26.1 12.8 28.6 17.6 23.7 26.8 22.7 18.0 20.5 11.0 20.9 15.5 19.4 16.7 10.7 19.1 15.2 22.9 26.6 20.4 21.4 19.2 21.6 16.9 19.0 18.5 23.0 24.6 20.1 16.2 18.0 7.7 13.5 23.5 14.5 14.4 29.6 19.4 17.0 20.8 24.3 22.5 24.6 18.4 18.1 8.3 21.9 12.3 22.3 13.3 11.8 19.3 20.0 25.7 31.8 25.9 10.5 15.9 27.5 18.1 17.9 9.4 24.1 20.1 28.5 The ordered data are: 6.2 7.7 8.3 9.0 9.4 9.8 10.5 10.7 11.0 11.2 11.8 12.3 12.8 13.2 13.3 13.5 13.9 14.4 14.5 14.7 15.2 15.5 15.8 15.9 16.2 16.7 16.9 17.0 17.3 17.5 17.6 17.9 18.0 18.0 18.1 18.1 18.4 18.5 18.7 19.0 19.1 19.2 19.3 19.4 19.4 20.0 20.1 20.1 20.4 20.5 20.8 20.9 21.4 21.6 21.9 22.3 22.5 22.7 22.7 22.9 23.0 23.5 23.7 23.9 24.1 24.3 24.6 24.6 24.8 25.7 25.9 26.1 26.4 26.6 26.8 27.5 28.5 28.6 29.6 31.8
  • 28.
    Problems Q1- 20 2120 19 20 19 21 19 Q2- 7 6 4 0 7 1 2 4 6 6 Q3. -0.52 0.11 -0.48 0.94 0.24 -0.19 -0.55
  • 29.
  • 30.
  • 31.
  • 32.
    Hospitals The followingset of data represents the number of hospitals for selected states. Find the mean, median, mode, midrange, range, variance, and standard deviation for the data. 53 84 28 78 35 111 40 166 108 60 123 87 84 74 80 62
  • 33.
    Hospitals The followingset of data represents the number of hospitals for selected states. Find the mean, median, mode, midrange, range, variance, and standard deviation for the data. 53 84 28 78 35 111 40 166 108 60 123 87 84 74 80 62
  • 35.
    Frequency Distribution 15.8 26.417.3 11.2 23.9 24.8 18.7 13.9 9.0 13.2 22.7 9.8 6.2 14.7 17.5 26.1 12.8 28.6 17.6 23.726.8 22.7 18.0 20.5 11.0 20.9 15.5 19.4 16.7 10.7 19.1 15.2 22.9 26.6 20.4 21.4 19.2 21.6 16.9 19.0 18.5 23.0 24.6 20.1 16.2 18.0 7.7 13.5 23.5 14.5 14.4 29.6 19.4 17.0 20.8 24.3 22.5 24.6 18.4 18.1 8.3 21.9 12.3 22.3 13.3 11.8 19.3 20.0 25.7 31.8 25.9 10.5 15.9 27.5 18.1 17.9 9.4 24.1 20.1 28.5 To illustrate the construction of a frequency distribution, let us consider the following 80 determinations of the daily emission (in tons) of sulfur oxides from an industrial plant:
  • 36.
    Quartiles and Percentiles Obtainthe quartiles and the 97th percentile for the sulfur emission data on page ??. 15.8 26.4 17.3 11.2 23.9 24.8 18.7 13.9 9.0 13.2 22.7 9.8 6.2 14.7 17.5 26.1 12.8 28.6 17.6 23.7 26.8 22.7 18.0 20.5 11.0 20.9 15.5 19.4 16.7 10.7 19.1 15.2 22.9 26.6 20.4 21.4 19.2 21.6 16.9 19.0 18.5 23.0 24.6 20.1 16.2 18.0 7.7 13.5 23.5 14.5 14.4 29.6 19.4 17.0 20.8 24.3 22.5 24.6 18.4 18.1 8.3 21.9 12.3 22.3 13.3 11.8 19.3 20.0 25.7 31.8 25.9 10.5 15.9 27.5 18.1 17.9 9.4 24.1 20.1 28.5
  • 37.
    CLO- 2 Probabilityand Probability Distributions Experiments, Sample Spaces Outcomes, Events
  • 38.
    Random Experiments. SampleSpaces and Events • Statisticians use the word experiment to describe any process that generates a set of data. A simple example of a statistical experiment is the tossing of a coin. • The set of all possible outcomes of a statistical experiment is called the sample space and is represented by the symbol S. • An event is a subset of a sample space.
  • 39.
    Unions, Intersections, Complementsof Events • The complement of an event A with respect to S is the subset of all elements of S that are not in A. We denote the complement of A by the symbol A. • The intersection of two events A and B, denoted by the symbol A ∩ B, is the event containing all elements that are common to A and B. • Two events A and B are mutually exclusive, or disjoint, if A ∩ B = φ, that is, if A and B have no elements in common. • The union of the two events A and B, denoted by the symbol A∪B, is the event containing all the elements that belong to A or B or both.
  • 40.
    Practice Problems • Anexperiment consists of tossing a die and then flipping a coin once if the number on the die is even. If the number on the die is odd, the coin is flipped twice. Using the notation 4H, for example, to denote the outcome that the die comes up 4 and then the coin comes up heads, and 3HT to denote the outcome that the die comes up 3 followed by a head and then a tail on the coin, construct a tree diagram to show the 18 elements of the sample space S.
  • 41.
    Practice Problems • Twojurors are selected from 4 alternates to serve at a murder trial. Using the notation A1A3, for example, to denote the simple event that alternates 1 and 3 are selected, list the 6 elements of the sample space S.
  • 42.
    Practice Problems An engineeringfirm is hired to determine if certain waterways in Virginia are safe for fishing. Samples are taken from three rivers. (a) List the elements of a sample space S, using the letters F for safe to fish and N for not safe to fish. (b) List the elements of S corresponding to event E that at least two of the rivers are safe for fishing. (c) Define an event that has as its elements the points {FFF,NFF,FFN,NFN}.
  • 43.
    Example 2.3: Supposethat three items are selected at random from a manufacturing process. Each item is inspected and classified defective, D, or nondefective, N. To list the elements of the sample space providing the most information, we construct the tree diagram of Figure 2.2. Now, the various paths along the branches of the tree give the distinct sample points. Starting with the first path, we get the sample point DDD, indicating the possibility that all three items inspected are defective.
  • 44.
    2.11 The resumesof two male applicants for a college teaching position in chemistry are placed in the same file as the resumes of two female applicants. Two positions become available, and the first, at the rank of assistant professor, is filled by selecting one of the four applicants at random. The second position, at the rank of instructor, is then filled by selecting at random one of the remaining three applicants. Using the notation M2F1, for example, to denote the simple event that the first position is filled by the second male applicant and the second position is then filled by the first female applicant, (a) list the elements of a sample space S; (b) list the elements of S corresponding to event A that the position of assistant professor is filled by a male applicant; (c) list the elements of S corresponding to event B that exactly one of the two positions is filled by a male applicant; (d) list the elements of S corresponding to event C that neither position is filled by a male applicant; (e) list the elements of S corresponding to the event A ∩ B; (f) list the elements of S corresponding to the event A ∪ C; (g) construct a Venn diagram to illustrate the intersections and unions of the events A, B, and C.