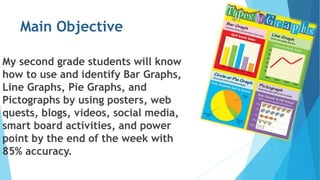
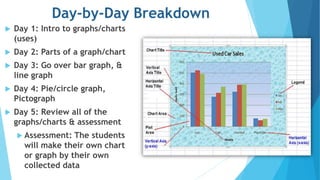
Graphs and Charts 
Unit Lesson Plan 
Nicole Keown
Analyze the Learner 
2nd grade 
22 students 
10 boys- 8 Caucasian, 2 Hispanic 
12 girls- 10 Caucasian, 2 African 
American
Main Objective 
My second grade students will know 
how to use and identify Bar Graphs, 
Line Graphs, Pie Graphs, and 
Pictographs by using posters, web 
quests, blogs, videos, social media, 
smart board activities, and power 
point by the end of the week with 
85% accuracy.
Day-by-Day Breakdown 
 Day 1: Intro to graphs/charts 
(uses) 
 Day 2: Parts of a graph/chart 
 Day 3: Go over bar graph, & 
line graph 
 Day 4: Pie/circle graph, 
Pictograph 
 Day 5: Review all of the 
graphs/charts & assessment 
 Assessment: The students 
will make their own chart 
or graph by their own 
collected data
Use of Technology 
 Smart Board- show how to make different charts, using power point & to 
play activities on smart board 
 Posters- show parts of charts and different examples 
 Web quest- computers or computer lab will be needed 
 Videos- uses of charts and graphs 
 Blogs- to post assignments and to communicate with students 
 Social Media Sites- hold discussions and post educated videos
Work Cited Page 
http://www.huffingtonpost.com/jennifer-harvey/dear-parents-of-white-children_ 
b_3719818.html 
http://www.mpmschoolsupplies.com/p-16551-chart-types-of-graphs.aspx 
http://farm5.staticflickr.com/4145/5118199991_1e530a869e_z.jpg 
http://www.businesscomputingworld.co.uk/nine-technology-predictions-for- 
2013/

Graphs and charts

  • 1.
    Graphs and Charts Unit Lesson Plan Nicole Keown
  • 2.
    Analyze the Learner 2nd grade 22 students 10 boys- 8 Caucasian, 2 Hispanic 12 girls- 10 Caucasian, 2 African American
  • 3.
    Main Objective Mysecond grade students will know how to use and identify Bar Graphs, Line Graphs, Pie Graphs, and Pictographs by using posters, web quests, blogs, videos, social media, smart board activities, and power point by the end of the week with 85% accuracy.
  • 4.
    Day-by-Day Breakdown Day 1: Intro to graphs/charts (uses)  Day 2: Parts of a graph/chart  Day 3: Go over bar graph, & line graph  Day 4: Pie/circle graph, Pictograph  Day 5: Review all of the graphs/charts & assessment  Assessment: The students will make their own chart or graph by their own collected data
  • 5.
    Use of Technology  Smart Board- show how to make different charts, using power point & to play activities on smart board  Posters- show parts of charts and different examples  Web quest- computers or computer lab will be needed  Videos- uses of charts and graphs  Blogs- to post assignments and to communicate with students  Social Media Sites- hold discussions and post educated videos
  • 6.
    Work Cited Page http://www.huffingtonpost.com/jennifer-harvey/dear-parents-of-white-children_ b_3719818.html http://www.mpmschoolsupplies.com/p-16551-chart-types-of-graphs.aspx http://farm5.staticflickr.com/4145/5118199991_1e530a869e_z.jpg http://www.businesscomputingworld.co.uk/nine-technology-predictions-for- 2013/