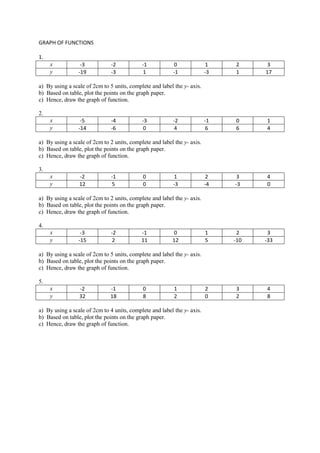
1. GRAPH OF FUNCTIONS
1.
x -3 -2 -1 0 1 2 3
y -19 -3 1 -1 -3 1 17
a) By using a scale of 2cm to 5 units, complete and label the y- axis.
b) Based on table, plot the points on the graph paper.
c) Hence, draw the graph of function.
2.
x -5 -4 -3 -2 -1 0 1
y -14 -6 0 4 6 6 4
a) By using a scale of 2cm to 2 units, complete and label the y- axis.
b) Based on table, plot the points on the graph paper.
c) Hence, draw the graph of function.
3.
x -2 -1 0 1 2 3 4
y 12 5 0 -3 -4 -3 0
a) By using a scale of 2cm to 2 units, complete and label the y- axis.
b) Based on table, plot the points on the graph paper.
c) Hence, draw the graph of function.
4.
x -3 -2 -1 0 1 2 3
y -15 2 11 12 5 -10 -33
a) By using a scale of 2cm to 5 units, complete and label the y- axis.
b) Based on table, plot the points on the graph paper.
c) Hence, draw the graph of function.
5.
x -2 -1 0 1 2 3 4
y 32 18 8 2 0 2 8
a) By using a scale of 2cm to 4 units, complete and label the y- axis.
b) Based on table, plot the points on the graph paper.
c) Hence, draw the graph of function.