1. Name_______________________
Experiment - Using Formulas & Spreadsheets
Part 1
This project requires you to keep track of some information related to a sporting
event. First, you need to select an in-season sporting event that interests you. It can be a
professional game or one here at school. You need to keep track of two different
statistics of two athletes (they can be on the same team or different teams). In
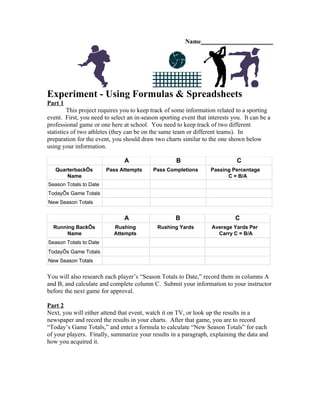
preparation for the event, you should draw two charts similar to the one shown below
using your information.
A B C
QuarterbackÕs Pass Attempts Pass Completions Passing Percentage
Name C = B/A
Season Totals to Date
TodayÕs Game Totals
New Season Totals
A B C
Running BackÕs Rushing Rushing Yards Average Yards Per
Name Attempts Carry C = B/A
Season Totals to Date
TodayÕs Game Totals
New Season Totals
You will also research each player’s “Season Totals to Date,” record them in columns A
and B, and calculate and complete column C. Submit your information to your instructor
before the next game for approval.
Part 2
Next, you will either attend that event, watch it on TV, or look up the results in a
newspaper and record the results in your charts. After that game, you are to record
“Today’s Game Totals,” and enter a formula to calculate “New Season Totals” for each
of your players. Finally, summarize your results in a paragraph, explaining the data and
how you acquired it.