Download to read offline

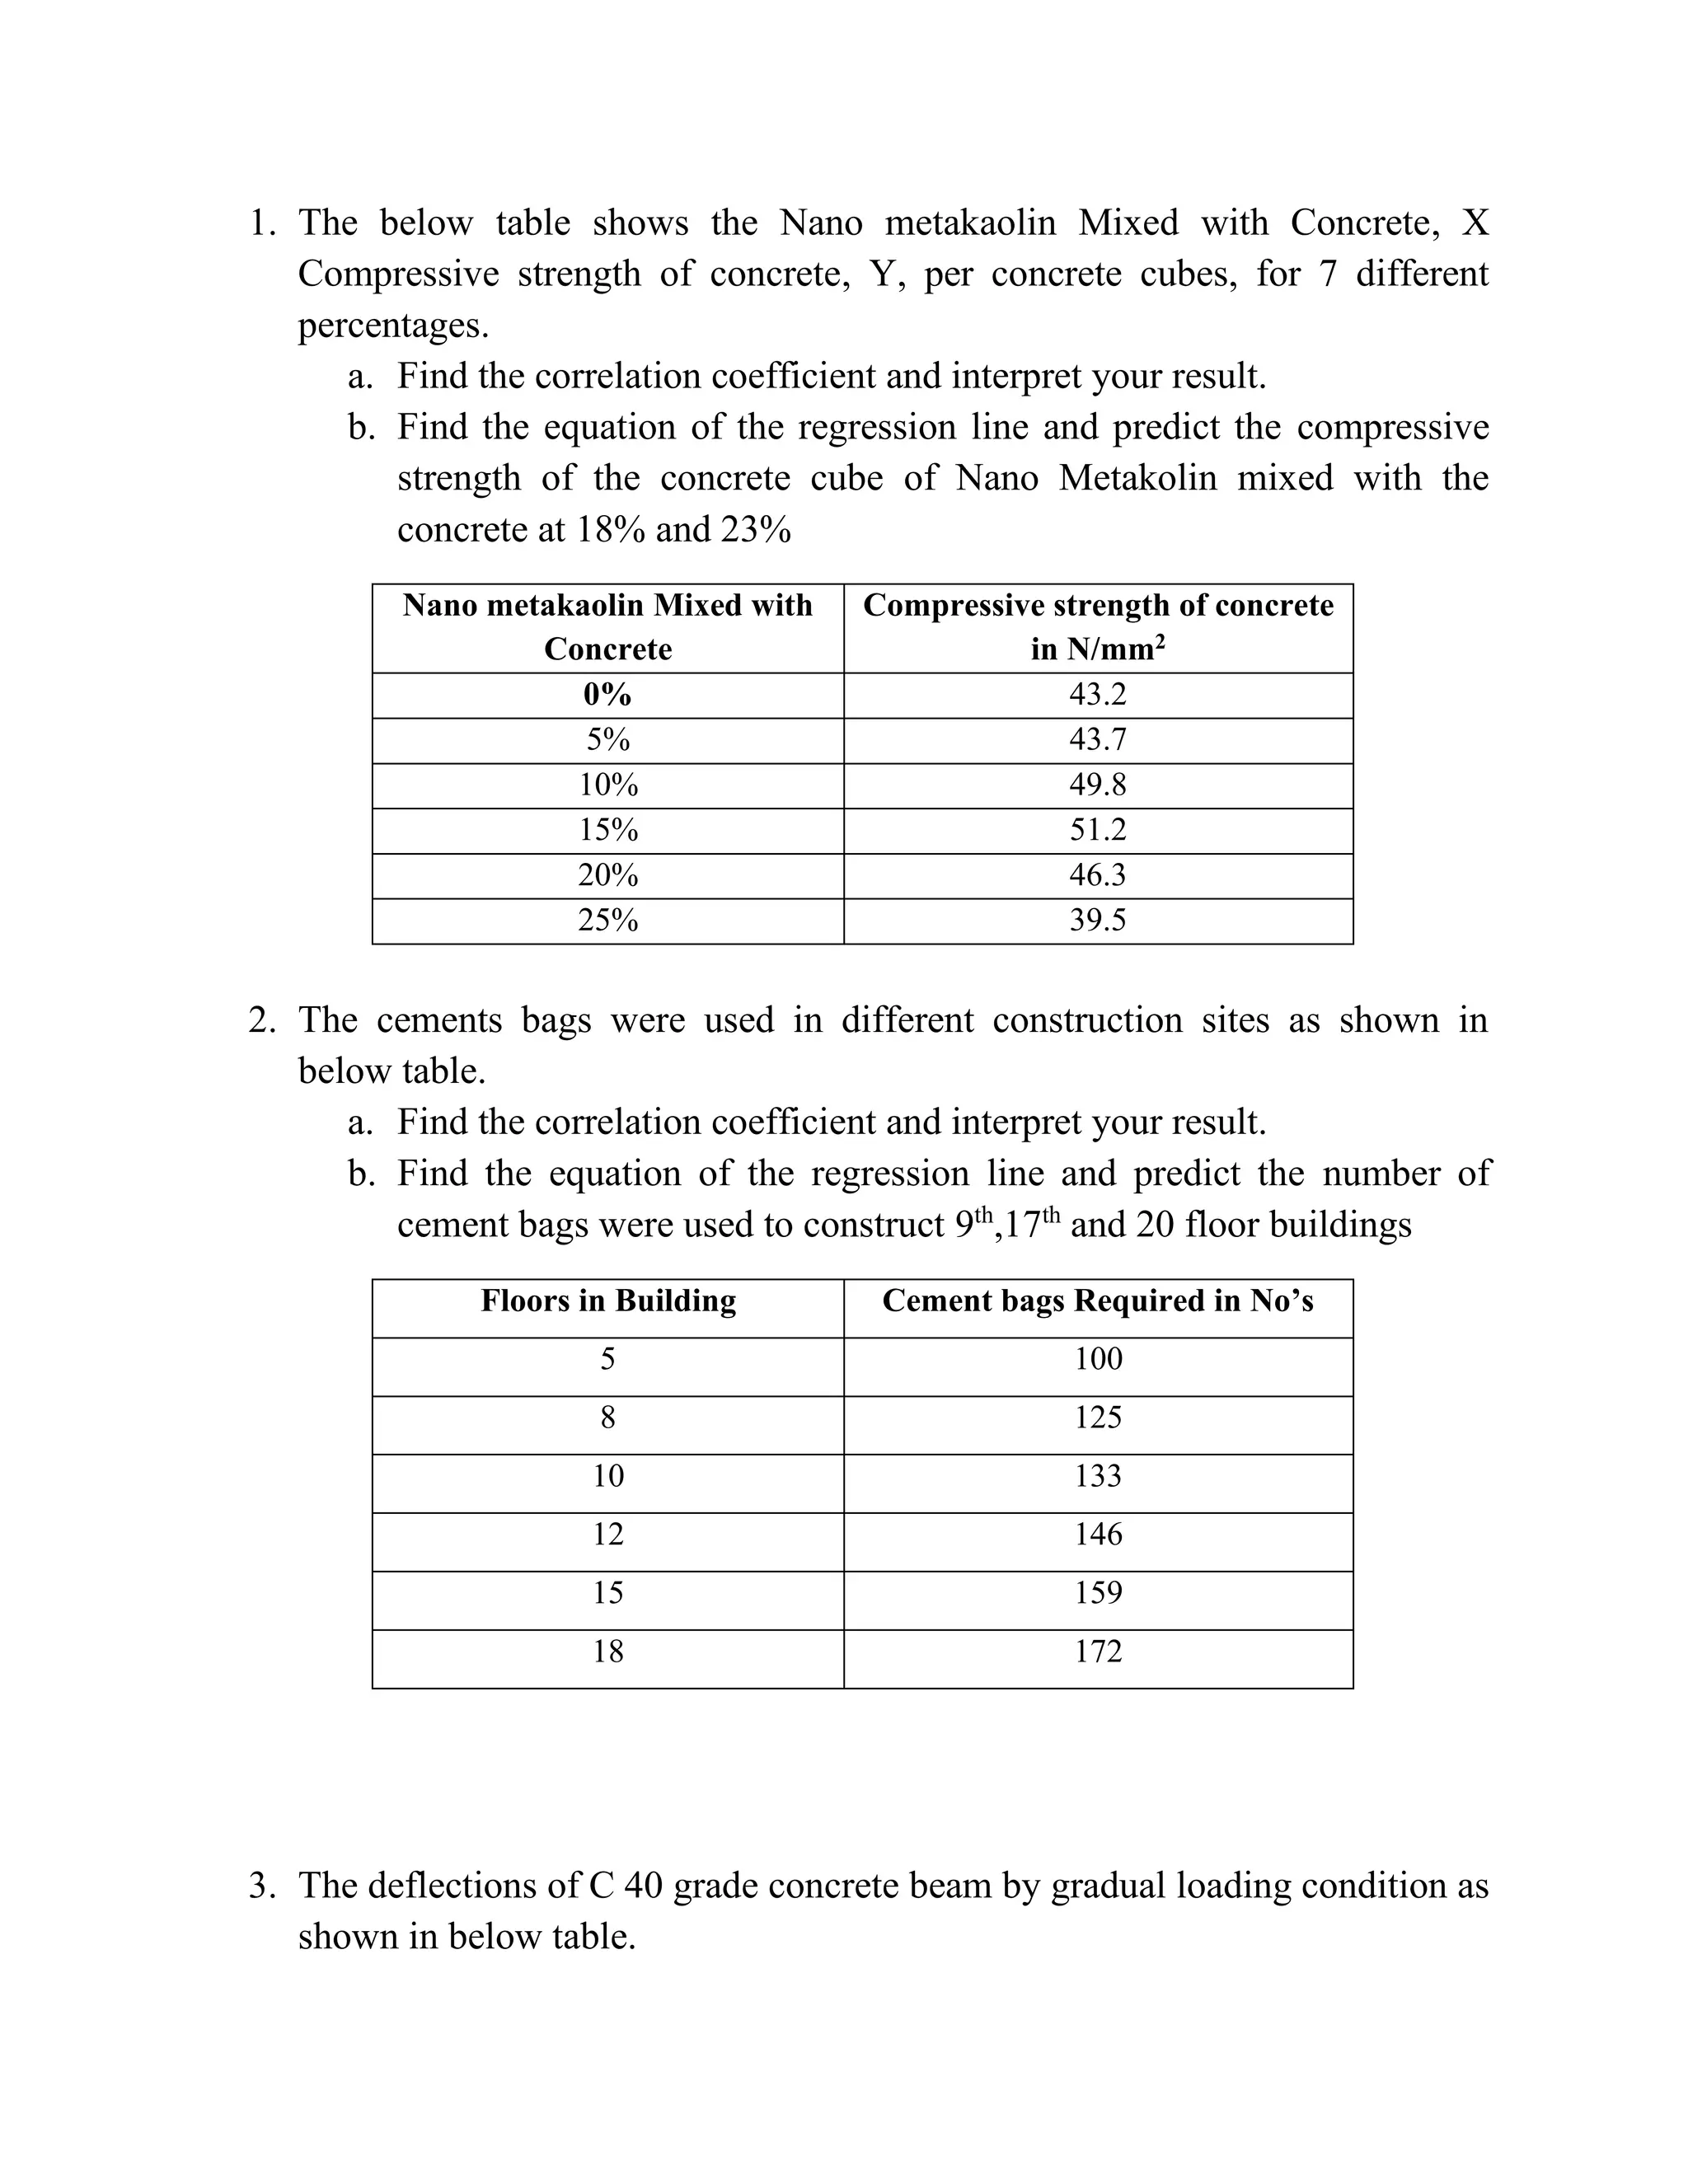
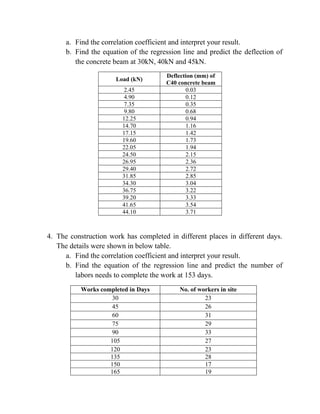
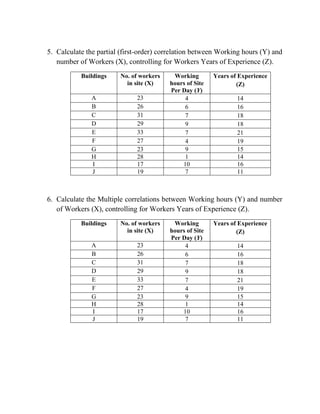
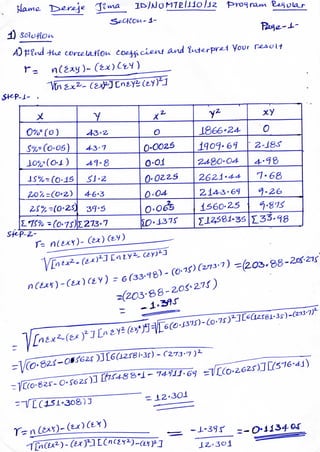
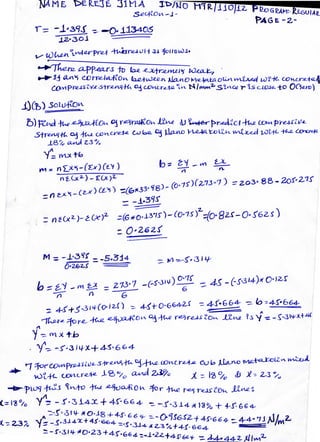
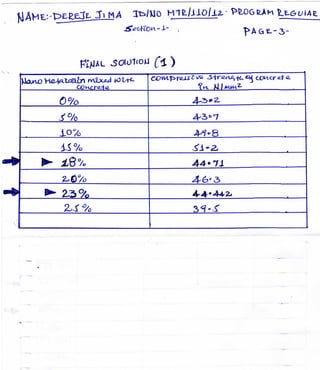
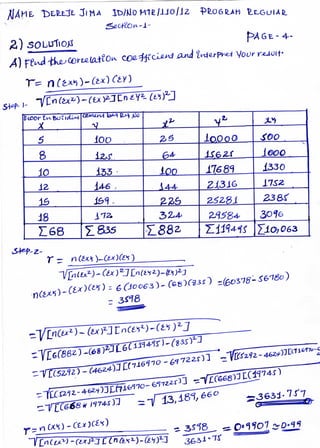
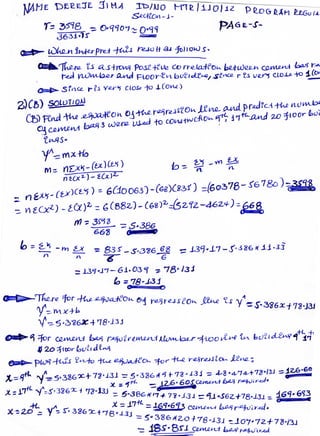
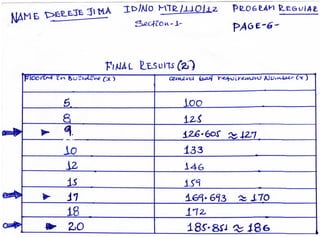
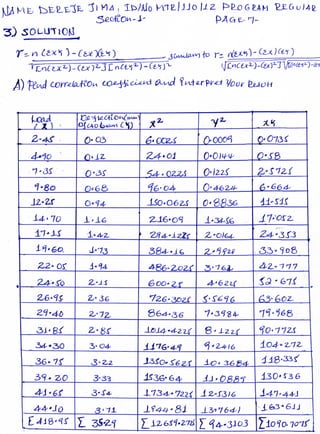
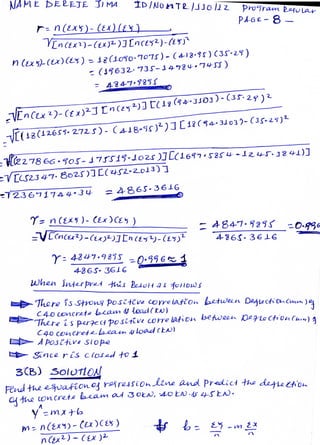
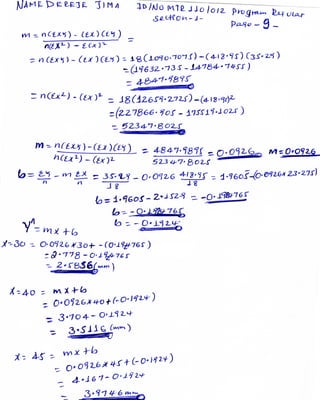
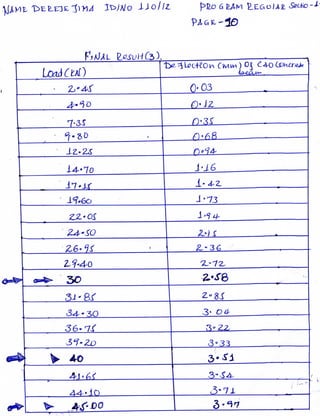
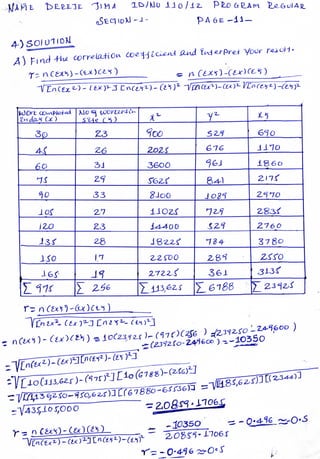
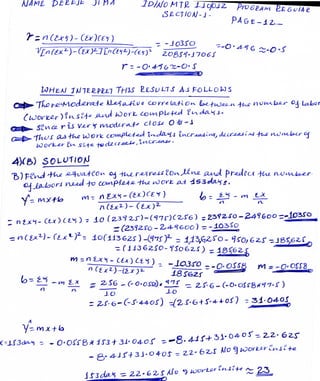
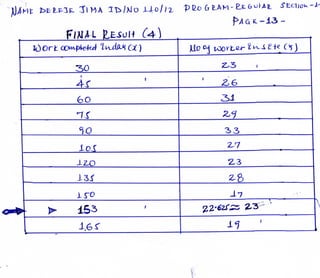
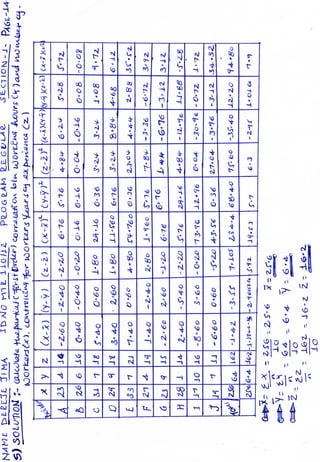
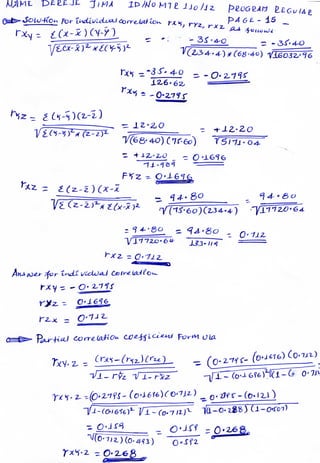
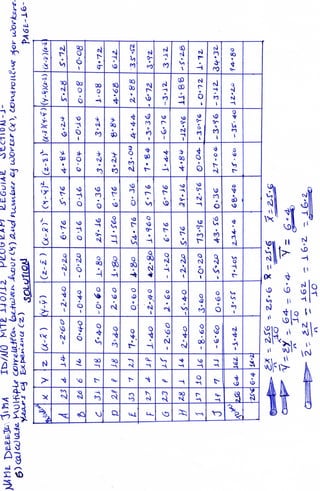
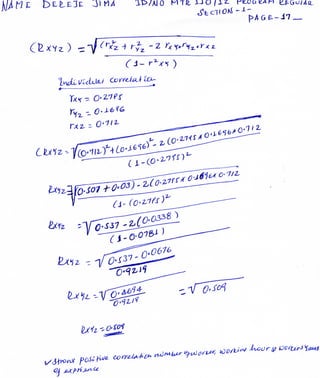

The document presents several analytical tasks involving the correlation and regression of construction-related data, such as the compressive strength of concrete mixed with varying percentages of nano metakaolin, the usage of cement bags in buildings, deflections of concrete beams under load, and the number of workers needed for construction over time. Specific calculations required include correlation coefficients, regression equations, and predictions for varying conditions. Additionally, it involves assessing partial and multiple correlations accounting for additional variables such as years of experience.


