SlideShare a Scribd company logo
1 of 4
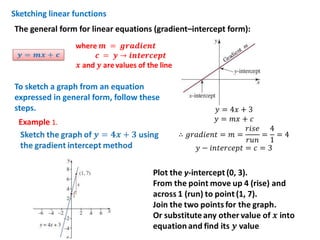
Sketching linear functions
The general form for linear equations (gradient–intercept form):

To sketch a graph from an equation
expressed in general form, follow these
steps.
Example 1.

𝑦 = 4𝑥 + 3
𝑦 = 𝑚𝑥 + 𝑐
𝑟𝑖𝑠𝑒 4
∴ 𝑔𝑟𝑎𝑑𝑖𝑒𝑛𝑡 = 𝑚 =
= =4
𝑟𝑢𝑛 1
𝑦 − 𝑖𝑛𝑡𝑒𝑟𝑐𝑒𝑝𝑡 = 𝑐 = 3
sketching linear graphs using intercepts

Example 2.

𝒙 𝒊𝒏𝒕𝒆𝒓𝒄𝒆𝒑𝒕 𝒚 = 𝟎
0 = 2𝑥 + 1
1
𝟏
∴ 𝑥 = − 𝑝𝑜𝑖𝑛𝑡 → − , 𝟎
2
𝟐
𝒚 𝒊𝒏𝒕𝒆𝒓𝒄𝒆𝒑𝒕 𝒙 = 𝟎
𝑦 = 2 0 + 1 = 1 𝑝𝑜𝑖𝑛𝑡 → (𝟎, 𝟏)
Equations and functions and the CAS calculator

When you are using the TI-Nspire CAS calculator to draw the graphs of
functions, the equations must be entered into the calculator using fn(x)

On a Graphs page, complete the function
entry line as:
f 1(x) = 2x + 1
Then press ENTER· to draw the graph.
To find the y-intercept, press:
• Menu b
• 5:Trace 5
• 1:Graph Trace 1
The y-intercept will be displayed.
Press ENTER · to lock the coordinates
into place.
Example 3.

Exercise 1D

More Related Content

What's hot

3.3 graphs of exponential functions
3.3 graphs of  exponential functions3.3 graphs of  exponential functions
3.3 graphs of exponential functionshisema01
 
2D & 3D Modelling with Mathematica
2D & 3D Modelling with Mathematica2D & 3D Modelling with Mathematica
2D & 3D Modelling with MathematicaMiles Ford
 
Assignment method
Assignment methodAssignment method
Assignment methodR A Shah
 
1.7 composite figures (1)
1.7 composite figures (1)1.7 composite figures (1)
1.7 composite figures (1)LeizelAlvarez1
 
1.7 composite figures
1.7 composite figures1.7 composite figures
1.7 composite figuresEdmarPrado2
 
Mth 518 report grapes_garachico
Mth 518 report grapes_garachicoMth 518 report grapes_garachico
Mth 518 report grapes_garachicoAji Garachico
 
2.8 Absolute Value Functions
2.8 Absolute Value Functions2.8 Absolute Value Functions
2.8 Absolute Value Functionshisema01
 
Graphing absolute value
Graphing absolute valueGraphing absolute value
Graphing absolute valueRDemolina
 
Alg 2 sections 2.1
Alg 2 sections 2.1Alg 2 sections 2.1
Alg 2 sections 2.1nscross40
 
A25 5 completingsquare
A25 5 completingsquareA25 5 completingsquare
A25 5 completingsquarevhiggins1
 
AP Calculus January 5, 2009
AP Calculus January 5, 2009AP Calculus January 5, 2009
AP Calculus January 5, 2009Darren Kuropatwa
 
Section 1.2
Section 1.2Section 1.2
Section 1.2pketkar
 
Question 2 Solution
Question 2 SolutionQuestion 2 Solution
Question 2 SolutionShinobi
 
Quantitative Analysis For Decision Making
Quantitative Analysis For Decision MakingQuantitative Analysis For Decision Making
Quantitative Analysis For Decision Makingaminsand
 
Chapter 1 test 2012- 2013
Chapter 1 test 2012- 2013Chapter 1 test 2012- 2013
Chapter 1 test 2012- 2013eadeane
 
Ejercicio1 2 pretarea-laura montes
Ejercicio1 2 pretarea-laura montesEjercicio1 2 pretarea-laura montes
Ejercicio1 2 pretarea-laura montesLAURAXIMENAMONTESEST
 

What's hot (20)

3.3 graphs of exponential functions
3.3 graphs of  exponential functions3.3 graphs of  exponential functions
3.3 graphs of exponential functions
 
2D & 3D Modelling with Mathematica
2D & 3D Modelling with Mathematica2D & 3D Modelling with Mathematica
2D & 3D Modelling with Mathematica
 
Assignment method
Assignment methodAssignment method
Assignment method
 
1.7 composite figures (1)
1.7 composite figures (1)1.7 composite figures (1)
1.7 composite figures (1)
 
1.7 composite figures
1.7 composite figures1.7 composite figures
1.7 composite figures
 
Mth 518 report grapes_garachico
Mth 518 report grapes_garachicoMth 518 report grapes_garachico
Mth 518 report grapes_garachico
 
2.8 Absolute Value Functions
2.8 Absolute Value Functions2.8 Absolute Value Functions
2.8 Absolute Value Functions
 
Assignment problem
Assignment problemAssignment problem
Assignment problem
 
Graphing absolute value
Graphing absolute valueGraphing absolute value
Graphing absolute value
 
Alg 2 sections 2.1
Alg 2 sections 2.1Alg 2 sections 2.1
Alg 2 sections 2.1
 
A25 5 completingsquare
A25 5 completingsquareA25 5 completingsquare
A25 5 completingsquare
 
Mississauga Interlocking Paver Estimate Worksheet
Mississauga Interlocking Paver Estimate WorksheetMississauga Interlocking Paver Estimate Worksheet
Mississauga Interlocking Paver Estimate Worksheet
 
AP Calculus January 5, 2009
AP Calculus January 5, 2009AP Calculus January 5, 2009
AP Calculus January 5, 2009
 
Section 1.2
Section 1.2Section 1.2
Section 1.2
 
Question 2 Solution
Question 2 SolutionQuestion 2 Solution
Question 2 Solution
 
8 6 Notes
8 6 Notes8 6 Notes
8 6 Notes
 
Impact of error
Impact of errorImpact of error
Impact of error
 
Quantitative Analysis For Decision Making
Quantitative Analysis For Decision MakingQuantitative Analysis For Decision Making
Quantitative Analysis For Decision Making
 
Chapter 1 test 2012- 2013
Chapter 1 test 2012- 2013Chapter 1 test 2012- 2013
Chapter 1 test 2012- 2013
 
Ejercicio1 2 pretarea-laura montes
Ejercicio1 2 pretarea-laura montesEjercicio1 2 pretarea-laura montes
Ejercicio1 2 pretarea-laura montes
 

Similar to Ex1 d sketchlinfuncs

Graphing Linear Equations Lesson
Graphing Linear Equations LessonGraphing Linear Equations Lesson
Graphing Linear Equations Lessonbslkmljsl
 
Rectangular Coordinates, Introduction to Graphing Equations
Rectangular Coordinates, Introduction to Graphing EquationsRectangular Coordinates, Introduction to Graphing Equations
Rectangular Coordinates, Introduction to Graphing EquationsSandyPoinsett
 
IB Maths SL Transformations of functions
IB Maths SL Transformations of functionsIB Maths SL Transformations of functions
IB Maths SL Transformations of functionsestelav
 
Grafica de Funciones Trigonométricas.
Grafica de Funciones Trigonométricas.Grafica de Funciones Trigonométricas.
Grafica de Funciones Trigonométricas.JoseHernndezYepes
 
De la grafica a la funcion
De la grafica a la funcionDe la grafica a la funcion
De la grafica a la funcionAna Faraco
 
Graphing Linear Equations Lesson
Graphing Linear Equations LessonGraphing Linear Equations Lesson
Graphing Linear Equations Lessoncdavis12
 
Graphs of trigonometric exponential functions lecture
Graphs of trigonometric exponential functions lectureGraphs of trigonometric exponential functions lecture
Graphs of trigonometric exponential functions lectureAdnanBukhari13
 
Graphing Trig Functions-Tangent and Cotangent.ppt
Graphing Trig Functions-Tangent and Cotangent.pptGraphing Trig Functions-Tangent and Cotangent.ppt
Graphing Trig Functions-Tangent and Cotangent.pptReyRoluna1
 
Chapter 2 - Types of a Function.pdf
Chapter 2 - Types of a Function.pdfChapter 2 - Types of a Function.pdf
Chapter 2 - Types of a Function.pdfManarKareem1
 
3 1 Quadratic Functions
3 1 Quadratic Functions3 1 Quadratic Functions
3 1 Quadratic Functionssilvia
 
3.10 3.11 Notes A
3.10 3.11 Notes A3.10 3.11 Notes A
3.10 3.11 Notes Ambetzel
 
2021 noveno guia en casa matematicas periodo 3
2021 noveno guia en casa matematicas periodo 32021 noveno guia en casa matematicas periodo 3
2021 noveno guia en casa matematicas periodo 3Ximena Zuluaga
 
February 18 2016
February 18 2016February 18 2016
February 18 2016khyps13
 
GENMATH Module 2.pptx
GENMATH Module 2.pptxGENMATH Module 2.pptx
GENMATH Module 2.pptxSherilynInson
 
How to graph Functions
How to graph FunctionsHow to graph Functions
How to graph Functionscoolhanddav
 
5HBC: How to Graph Implicit Relations Intro Packet!
5HBC: How to Graph Implicit Relations Intro Packet!5HBC: How to Graph Implicit Relations Intro Packet!
5HBC: How to Graph Implicit Relations Intro Packet!A Jorge Garcia
 

Similar to Ex1 d sketchlinfuncs (20)

Graphing Linear Equations Lesson
Graphing Linear Equations LessonGraphing Linear Equations Lesson
Graphing Linear Equations Lesson
 
Rectangular Coordinates, Introduction to Graphing Equations
Rectangular Coordinates, Introduction to Graphing EquationsRectangular Coordinates, Introduction to Graphing Equations
Rectangular Coordinates, Introduction to Graphing Equations
 
IB Maths SL Transformations of functions
IB Maths SL Transformations of functionsIB Maths SL Transformations of functions
IB Maths SL Transformations of functions
 
Grafica de Funciones Trigonométricas.
Grafica de Funciones Trigonométricas.Grafica de Funciones Trigonométricas.
Grafica de Funciones Trigonométricas.
 
Math Functions
Math FunctionsMath Functions
Math Functions
 
De la grafica a la funcion
De la grafica a la funcionDe la grafica a la funcion
De la grafica a la funcion
 
Graphing Linear Equations Lesson
Graphing Linear Equations LessonGraphing Linear Equations Lesson
Graphing Linear Equations Lesson
 
Líneas rectas (slide share)
Líneas rectas (slide share)Líneas rectas (slide share)
Líneas rectas (slide share)
 
Graphs of trigonometric exponential functions lecture
Graphs of trigonometric exponential functions lectureGraphs of trigonometric exponential functions lecture
Graphs of trigonometric exponential functions lecture
 
Graphing Trig Functions-Tangent and Cotangent.ppt
Graphing Trig Functions-Tangent and Cotangent.pptGraphing Trig Functions-Tangent and Cotangent.ppt
Graphing Trig Functions-Tangent and Cotangent.ppt
 
Chapter 2 - Types of a Function.pdf
Chapter 2 - Types of a Function.pdfChapter 2 - Types of a Function.pdf
Chapter 2 - Types of a Function.pdf
 
3 1 Quadratic Functions
3 1 Quadratic Functions3 1 Quadratic Functions
3 1 Quadratic Functions
 
3.10 3.11 Notes A
3.10 3.11 Notes A3.10 3.11 Notes A
3.10 3.11 Notes A
 
2021 noveno guia en casa matematicas periodo 3
2021 noveno guia en casa matematicas periodo 32021 noveno guia en casa matematicas periodo 3
2021 noveno guia en casa matematicas periodo 3
 
February 18 2016
February 18 2016February 18 2016
February 18 2016
 
Algebra 1
Algebra 1Algebra 1
Algebra 1
 
GENMATH Module 2.pptx
GENMATH Module 2.pptxGENMATH Module 2.pptx
GENMATH Module 2.pptx
 
How to graph Functions
How to graph FunctionsHow to graph Functions
How to graph Functions
 
4 4 graphingfx
4 4 graphingfx4 4 graphingfx
4 4 graphingfx
 
5HBC: How to Graph Implicit Relations Intro Packet!
5HBC: How to Graph Implicit Relations Intro Packet!5HBC: How to Graph Implicit Relations Intro Packet!
5HBC: How to Graph Implicit Relations Intro Packet!
 

More from giovanniL

Ex1 h applications
Ex1 h applicationsEx1 h applications
Ex1 h applicationsgiovanniL
 
Ex1 g invfns
Ex1 g invfnsEx1 g invfns
Ex1 g invfnsgiovanniL
 
Ex1 ef sumprdfns
Ex1 ef sumprdfnsEx1 ef sumprdfns
Ex1 ef sumprdfnsgiovanniL
 
Ex1 d modfns
Ex1 d modfnsEx1 d modfns
Ex1 d modfnsgiovanniL
 
Ex1 c fntypes
Ex1 c fntypesEx1 c fntypes
Ex1 c fntypesgiovanniL
 
Ex1 b relfns
Ex1 b relfnsEx1 b relfns
Ex1 b relfnsgiovanniL
 
Ex1 a setnotation
Ex1 a setnotationEx1 a setnotation
Ex1 a setnotationgiovanniL
 

More from giovanniL (7)

Ex1 h applications
Ex1 h applicationsEx1 h applications
Ex1 h applications
 
Ex1 g invfns
Ex1 g invfnsEx1 g invfns
Ex1 g invfns
 
Ex1 ef sumprdfns
Ex1 ef sumprdfnsEx1 ef sumprdfns
Ex1 ef sumprdfns
 
Ex1 d modfns
Ex1 d modfnsEx1 d modfns
Ex1 d modfns
 
Ex1 c fntypes
Ex1 c fntypesEx1 c fntypes
Ex1 c fntypes
 
Ex1 b relfns
Ex1 b relfnsEx1 b relfns
Ex1 b relfns
 
Ex1 a setnotation
Ex1 a setnotationEx1 a setnotation
Ex1 a setnotation
 

Ex1 d sketchlinfuncs

  • 1. Sketching linear functions The general form for linear equations (gradient–intercept form): To sketch a graph from an equation expressed in general form, follow these steps. Example 1. 𝑦 = 4𝑥 + 3 𝑦 = 𝑚𝑥 + 𝑐 𝑟𝑖𝑠𝑒 4 ∴ 𝑔𝑟𝑎𝑑𝑖𝑒𝑛𝑡 = 𝑚 = = =4 𝑟𝑢𝑛 1 𝑦 − 𝑖𝑛𝑡𝑒𝑟𝑐𝑒𝑝𝑡 = 𝑐 = 3
  • 2. sketching linear graphs using intercepts Example 2. 𝒙 𝒊𝒏𝒕𝒆𝒓𝒄𝒆𝒑𝒕 𝒚 = 𝟎 0 = 2𝑥 + 1 1 𝟏 ∴ 𝑥 = − 𝑝𝑜𝑖𝑛𝑡 → − , 𝟎 2 𝟐 𝒚 𝒊𝒏𝒕𝒆𝒓𝒄𝒆𝒑𝒕 𝒙 = 𝟎 𝑦 = 2 0 + 1 = 1 𝑝𝑜𝑖𝑛𝑡 → (𝟎, 𝟏)
  • 3. Equations and functions and the CAS calculator When you are using the TI-Nspire CAS calculator to draw the graphs of functions, the equations must be entered into the calculator using fn(x) On a Graphs page, complete the function entry line as: f 1(x) = 2x + 1 Then press ENTER· to draw the graph. To find the y-intercept, press: • Menu b • 5:Trace 5 • 1:Graph Trace 1 The y-intercept will be displayed. Press ENTER · to lock the coordinates into place.