Graph linear equations worksheet
•Download as DOCX, PDF•
1 like•669 views
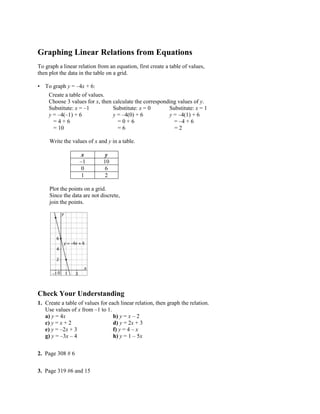
To graph a linear relation from an equation, first create a table of values by substituting different values for the variable x into the equation and calculating the corresponding y values. Then plot the points from the table on a graph grid and connect them with a straight line. The document provides an example of graphing the equation y = -4x + 6 by creating a table with x values of -1, 0, and 1 and the corresponding y values. It also includes practice problems asking the reader to graph other linear equations by first making tables of x and y values.
Report
Share
Report
Share
Recommended
2.8 Absolute Value Functions
The document discusses absolute value functions. Absolute value functions have a V-shaped graph, with the vertex located at the point (h, k) in the general form y = a|x - h| + k. When a > 0 the graph opens up, and when a < 0 the graph opens down. The size of a determines whether the graph is wider or narrower than y = |x|. Examples are provided to demonstrate graphing and writing absolute value functions.
Systems of Equations Lecture
This document discusses three methods for solving systems of equations: graphing, substitution, and elimination. The graphing method involves finding the intersection of two graphs. Substitution involves rewriting one variable in terms of the other. Elimination involves canceling out a variable by making coefficients of that variable equal between equations. While substitution and elimination work best when equations are already in a certain form, any method can be used to solve systems as needed by manipulating the equations.
Co-factor matrix..
The document describes the cofactor method for finding the inverse of a matrix A. It defines the cofactor Cij as the signed determinant of the matrix made by removing row i and column j from A. The inverse is then given by the transpose of the matrix of cofactors divided by the determinant of A. An example calculates the inverse of the 2x2 matrix A = [a, c; b, d] using this method.
MATRICES
For FREE MCA REAL MOCK TEST,Click on the given link :
http://www.tcyonline.com/india/mca_preparation.php
Matrices ppt
Here are the key steps to find the eigenvalues of the given matrix:
1) Write the characteristic equation: det(A - λI) = 0
2) Expand the determinant: (1-λ)(-2-λ) - 4 = 0
3) Simplify and factor: λ(λ + 1)(λ + 2) = 0
4) Find the roots: λ1 = 0, λ2 = -1, λ3 = -2
Therefore, the eigenvalues of the given matrix are -1 and -2.
Determinants
The document discusses determinants and their properties. It defines determinants as representing single numbers obtained by multiplying and adding matrix elements in a special way. It then provides formulas for calculating determinants of matrices of order 1, 2 and 3. It also outlines several properties of determinants, such as how interchanging rows/columns, multiplying rows by constants, and adding rows affects the determinant. Finally, it discusses how determinants are used to determine whether systems of linear equations are consistent or inconsistent.
Math 4 6
This document discusses key concepts for graphing linear equations including functions, inputs, outputs, domains, ranges, and different types of equations that produce linear, quadratic, or absolute value graphs. It defines linear equations as having variables that are never squared and provides examples of linear equations. It also describes how quadratic equations with squared x and y variables will produce circular graphs while absolute value equations create V-shaped graphs.
Matrix Operations
A matrix is a rectangular arrangement of numbers organized in rows and columns. The order of a matrix refers to the number of rows and columns it contains. Entries are the individual numbers within the matrix. Basic matrix operations include addition, subtraction, scalar multiplication, and multiplication. To add or subtract matrices, they must be the same order, while scalar multiplication multiplies each entry of the matrix by the scalar.
Matrix and its operation (addition, subtraction, multiplication)
This document summarizes matrix operations including addition, subtraction, and multiplication. It defines a matrix as a rectangular arrangement of numbers in rows and columns. Matrix addition and subtraction can only be done on matrices with the same dimensions, by adding or subtracting the corresponding elements. Matrix multiplication involves multiplying the rows of the first matrix with the columns of the second matrix and summing the products to form the elements of the resulting matrix. Examples are provided to illustrate each operation.
Ppt on matrices and Determinants
Matrices can be added, subtracted, and multiplied under certain conditions.
Addition and subtraction require matrices to be the same size.
Matrix multiplication requires the number of columns of the first matrix to equal the number of rows of the second matrix.
Matrices can also be multiplied by scalars.
Matrix and its operations
Matrices can be added, subtracted, and multiplied according to certain rules.
- Matrices can only be added or subtracted if they are the same size. The sum or difference of matrices A and B yields a matrix C of the same size.
- Matrices can be multiplied by a scalar. Multiplying a matrix A by a scalar k results in a new matrix kA where each element is multiplied by k.
- Matrix multiplication allows combining information from two matrices but has specific rules regarding the dimensions of the matrices.
Singular and non singular matrix
1) A singular matrix has a determinant of 0, while a non-singular matrix has a non-zero determinant.
2) A symmetric matrix is equal to its transpose, while a skew-symmetric matrix is equal to the negative of its transpose.
3) The adjoint of a matrix is obtained by swapping diagonal entries and changing the sign of non-diagonal entries. For 3x3 matrices, the adjoint is the transpose of the cofactors.
4.6 notes
Two variables show direct variation if their relationship can be written in the form y=ax, where a is the constant of variation. Direct variation equations represent relationships where one variable varies directly as the other changes. To determine if an equation represents direct variation, substitute coordinates to solve for the constant a and rewrite the equation in the form y=ax. The constant of variation and the graphs of direct variation equations can then be used to find output values for given input values.
ws2 Linear Equation
This document contains a series of problems involving plotting linear equations on a graph. It asks the student to plot equations like y = x + 2 and y = 3x on graph paper using suitable x- and y-axis scales. It also contains problems involving finding the coordinates of line intersections, completing tables of x- and y-values from linear equations, and constructing lines from equations by finding x- and y-intercepts.
M a t r i k s
1. The document discusses various types and operations of matrices including transpose, similarity, inverse, and determinant of matrices.
2. It also discusses using matrices to solve systems of linear equations by finding the inverse of the coefficient matrix or calculating the determinant.
3. The key matrix concepts covered are matrix notation, types of matrices, matrix addition/subtraction, multiplication, and using matrices to represent and solve linear systems.
Teaching Graphs of Polynomial Functions
This presentation helps the user to Examine the graph of polynomial functions with the use of Geogebra Application.
Introduction of matrix
The document defines various types of matrices including row vectors, column vectors, submatrices, square matrices, triangular matrices, diagonal matrices, identity matrices, zero matrices, and diagonally dominant matrices. It provides examples of each type of matrix. It also discusses when two matrices are considered equal, which is when they have the same size and corresponding elements are equal.
Matrices & Determinants
This presentation describes Matrices and Determinants in detail including all the relevant definitions with examples, various concepts and the practice problems.
Matrices
This document provides an overview of matrices including:
- How to describe matrices using m rows and n columns
- Common types of matrices such as row, column, zero, square, diagonal, and unit matrices
- Basic matrix operations including addition, subtraction, scalar multiplication
- Rules for matrix multiplication including that matrices must be conformable
- The transpose of a matrix which is obtained by interchanging rows and columns
- Properties of transposed matrices including (A+B)T = AT + BT and (AB)T = BTAT
Graphing, Slope, And Special Lines
This document discusses graphing linear equations and determining slope. It provides examples of graphing lines with given equations like y = 2x - 4 and finding the slopes between points. Special lines like horizontal and vertical lines are examined, where horizontal lines have a slope of 0 and vertical lines are undefined. Pairs of lines are graphed and observed to have the same or opposite slopes based on their equations. In conclusion, the slope is important in graphing linear equations and representing the steepness of inclined lines.
Linear functions and modeling
This document discusses linear functions and mathematical modeling. It defines linear functions as having a constant rate of change and being represented by the equation y=mx+b. The document shows how to determine if a dataset represents a linear function by calculating the rate of change. It also discusses using linear models to make predictions by extrapolating or interpolating data points. Guidelines for evaluating the reliability of linear trendlines for prediction are provided.
Algebraic Properties of Matrix Operations
Algebraic Properties of Matrix Operations
The m x n matrix with all entries of zero is denoted by 푶_풎풏 , for a matrix A of size m x n, we have:
Matrices
The document provides an overview of a lecture covering matrices, matrix algebra, vectors, homogeneous coordinates, and transformations in homogeneous coordinates. Key points include: matrices are arrays of numbers; operations on matrices include addition, multiplication by a scalar, and multiplication; vectors can represent points in space as column or row matrices; homogeneous coordinates allow points to be represented by 4D vectors, enabling translations and other transformations to be described by 4x4 matrices. This provides a unified approach for combining multiple transformations.
Presentation on matrix
The document presents information on matrices, including:
- Definitions of matrices as rectangular arrangements of numbers arranged in rows and columns
- Common matrix operations such as addition, subtraction, scalar multiplication, and matrix multiplication
- Determinants and inverses of matrices
- How matrices can represent systems of linear equations
- Unique properties of matrices, such as the product of two non-zero matrices possibly being zero
- Applications of matrices in fields like geology, statistics, economics, and animation
Matrix Algebra seminar ppt
It contains the basics of matrix which includes matrix definition,types of matrices,operations on matrices,transpose of matrix,symmetric and skew symmetric matrix,invertible matrix,
application of matrix.
MATRICES
This document defines and describes different types of matrices including:
- Upper and lower triangular matrices
- Determinants which are scalars obtained from products of matrix elements according to constraints
- Band matrices which are sparse matrices with nonzero elements confined to diagonals
- Transpose matrices which exchange the rows and columns of a matrix
- Inverse matrices which when multiplied by the original matrix produce the identity matrix
Business mathametics and statistics b.com ii semester (2)
introduction to business statistics, various measures of statistics like mean ,mode , mode, dispersion and business mathematics aswell.
More Related Content
What's hot
Matrix and its operation (addition, subtraction, multiplication)
This document summarizes matrix operations including addition, subtraction, and multiplication. It defines a matrix as a rectangular arrangement of numbers in rows and columns. Matrix addition and subtraction can only be done on matrices with the same dimensions, by adding or subtracting the corresponding elements. Matrix multiplication involves multiplying the rows of the first matrix with the columns of the second matrix and summing the products to form the elements of the resulting matrix. Examples are provided to illustrate each operation.
Ppt on matrices and Determinants
Matrices can be added, subtracted, and multiplied under certain conditions.
Addition and subtraction require matrices to be the same size.
Matrix multiplication requires the number of columns of the first matrix to equal the number of rows of the second matrix.
Matrices can also be multiplied by scalars.
Matrix and its operations
Matrices can be added, subtracted, and multiplied according to certain rules.
- Matrices can only be added or subtracted if they are the same size. The sum or difference of matrices A and B yields a matrix C of the same size.
- Matrices can be multiplied by a scalar. Multiplying a matrix A by a scalar k results in a new matrix kA where each element is multiplied by k.
- Matrix multiplication allows combining information from two matrices but has specific rules regarding the dimensions of the matrices.
Singular and non singular matrix
1) A singular matrix has a determinant of 0, while a non-singular matrix has a non-zero determinant.
2) A symmetric matrix is equal to its transpose, while a skew-symmetric matrix is equal to the negative of its transpose.
3) The adjoint of a matrix is obtained by swapping diagonal entries and changing the sign of non-diagonal entries. For 3x3 matrices, the adjoint is the transpose of the cofactors.
4.6 notes
Two variables show direct variation if their relationship can be written in the form y=ax, where a is the constant of variation. Direct variation equations represent relationships where one variable varies directly as the other changes. To determine if an equation represents direct variation, substitute coordinates to solve for the constant a and rewrite the equation in the form y=ax. The constant of variation and the graphs of direct variation equations can then be used to find output values for given input values.
ws2 Linear Equation
This document contains a series of problems involving plotting linear equations on a graph. It asks the student to plot equations like y = x + 2 and y = 3x on graph paper using suitable x- and y-axis scales. It also contains problems involving finding the coordinates of line intersections, completing tables of x- and y-values from linear equations, and constructing lines from equations by finding x- and y-intercepts.
M a t r i k s
1. The document discusses various types and operations of matrices including transpose, similarity, inverse, and determinant of matrices.
2. It also discusses using matrices to solve systems of linear equations by finding the inverse of the coefficient matrix or calculating the determinant.
3. The key matrix concepts covered are matrix notation, types of matrices, matrix addition/subtraction, multiplication, and using matrices to represent and solve linear systems.
Teaching Graphs of Polynomial Functions
This presentation helps the user to Examine the graph of polynomial functions with the use of Geogebra Application.
Introduction of matrix
The document defines various types of matrices including row vectors, column vectors, submatrices, square matrices, triangular matrices, diagonal matrices, identity matrices, zero matrices, and diagonally dominant matrices. It provides examples of each type of matrix. It also discusses when two matrices are considered equal, which is when they have the same size and corresponding elements are equal.
Matrices & Determinants
This presentation describes Matrices and Determinants in detail including all the relevant definitions with examples, various concepts and the practice problems.
Matrices
This document provides an overview of matrices including:
- How to describe matrices using m rows and n columns
- Common types of matrices such as row, column, zero, square, diagonal, and unit matrices
- Basic matrix operations including addition, subtraction, scalar multiplication
- Rules for matrix multiplication including that matrices must be conformable
- The transpose of a matrix which is obtained by interchanging rows and columns
- Properties of transposed matrices including (A+B)T = AT + BT and (AB)T = BTAT
Graphing, Slope, And Special Lines
This document discusses graphing linear equations and determining slope. It provides examples of graphing lines with given equations like y = 2x - 4 and finding the slopes between points. Special lines like horizontal and vertical lines are examined, where horizontal lines have a slope of 0 and vertical lines are undefined. Pairs of lines are graphed and observed to have the same or opposite slopes based on their equations. In conclusion, the slope is important in graphing linear equations and representing the steepness of inclined lines.
Linear functions and modeling
This document discusses linear functions and mathematical modeling. It defines linear functions as having a constant rate of change and being represented by the equation y=mx+b. The document shows how to determine if a dataset represents a linear function by calculating the rate of change. It also discusses using linear models to make predictions by extrapolating or interpolating data points. Guidelines for evaluating the reliability of linear trendlines for prediction are provided.
Algebraic Properties of Matrix Operations
Algebraic Properties of Matrix Operations
The m x n matrix with all entries of zero is denoted by 푶_풎풏 , for a matrix A of size m x n, we have:
Matrices
The document provides an overview of a lecture covering matrices, matrix algebra, vectors, homogeneous coordinates, and transformations in homogeneous coordinates. Key points include: matrices are arrays of numbers; operations on matrices include addition, multiplication by a scalar, and multiplication; vectors can represent points in space as column or row matrices; homogeneous coordinates allow points to be represented by 4D vectors, enabling translations and other transformations to be described by 4x4 matrices. This provides a unified approach for combining multiple transformations.
Presentation on matrix
The document presents information on matrices, including:
- Definitions of matrices as rectangular arrangements of numbers arranged in rows and columns
- Common matrix operations such as addition, subtraction, scalar multiplication, and matrix multiplication
- Determinants and inverses of matrices
- How matrices can represent systems of linear equations
- Unique properties of matrices, such as the product of two non-zero matrices possibly being zero
- Applications of matrices in fields like geology, statistics, economics, and animation
Matrix Algebra seminar ppt
It contains the basics of matrix which includes matrix definition,types of matrices,operations on matrices,transpose of matrix,symmetric and skew symmetric matrix,invertible matrix,
application of matrix.
MATRICES
This document defines and describes different types of matrices including:
- Upper and lower triangular matrices
- Determinants which are scalars obtained from products of matrix elements according to constraints
- Band matrices which are sparse matrices with nonzero elements confined to diagonals
- Transpose matrices which exchange the rows and columns of a matrix
- Inverse matrices which when multiplied by the original matrix produce the identity matrix
Business mathametics and statistics b.com ii semester (2)
introduction to business statistics, various measures of statistics like mean ,mode , mode, dispersion and business mathematics aswell.
What's hot (19)
Matrix and its operation (addition, subtraction, multiplication)
Matrix and its operation (addition, subtraction, multiplication)
Business mathametics and statistics b.com ii semester (2)
Business mathametics and statistics b.com ii semester (2)
More from marniekrentz
6.2 parallel and perpendicular slopes
The document discusses the benefits of exercise for mental health. Regular physical activity can help reduce anxiety and depression and improve mood and cognitive functioning. Exercise causes chemical changes in the brain that may help protect against mental illness and improve symptoms.
4.3 simplify radicals
The document discusses the benefits of exercise for mental health. Regular physical activity can help reduce anxiety and depression and improve mood and cognitive functioning. Exercise causes chemical changes in the brain that may help alleviate symptoms of mental illness and boost overall mental well-being.
4.2 irrational numbers
The document discusses the benefits of exercise for mental health. Regular physical activity can help reduce anxiety and depression and improve mood and cognitive functioning. Exercise causes chemical changes in the brain that may help boost feelings of calmness, happiness and focus.
4.4 fractional exponents
The document discusses the benefits of exercise for mental health. Regular physical activity can help reduce anxiety and depression and improve mood and cognitive functioning. Exercise causes chemical changes in the brain that may help protect against mental illness and improve symptoms.
More from marniekrentz (20)
Recently uploaded
BBR 2024 Summer Sessions Interview Training
Qualitative research interview training by Professor Katrina Pritchard and Dr Helen Williams
RHEOLOGY Physical pharmaceutics-II notes for B.pharm 4th sem students
Physical pharmaceutics notes for B.pharm students
BÀI TẬP BỔ TRỢ TIẾNG ANH LỚP 9 CẢ NĂM - GLOBAL SUCCESS - NĂM HỌC 2024-2025 - ...
BÀI TẬP BỔ TRỢ TIẾNG ANH LỚP 9 CẢ NĂM - GLOBAL SUCCESS - NĂM HỌC 2024-2025 - ...Nguyen Thanh Tu Collection
https://app.box.com/s/tacvl9ekroe9hqupdnjruiypvm9rdaneISO/IEC 27001, ISO/IEC 42001, and GDPR: Best Practices for Implementation and...
Denis is a dynamic and results-driven Chief Information Officer (CIO) with a distinguished career spanning information systems analysis and technical project management. With a proven track record of spearheading the design and delivery of cutting-edge Information Management solutions, he has consistently elevated business operations, streamlined reporting functions, and maximized process efficiency.
Certified as an ISO/IEC 27001: Information Security Management Systems (ISMS) Lead Implementer, Data Protection Officer, and Cyber Risks Analyst, Denis brings a heightened focus on data security, privacy, and cyber resilience to every endeavor.
His expertise extends across a diverse spectrum of reporting, database, and web development applications, underpinned by an exceptional grasp of data storage and virtualization technologies. His proficiency in application testing, database administration, and data cleansing ensures seamless execution of complex projects.
What sets Denis apart is his comprehensive understanding of Business and Systems Analysis technologies, honed through involvement in all phases of the Software Development Lifecycle (SDLC). From meticulous requirements gathering to precise analysis, innovative design, rigorous development, thorough testing, and successful implementation, he has consistently delivered exceptional results.
Throughout his career, he has taken on multifaceted roles, from leading technical project management teams to owning solutions that drive operational excellence. His conscientious and proactive approach is unwavering, whether he is working independently or collaboratively within a team. His ability to connect with colleagues on a personal level underscores his commitment to fostering a harmonious and productive workplace environment.
Date: May 29, 2024
Tags: Information Security, ISO/IEC 27001, ISO/IEC 42001, Artificial Intelligence, GDPR
-------------------------------------------------------------------------------
Find out more about ISO training and certification services
Training: ISO/IEC 27001 Information Security Management System - EN | PECB
ISO/IEC 42001 Artificial Intelligence Management System - EN | PECB
General Data Protection Regulation (GDPR) - Training Courses - EN | PECB
Webinars: https://pecb.com/webinars
Article: https://pecb.com/article
-------------------------------------------------------------------------------
For more information about PECB:
Website: https://pecb.com/
LinkedIn: https://www.linkedin.com/company/pecb/
Facebook: https://www.facebook.com/PECBInternational/
Slideshare: http://www.slideshare.net/PECBCERTIFICATION
LAND USE LAND COVER AND NDVI OF MIRZAPUR DISTRICT, UP
This Dissertation explores the particular circumstances of Mirzapur, a region located in the
core of India. Mirzapur, with its varied terrains and abundant biodiversity, offers an optimal
environment for investigating the changes in vegetation cover dynamics. Our study utilizes
advanced technologies such as GIS (Geographic Information Systems) and Remote sensing to
analyze the transformations that have taken place over the course of a decade.
The complex relationship between human activities and the environment has been the focus
of extensive research and worry. As the global community grapples with swift urbanization,
population expansion, and economic progress, the effects on natural ecosystems are becoming
more evident. A crucial element of this impact is the alteration of vegetation cover, which plays a
significant role in maintaining the ecological equilibrium of our planet.Land serves as the foundation for all human activities and provides the necessary materials for
these activities. As the most crucial natural resource, its utilization by humans results in different
'Land uses,' which are determined by both human activities and the physical characteristics of the
land.
The utilization of land is impacted by human needs and environmental factors. In countries
like India, rapid population growth and the emphasis on extensive resource exploitation can lead
to significant land degradation, adversely affecting the region's land cover.
Therefore, human intervention has significantly influenced land use patterns over many
centuries, evolving its structure over time and space. In the present era, these changes have
accelerated due to factors such as agriculture and urbanization. Information regarding land use and
cover is essential for various planning and management tasks related to the Earth's surface,
providing crucial environmental data for scientific, resource management, policy purposes, and
diverse human activities.
Accurate understanding of land use and cover is imperative for the development planning
of any area. Consequently, a wide range of professionals, including earth system scientists, land
and water managers, and urban planners, are interested in obtaining data on land use and cover
changes, conversion trends, and other related patterns. The spatial dimensions of land use and
cover support policymakers and scientists in making well-informed decisions, as alterations in
these patterns indicate shifts in economic and social conditions. Monitoring such changes with the
help of Advanced technologies like Remote Sensing and Geographic Information Systems is
crucial for coordinated efforts across different administrative levels. Advanced technologies like
Remote Sensing and Geographic Information Systems
9
Changes in vegetation cover refer to variations in the distribution, composition, and overall
structure of plant communities across different temporal and spatial scales. These changes can
occur natural.
Pollock and Snow "DEIA in the Scholarly Landscape, Session One: Setting Expec...
Pollock and Snow "DEIA in the Scholarly Landscape, Session One: Setting Expec...National Information Standards Organization (NISO)
This presentation was provided by Steph Pollock of The American Psychological Association’s Journals Program, and Damita Snow, of The American Society of Civil Engineers (ASCE), for the initial session of NISO's 2024 Training Series "DEIA in the Scholarly Landscape." Session One: 'Setting Expectations: a DEIA Primer,' was held June 6, 2024.How to Add Chatter in the odoo 17 ERP Module
In Odoo, the chatter is like a chat tool that helps you work together on records. You can leave notes and track things, making it easier to talk with your team and partners. Inside chatter, all communication history, activity, and changes will be displayed.
What is Digital Literacy? A guest blog from Andy McLaughlin, University of Ab...
What is Digital Literacy? A guest blog from Andy McLaughlin, University of Aberdeen
Chapter 4 - Islamic Financial Institutions in Malaysia.pptx
Chapter 4 - Islamic Financial Institutions in Malaysia.pptxMohd Adib Abd Muin, Senior Lecturer at Universiti Utara Malaysia
This slide is special for master students (MIBS & MIFB) in UUM. Also useful for readers who are interested in the topic of contemporary Islamic banking.
বাংলাদেশ অর্থনৈতিক সমীক্ষা (Economic Review) ২০২৪ UJS App.pdf
বাংলাদেশের অর্থনৈতিক সমীক্ষা ২০২৪ [Bangladesh Economic Review 2024 Bangla.pdf] কম্পিউটার , ট্যাব ও স্মার্ট ফোন ভার্সন সহ সম্পূর্ণ বাংলা ই-বুক বা pdf বই " সুচিপত্র ...বুকমার্ক মেনু 🔖 ও হাইপার লিংক মেনু 📝👆 যুক্ত ..
আমাদের সবার জন্য খুব খুব গুরুত্বপূর্ণ একটি বই ..বিসিএস, ব্যাংক, ইউনিভার্সিটি ভর্তি ও যে কোন প্রতিযোগিতা মূলক পরীক্ষার জন্য এর খুব ইম্পরট্যান্ট একটি বিষয় ...তাছাড়া বাংলাদেশের সাম্প্রতিক যে কোন ডাটা বা তথ্য এই বইতে পাবেন ...
তাই একজন নাগরিক হিসাবে এই তথ্য গুলো আপনার জানা প্রয়োজন ...।
বিসিএস ও ব্যাংক এর লিখিত পরীক্ষা ...+এছাড়া মাধ্যমিক ও উচ্চমাধ্যমিকের স্টুডেন্টদের জন্য অনেক কাজে আসবে ...
Hindi varnamala | hindi alphabet PPT.pdf
हिंदी वर्णमाला पीपीटी, hindi alphabet PPT presentation, hindi varnamala PPT, Hindi Varnamala pdf, हिंदी स्वर, हिंदी व्यंजन, sikhiye hindi varnmala, dr. mulla adam ali, hindi language and literature, hindi alphabet with drawing, hindi alphabet pdf, hindi varnamala for childrens, hindi language, hindi varnamala practice for kids, https://www.drmullaadamali.com
How to Manage Your Lost Opportunities in Odoo 17 CRM
Odoo 17 CRM allows us to track why we lose sales opportunities with "Lost Reasons." This helps analyze our sales process and identify areas for improvement. Here's how to configure lost reasons in Odoo 17 CRM
Exploiting Artificial Intelligence for Empowering Researchers and Faculty, In...
Exploiting Artificial Intelligence for Empowering Researchers and Faculty, In...Dr. Vinod Kumar Kanvaria
Exploiting Artificial Intelligence for Empowering Researchers and Faculty,
International FDP on Fundamentals of Research in Social Sciences
at Integral University, Lucknow, 06.06.2024
By Dr. Vinod Kumar KanvariaRecently uploaded (20)
RHEOLOGY Physical pharmaceutics-II notes for B.pharm 4th sem students
RHEOLOGY Physical pharmaceutics-II notes for B.pharm 4th sem students
BÀI TẬP BỔ TRỢ TIẾNG ANH LỚP 9 CẢ NĂM - GLOBAL SUCCESS - NĂM HỌC 2024-2025 - ...
BÀI TẬP BỔ TRỢ TIẾNG ANH LỚP 9 CẢ NĂM - GLOBAL SUCCESS - NĂM HỌC 2024-2025 - ...
ISO/IEC 27001, ISO/IEC 42001, and GDPR: Best Practices for Implementation and...
ISO/IEC 27001, ISO/IEC 42001, and GDPR: Best Practices for Implementation and...
LAND USE LAND COVER AND NDVI OF MIRZAPUR DISTRICT, UP
LAND USE LAND COVER AND NDVI OF MIRZAPUR DISTRICT, UP
Pollock and Snow "DEIA in the Scholarly Landscape, Session One: Setting Expec...
Pollock and Snow "DEIA in the Scholarly Landscape, Session One: Setting Expec...
What is Digital Literacy? A guest blog from Andy McLaughlin, University of Ab...
What is Digital Literacy? A guest blog from Andy McLaughlin, University of Ab...
Chapter 4 - Islamic Financial Institutions in Malaysia.pptx
Chapter 4 - Islamic Financial Institutions in Malaysia.pptx
বাংলাদেশ অর্থনৈতিক সমীক্ষা (Economic Review) ২০২৪ UJS App.pdf
বাংলাদেশ অর্থনৈতিক সমীক্ষা (Economic Review) ২০২৪ UJS App.pdf
How to Manage Your Lost Opportunities in Odoo 17 CRM
How to Manage Your Lost Opportunities in Odoo 17 CRM
Liberal Approach to the Study of Indian Politics.pdf
Liberal Approach to the Study of Indian Politics.pdf
Exploiting Artificial Intelligence for Empowering Researchers and Faculty, In...
Exploiting Artificial Intelligence for Empowering Researchers and Faculty, In...
Digital Artefact 1 - Tiny Home Environmental Design
Digital Artefact 1 - Tiny Home Environmental Design
Graph linear equations worksheet
- 1. Graphing Linear Relations from Equations<br />To graph a linear relation from an equation, first create a table of values, then plot the data in the table on a grid.<br />•To graph y = –4x + 6:<br />Create a table of values.<br />Choose 3 values for x, then calculate the corresponding values of y.<br />Substitute: x = –1Substitute: x = 0Substitute: x = 1<br />y = –4(–1) + 6y = –4(0) + 6y = –4(1) + 6<br />= 4 + 6 = 0 + 6= –4 + 6<br />= 10= 6= 2<br />Write the values of x and y in a table.<br />xy–1100612<br />Plot the points on a grid.<br />Since the data are not discrete,<br />join the points.<br />Check Your Understanding<br />1.Create a table of values for each linear relation, then graph the relation.Use values of x from –1 to 1.a) y = 4xb) y = x – 2c) y = x + 2d) y = 2x + 3e) y = –2x + 3f) y = 4 – xg) y = –3x – 4h) y = 1 – 5x<br />2. Page 308 # 6<br />3. Page 319 #6 and 15<br />