Download as PDF, PPTX


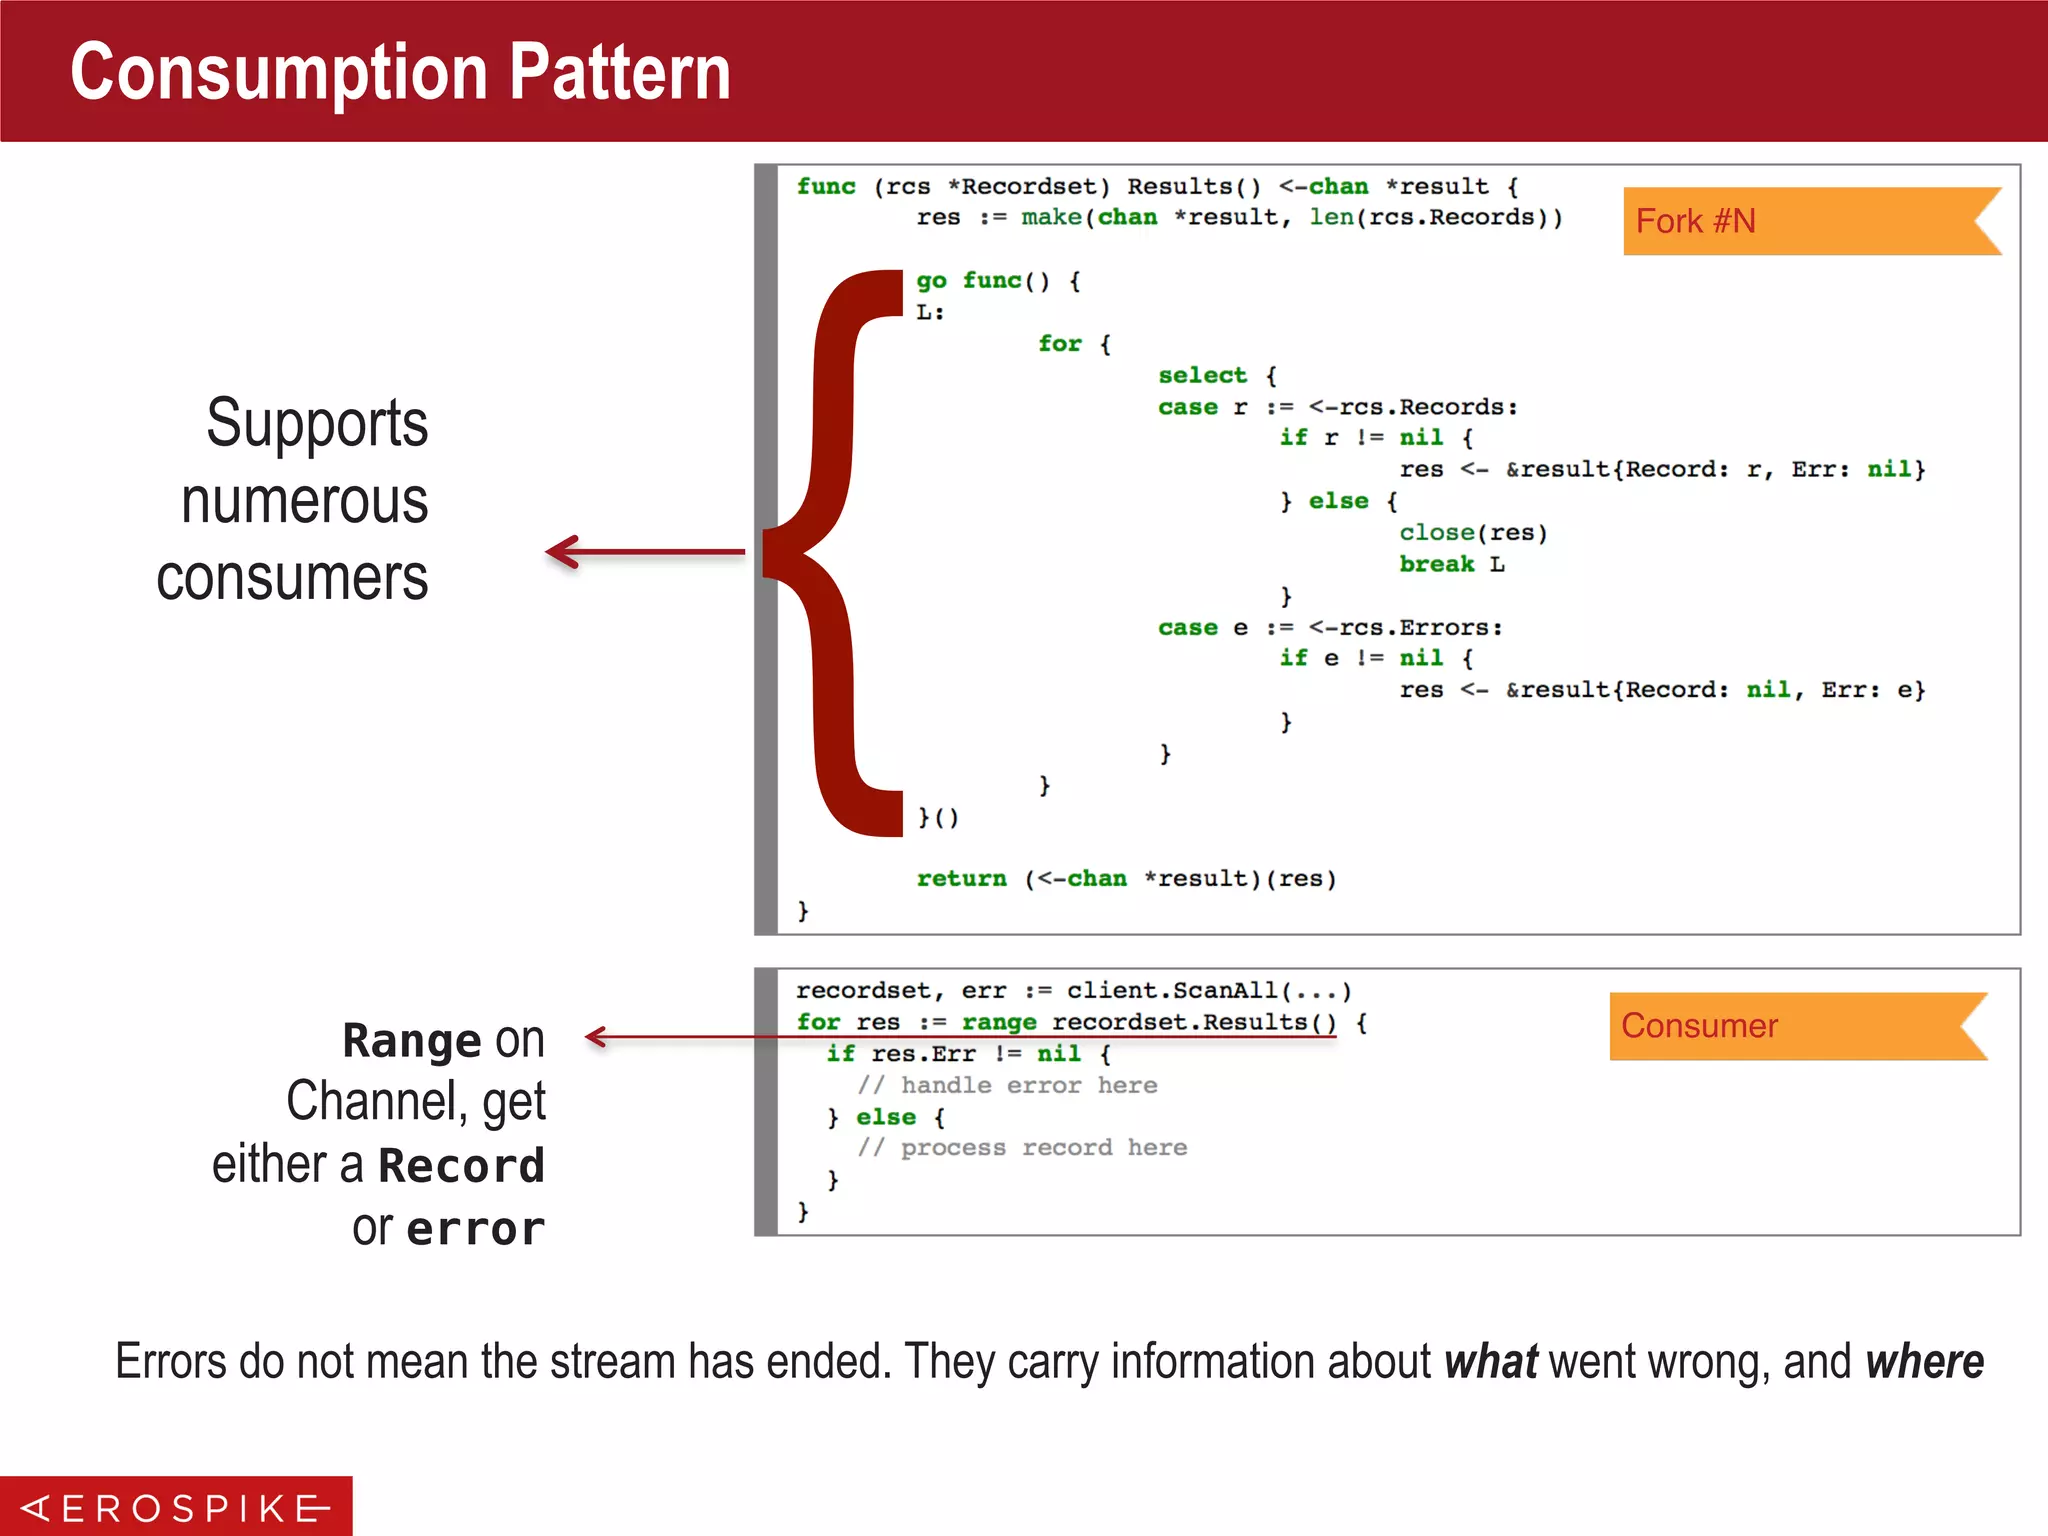
![func NewCluster(policy *ClientPolicy, hosts []*Host) (*Cluster, error) {
newCluster := &Cluster{...}
// start up cluster maintenance go routine
newCluster.wgTend.Add(1)
go newCluster.clusterBoss(policy)
return newCluster, nil
}
func (clstr *Cluster) clusterBoss(policy *ClientPolicy) {
defer clstr.wgTend.Done()
Loop:
for {
select {
case <-clstr.tendChannel:
// tend channel closed
break Loop
case <-time.After(tendInterval):
if err := clstr.tend(); err != nil {
Logger.Warn(err.Error())
}
}
}
// cleanup code goes here
// close the nodes, ...
}
func (clstr *Cluster) Close() {
if !clstr.closed.Get() {
// send close signal to maintenance channel
close(clstr.tendChannel)
// wait until tend is over
clstr.wgTend.Wait()
}
}
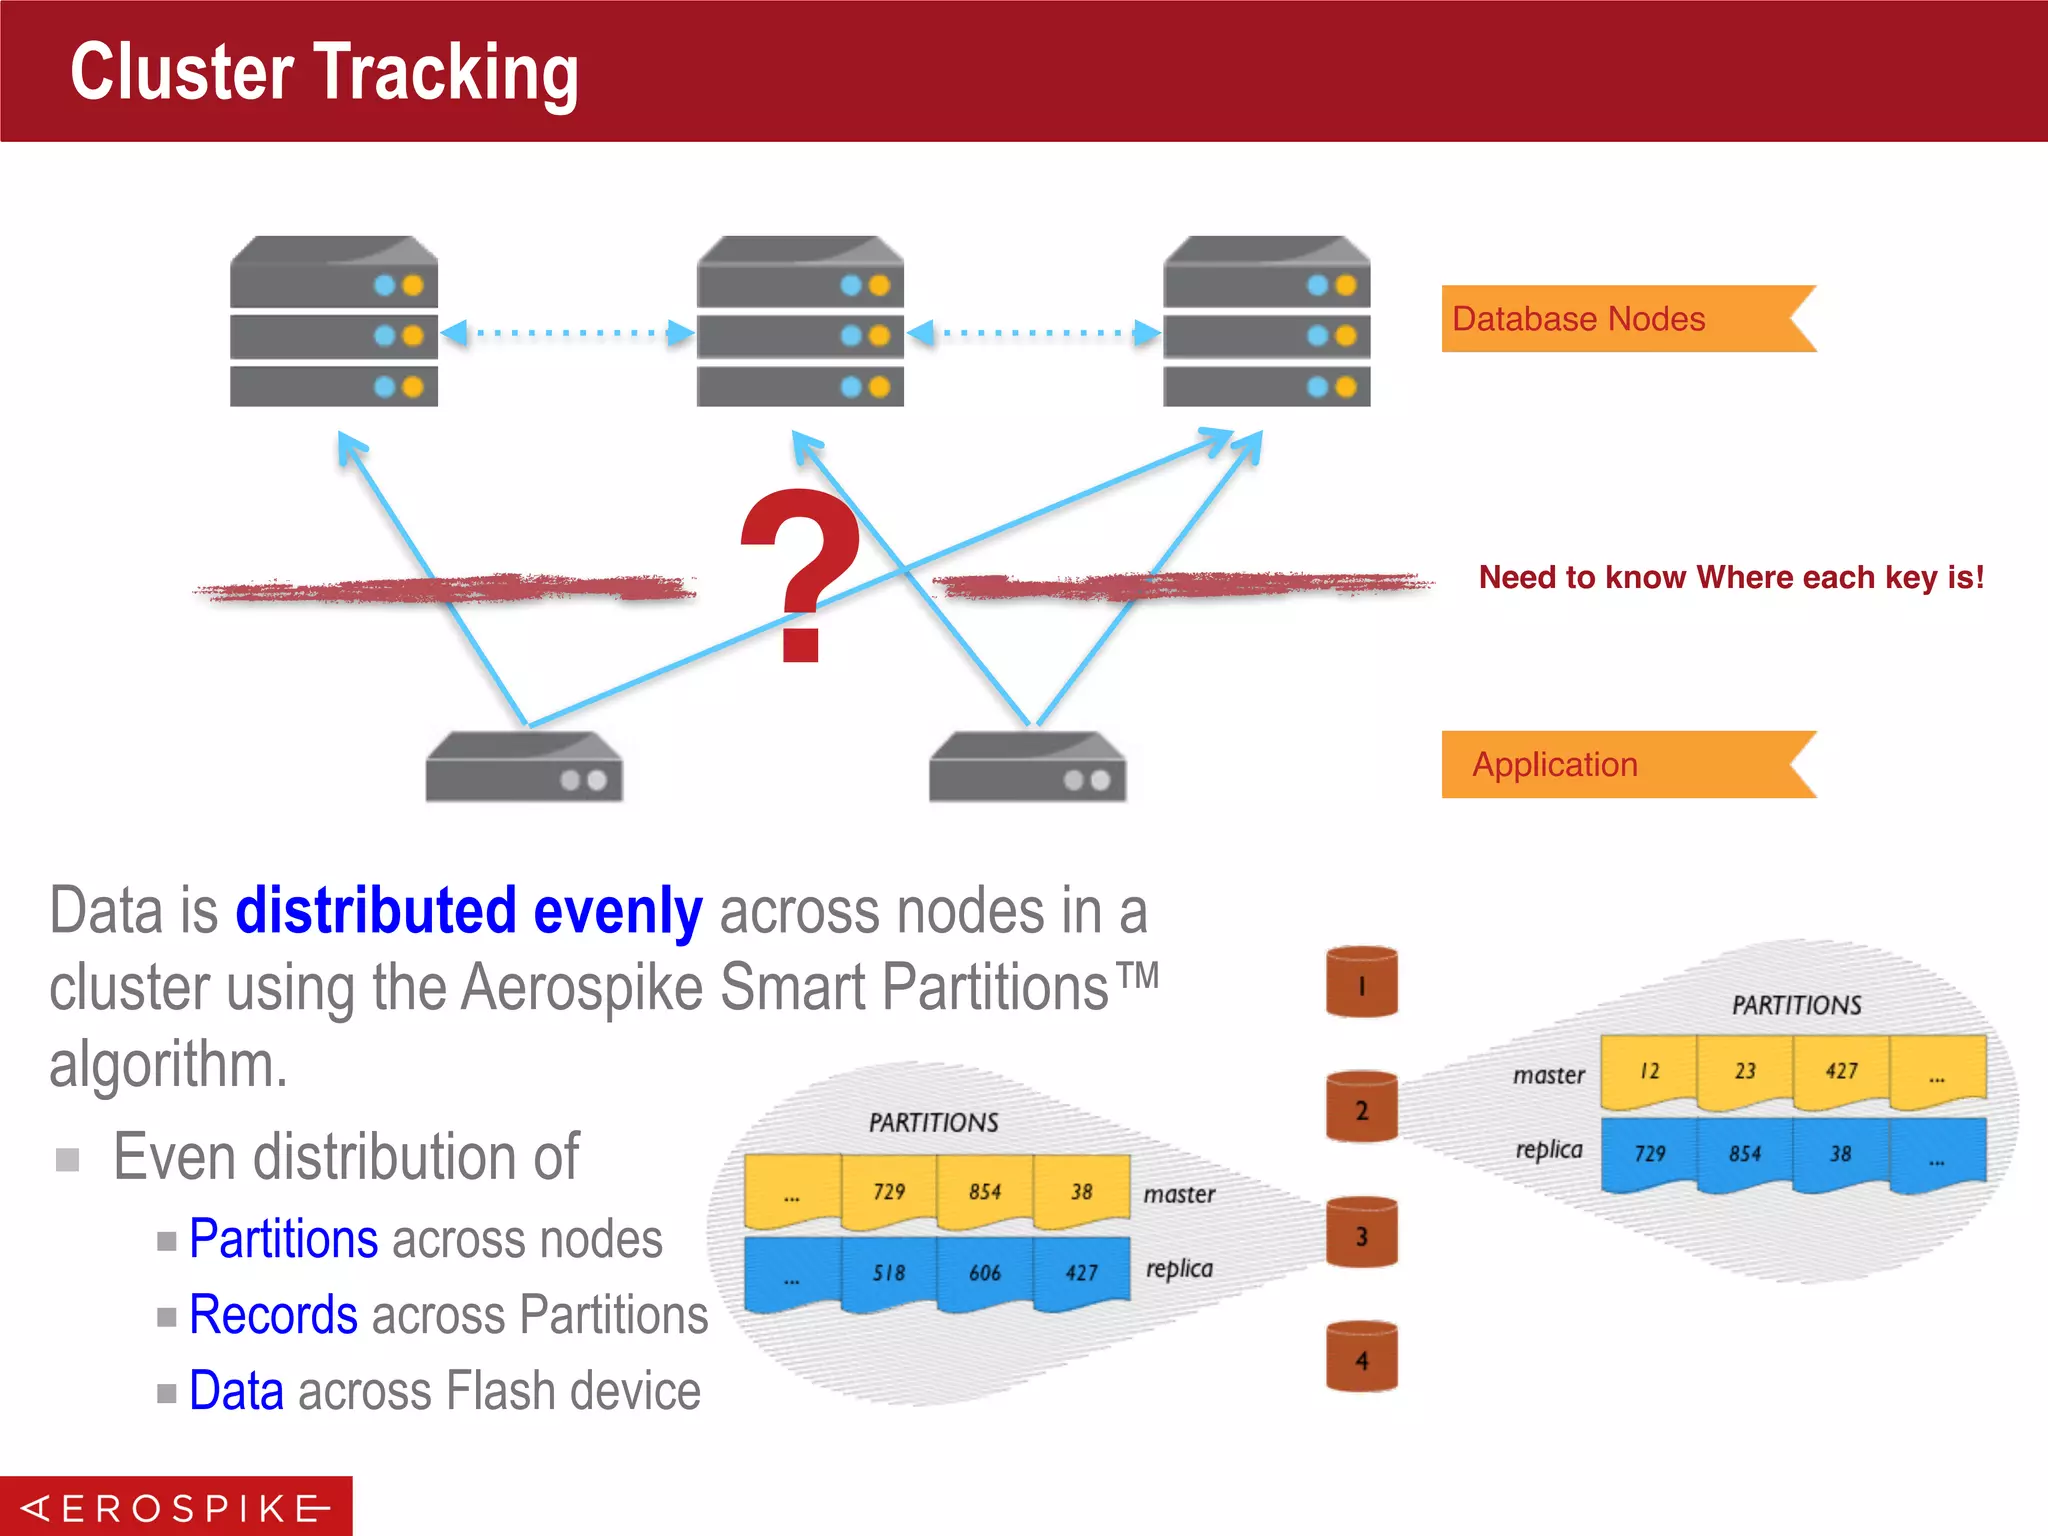
Cluster Tracking
Spawn Goroutine To
Track Cluster Changes
{](https://image.slidesharecdn.com/gopherconindia-150224102953-conversion-gate01/75/Aerospike-Go-Language-Client-16-2048.jpg)
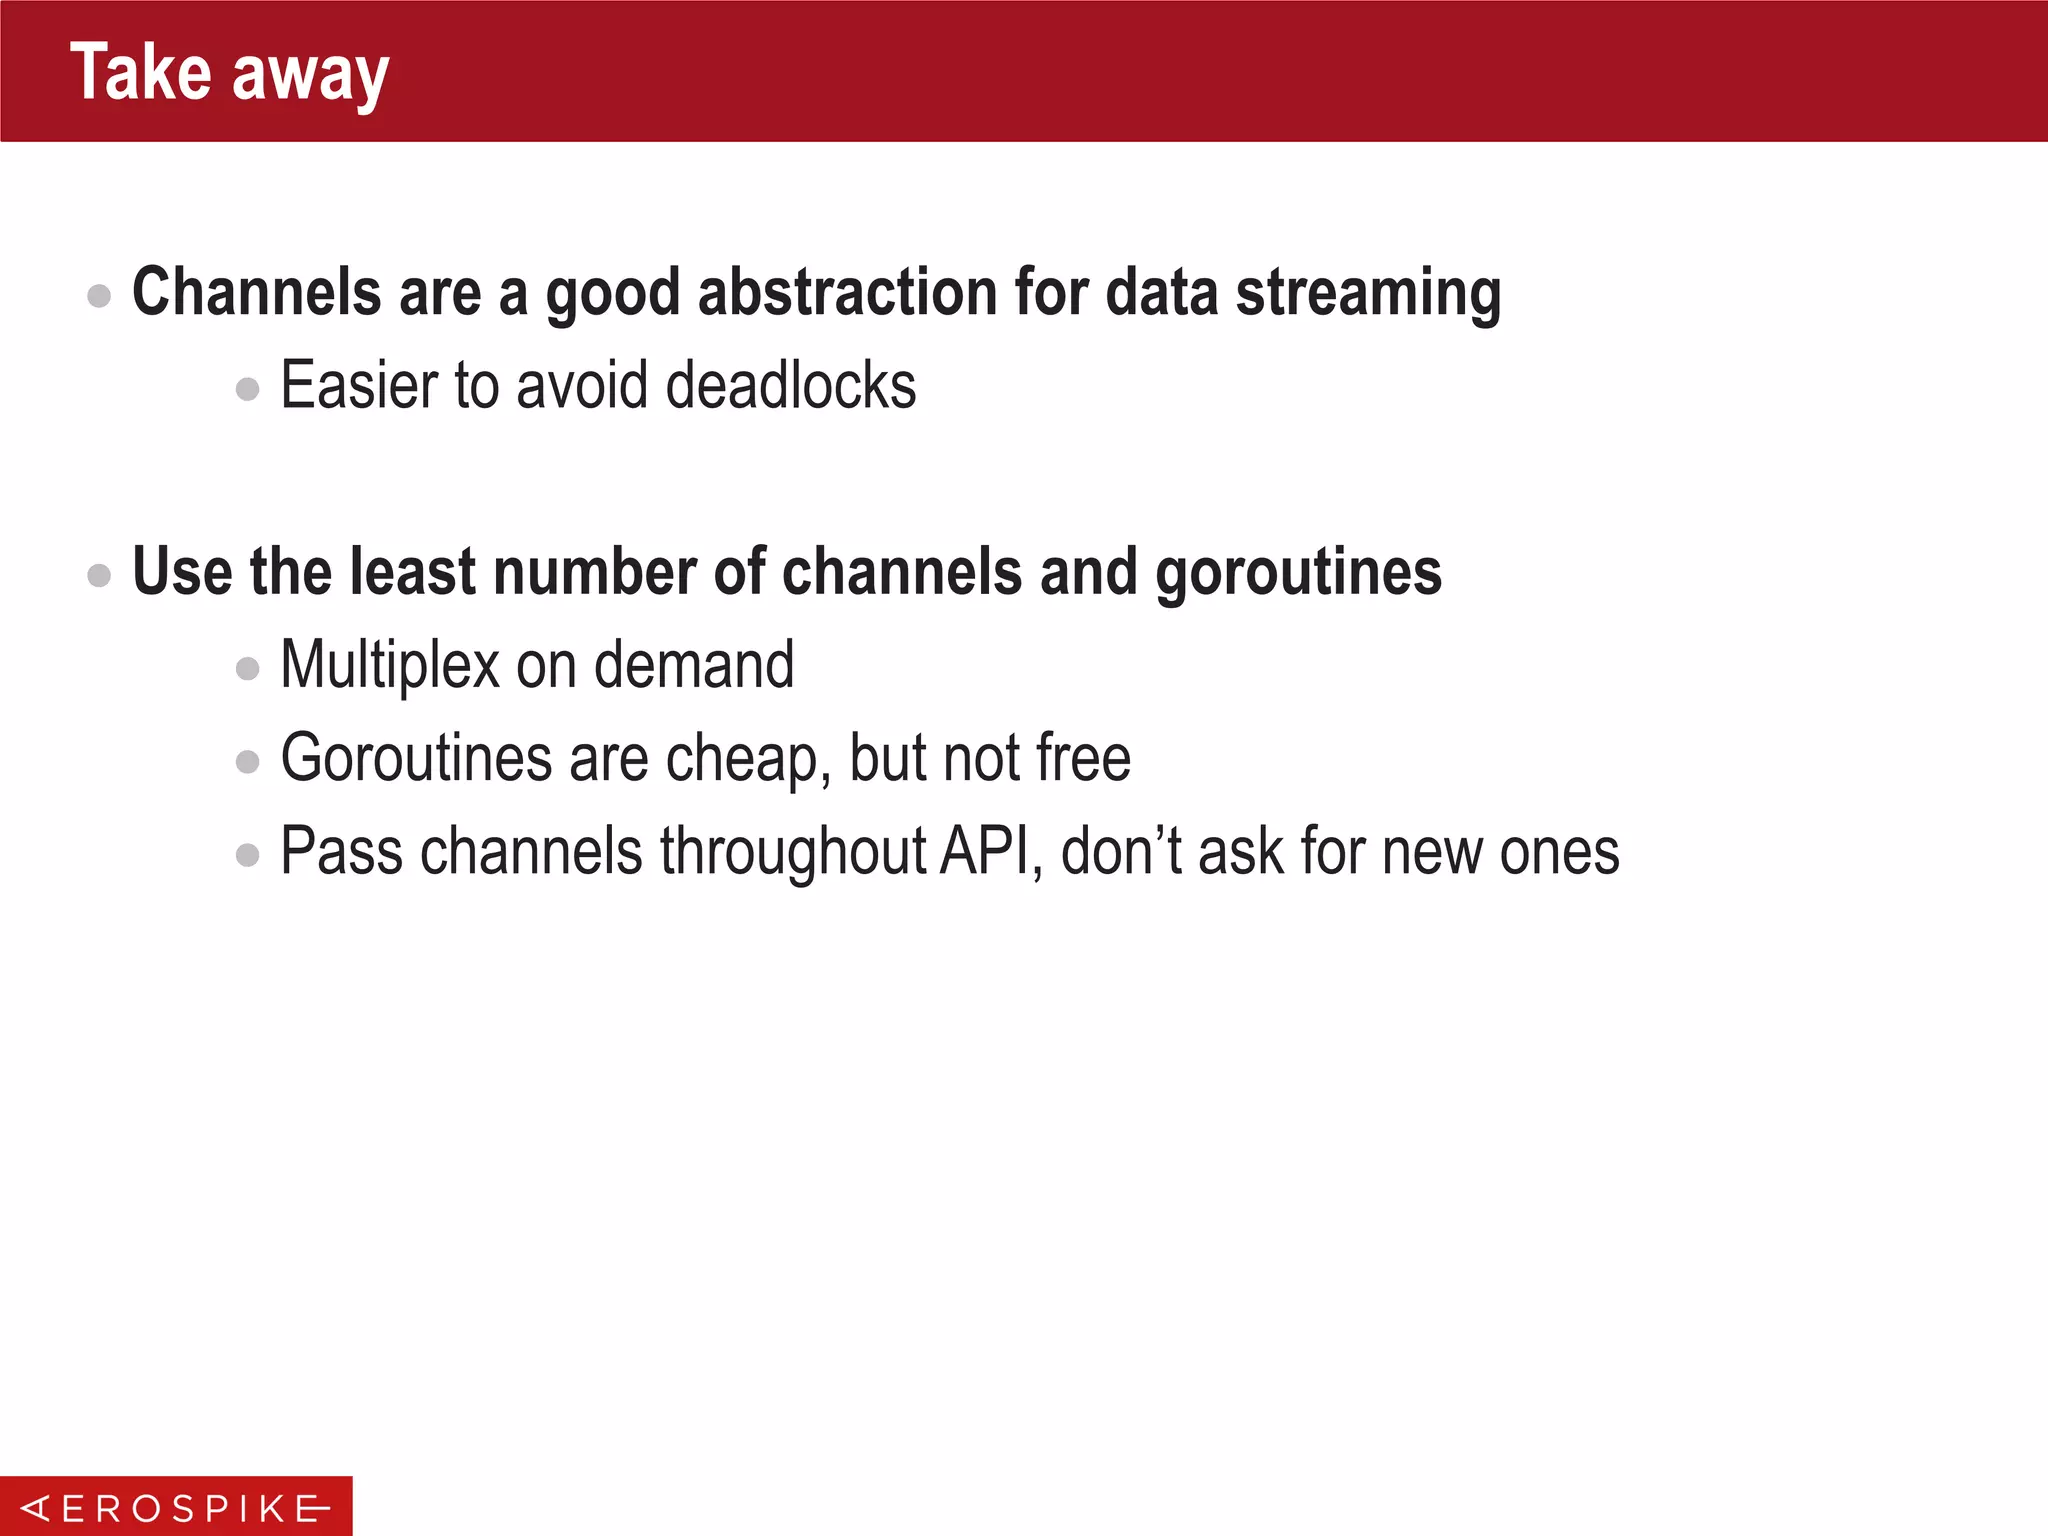
![func NewCluster(policy *ClientPolicy, hosts []*Host) (*Cluster, error) {
newCluster := &Cluster{...}
// start up cluster maintenance go routine
newCluster.wgTend.Add(1)
go newCluster.clusterBoss(policy)
return newCluster, nil
}
func (clstr *Cluster) clusterBoss(policy *ClientPolicy) {
defer clstr.wgTend.Done()
Loop:
for {
select {
case <-clstr.tendChannel:
// tend channel closed
break Loop
case <-time.After(tendInterval):
if err := clstr.tend(); err != nil {
Logger.Warn(err.Error())
}
}
}
// cleanup code goes here
// close the nodes, ...
}
func (clstr *Cluster) Close() {
if !clstr.closed.Get() {
// send close signal to maintenance channel
close(clstr.tendChannel)
// wait until tend is over
clstr.wgTend.Wait()
}
}
Cluster Tracking
On Intervals, Update
Cluster Status
{](https://image.slidesharecdn.com/gopherconindia-150224102953-conversion-gate01/75/Aerospike-Go-Language-Client-17-2048.jpg)
![func NewCluster(policy *ClientPolicy, hosts []*Host) (*Cluster, error) {
newCluster := &Cluster{...}
// start up cluster maintenance go routine
newCluster.wgTend.Add(1)
go newCluster.clusterBoss(policy)
return newCluster, nil
}
func (clstr *Cluster) clusterBoss(policy *ClientPolicy) {
defer clstr.wgTend.Done()
Loop:
for {
select {
case <-clstr.tendChannel:
// tend channel closed
break Loop
case <-time.After(tendInterval):
if err := clstr.tend(); err != nil {
Logger.Warn(err.Error())
}
}
}
// cleanup code goes here
// close the nodes, ...
}
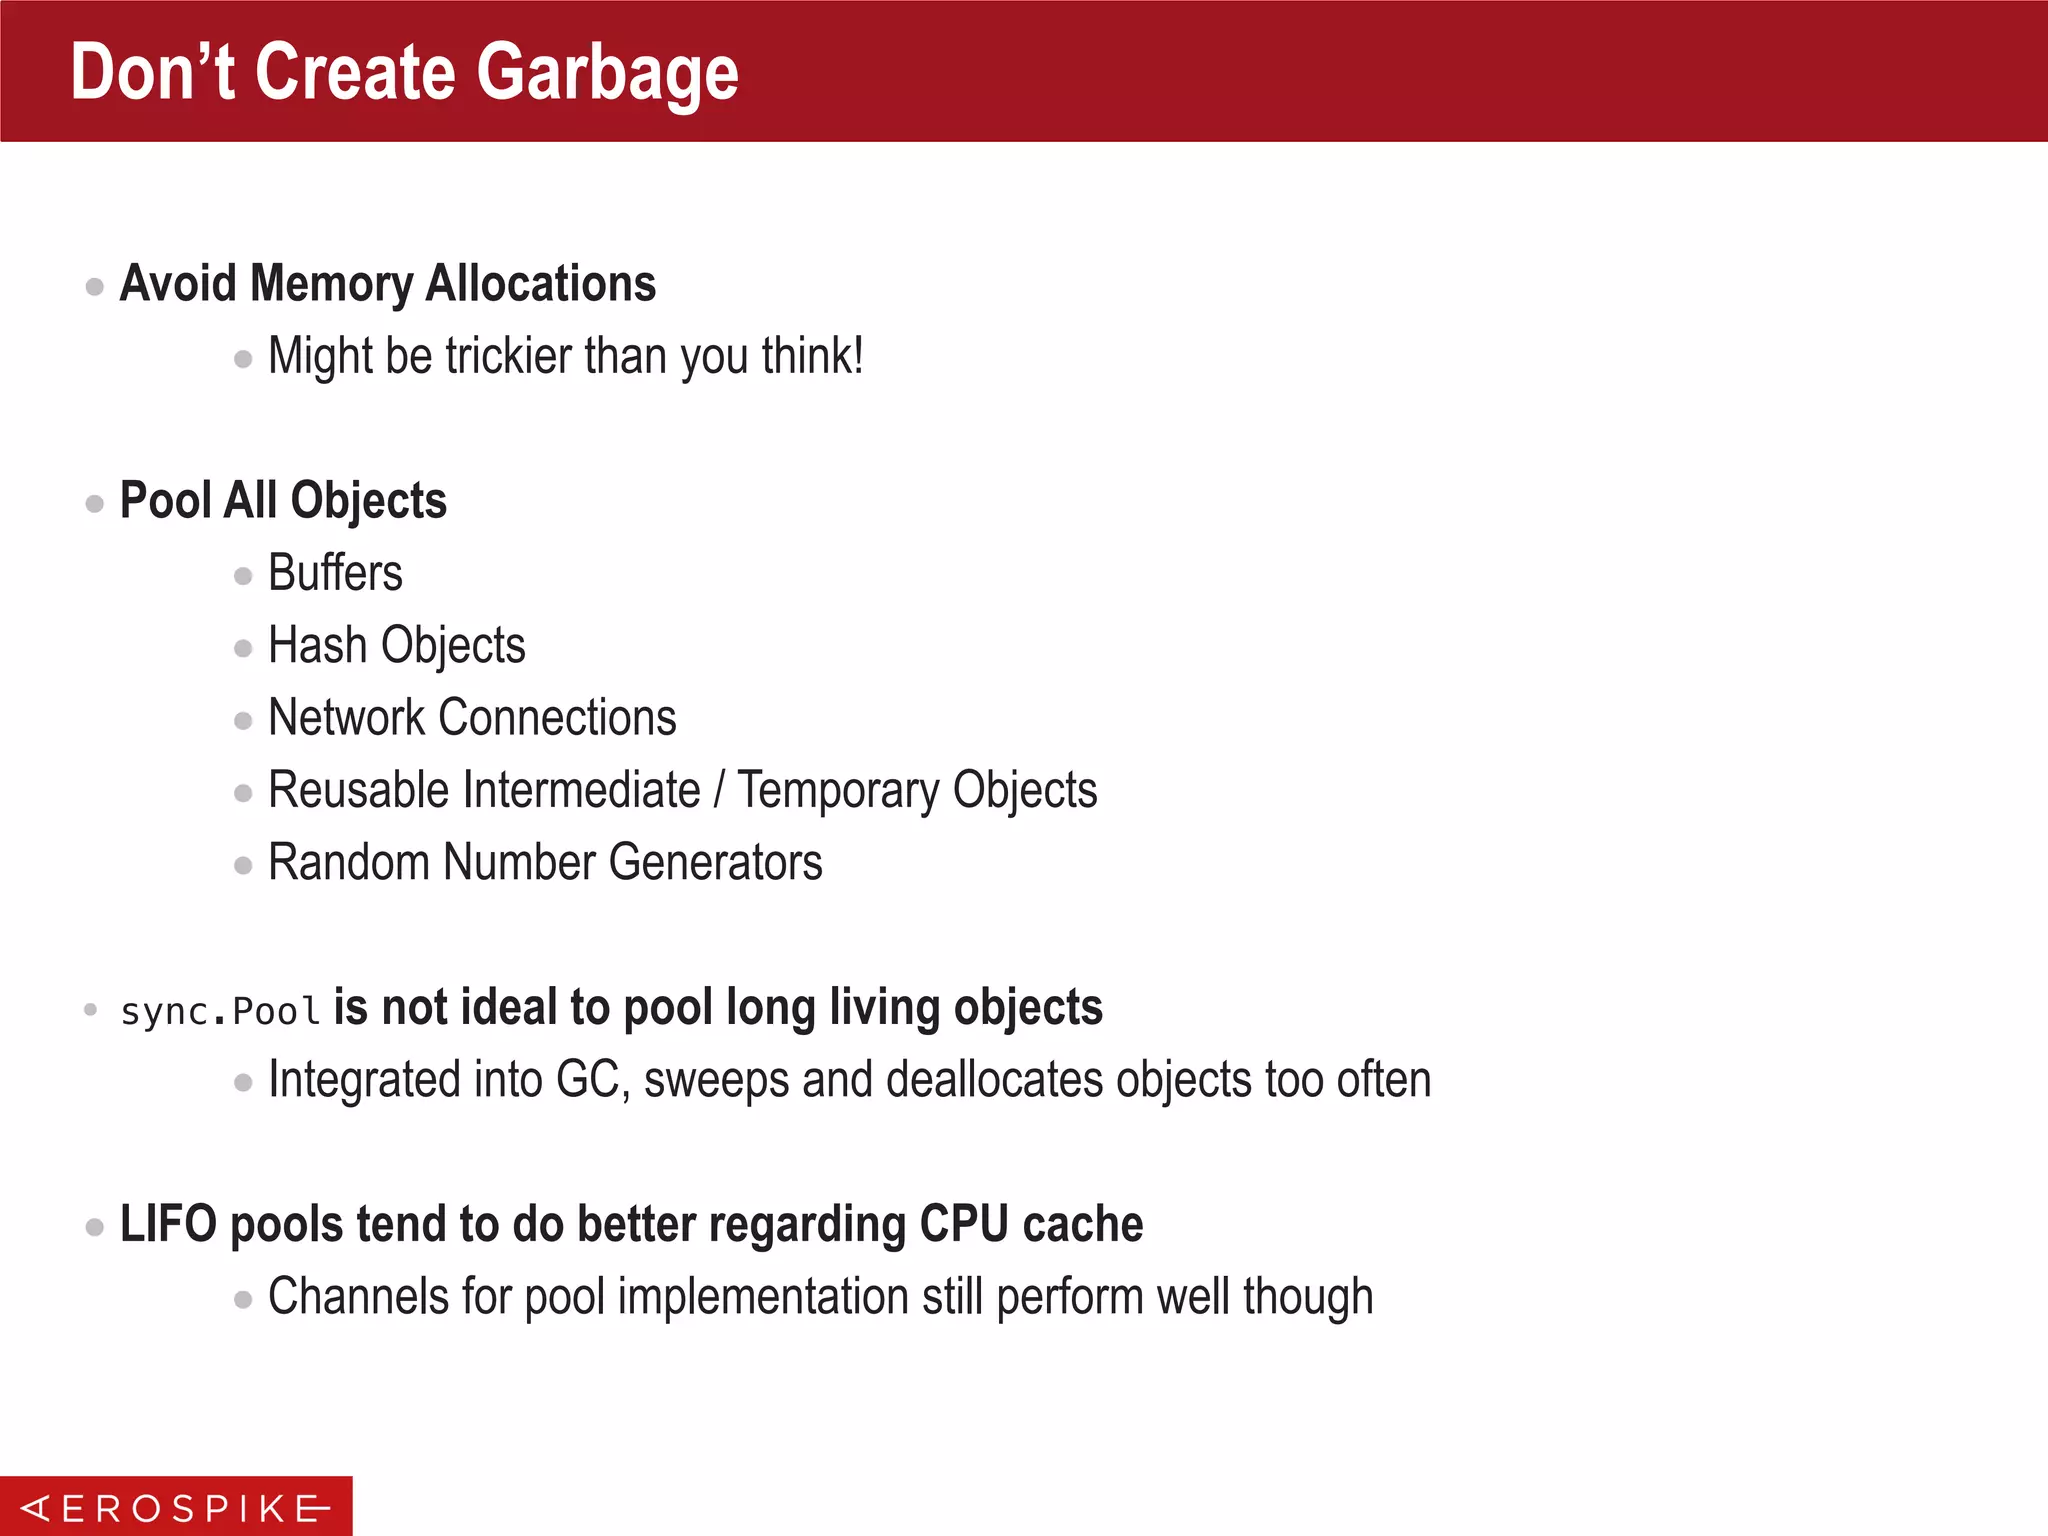
func (clstr *Cluster) Close() {
if !clstr.closed.Get() {
// send close signal to maintenance channel
close(clstr.tendChannel)
// wait until tend is over
clstr.wgTend.Wait()
}
}
Cluster Tracking
Broadcast Closing Of
Cluster
{](https://image.slidesharecdn.com/gopherconindia-150224102953-conversion-gate01/75/Aerospike-Go-Language-Client-18-2048.jpg)
![func NewCluster(policy *ClientPolicy, hosts []*Host) (*Cluster, error) {
newCluster := &Cluster{...}
// start up cluster maintenance go routine
newCluster.wgTend.Add(1)
go newCluster.clusterBoss(policy)
return newCluster, nil
}
func (clstr *Cluster) clusterBoss(policy *ClientPolicy) {
defer clstr.wgTend.Done()
Loop:
for {
select {
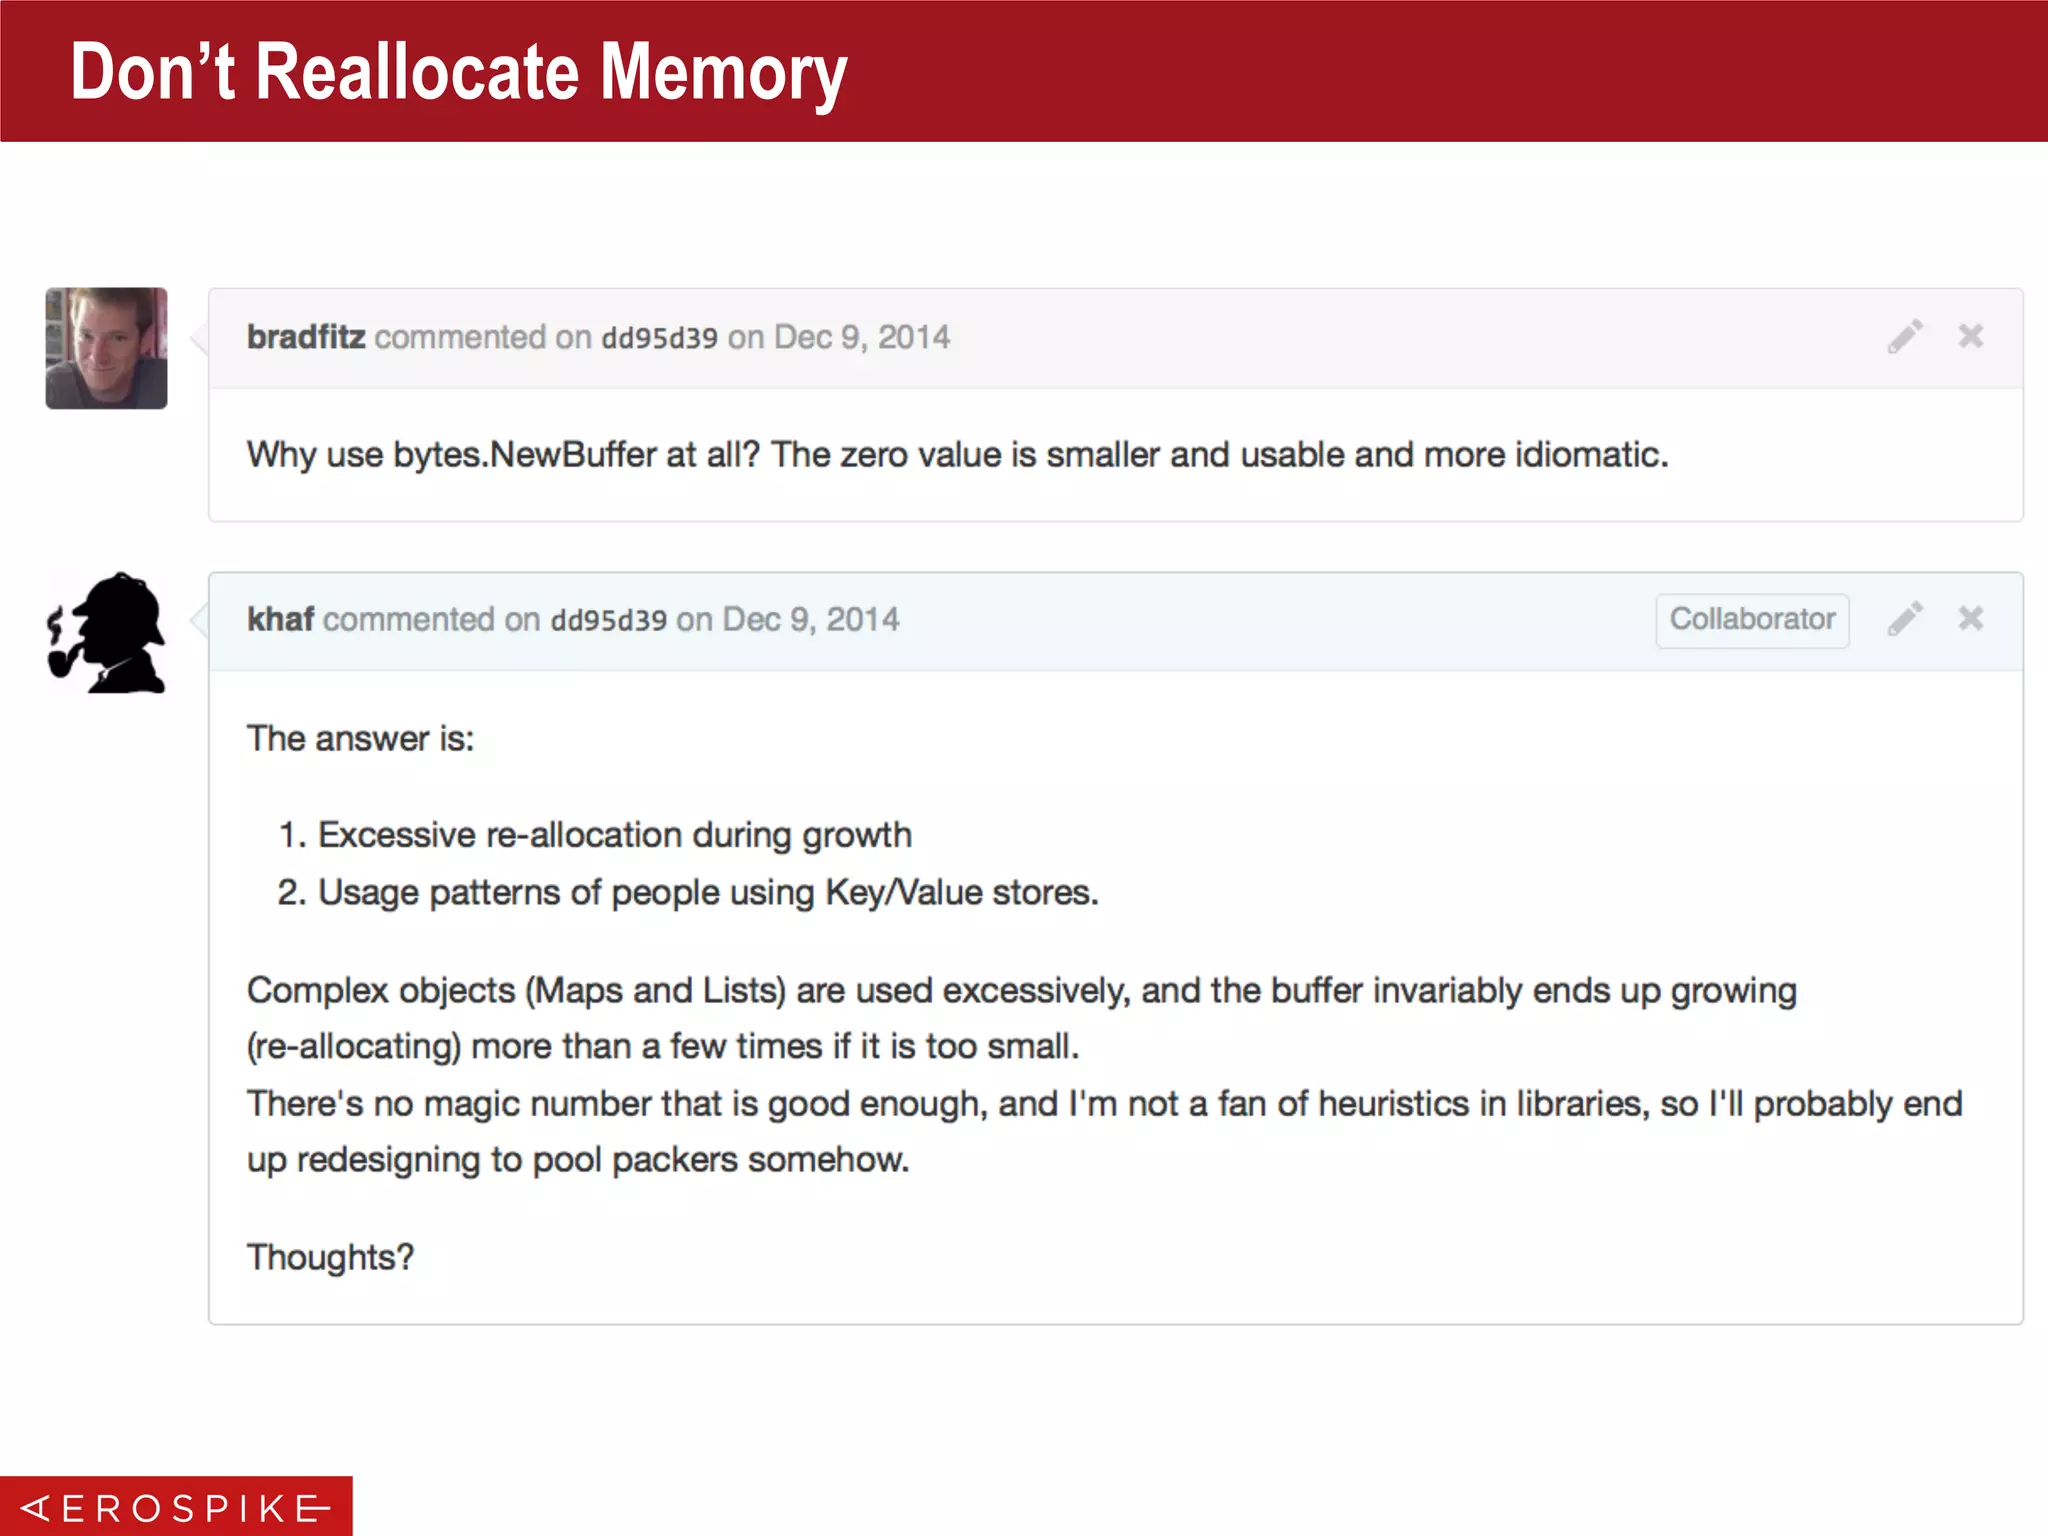
case <-clstr.tendChannel:
// tend channel closed
break Loop
case <-time.After(tendInterval):
if err := clstr.tend(); err != nil {
Logger.Warn(err.Error())
}
}
}
// cleanup code goes here
// close the nodes, ...
}
func (clstr *Cluster) Close() {
if !clstr.closed.Get() {
// send close signal to maintenance channel
close(clstr.tendChannel)
// wait until tend is over
clstr.wgTend.Wait()
}
}
Cluster Tracking
Break the loop to clean up
{](https://image.slidesharecdn.com/gopherconindia-150224102953-conversion-gate01/75/Aerospike-Go-Language-Client-19-2048.jpg)


![Don’t Reallocate Memory
• Avoid Memory Allocations
• Might be trickier than you think!
• All following code snippets allocate memory:
b := new(bytes.Buffer)
longBuf := bytes.Repeat([]byte{32}, 100)
// Allocation happens in Write to Grow the buffer
b.Write([]byte{32})
// Re-allocation happens in Write to Grow the buffer
b.Write(longBuf)
// allocation happens inside Trim
strings.Trim(" Trim this string ", " ")
h := ripemd160.New()
h.Write(data)
// allocation happens inside Sum()
h.Sum(nil)
// Why? To support the general case
func (d *digest) Sum(in []byte) []byte {
// Make a copy of d0 so that caller can keep writing and summing.
d := *d0](https://image.slidesharecdn.com/gopherconindia-150224102953-conversion-gate01/75/Aerospike-Go-Language-Client-32-2048.jpg)
![Pools
• Make Pools Deterministic
• Let User Decide About Parameters Per Use-Case
• Document The Above!
type BufferPool struct {
pool [][]byte
poolSize int
pos int64
maxBufSize int
initBufSize int
mutex sync.Mutex
}
func (bp *BufferPool) Put(buf []byte) {
if len(buf) <= bp.maxBufSize {
...
}
// buffer too big to go back into the pool
}
// a custom buffer pool with fine grained control over its contents
// maxSize: 128KiB
// initial bufferSize: 16 KiB
// maximum buffer size to keep in the pool: 128K
var bufPool = NewBufferPool(512, 16*1024, 128*1024)
// SetCommandBufferPool can be used to customize the command Buffer Pool parameters to calib
// the pool for different workloads
func SetCommandBufferPool(poolSize, initBufSize, maxBufferSize int) {
bufPool = NewBufferPool(poolSize, initBufSize, maxBufferSize)
}
Set & Enforce Limits for
Pooled Buffers
{
{
Set Sensible Defaults
Let Users Tweak Per
Use-Case](https://image.slidesharecdn.com/gopherconindia-150224102953-conversion-gate01/75/Aerospike-Go-Language-Client-35-2048.jpg)
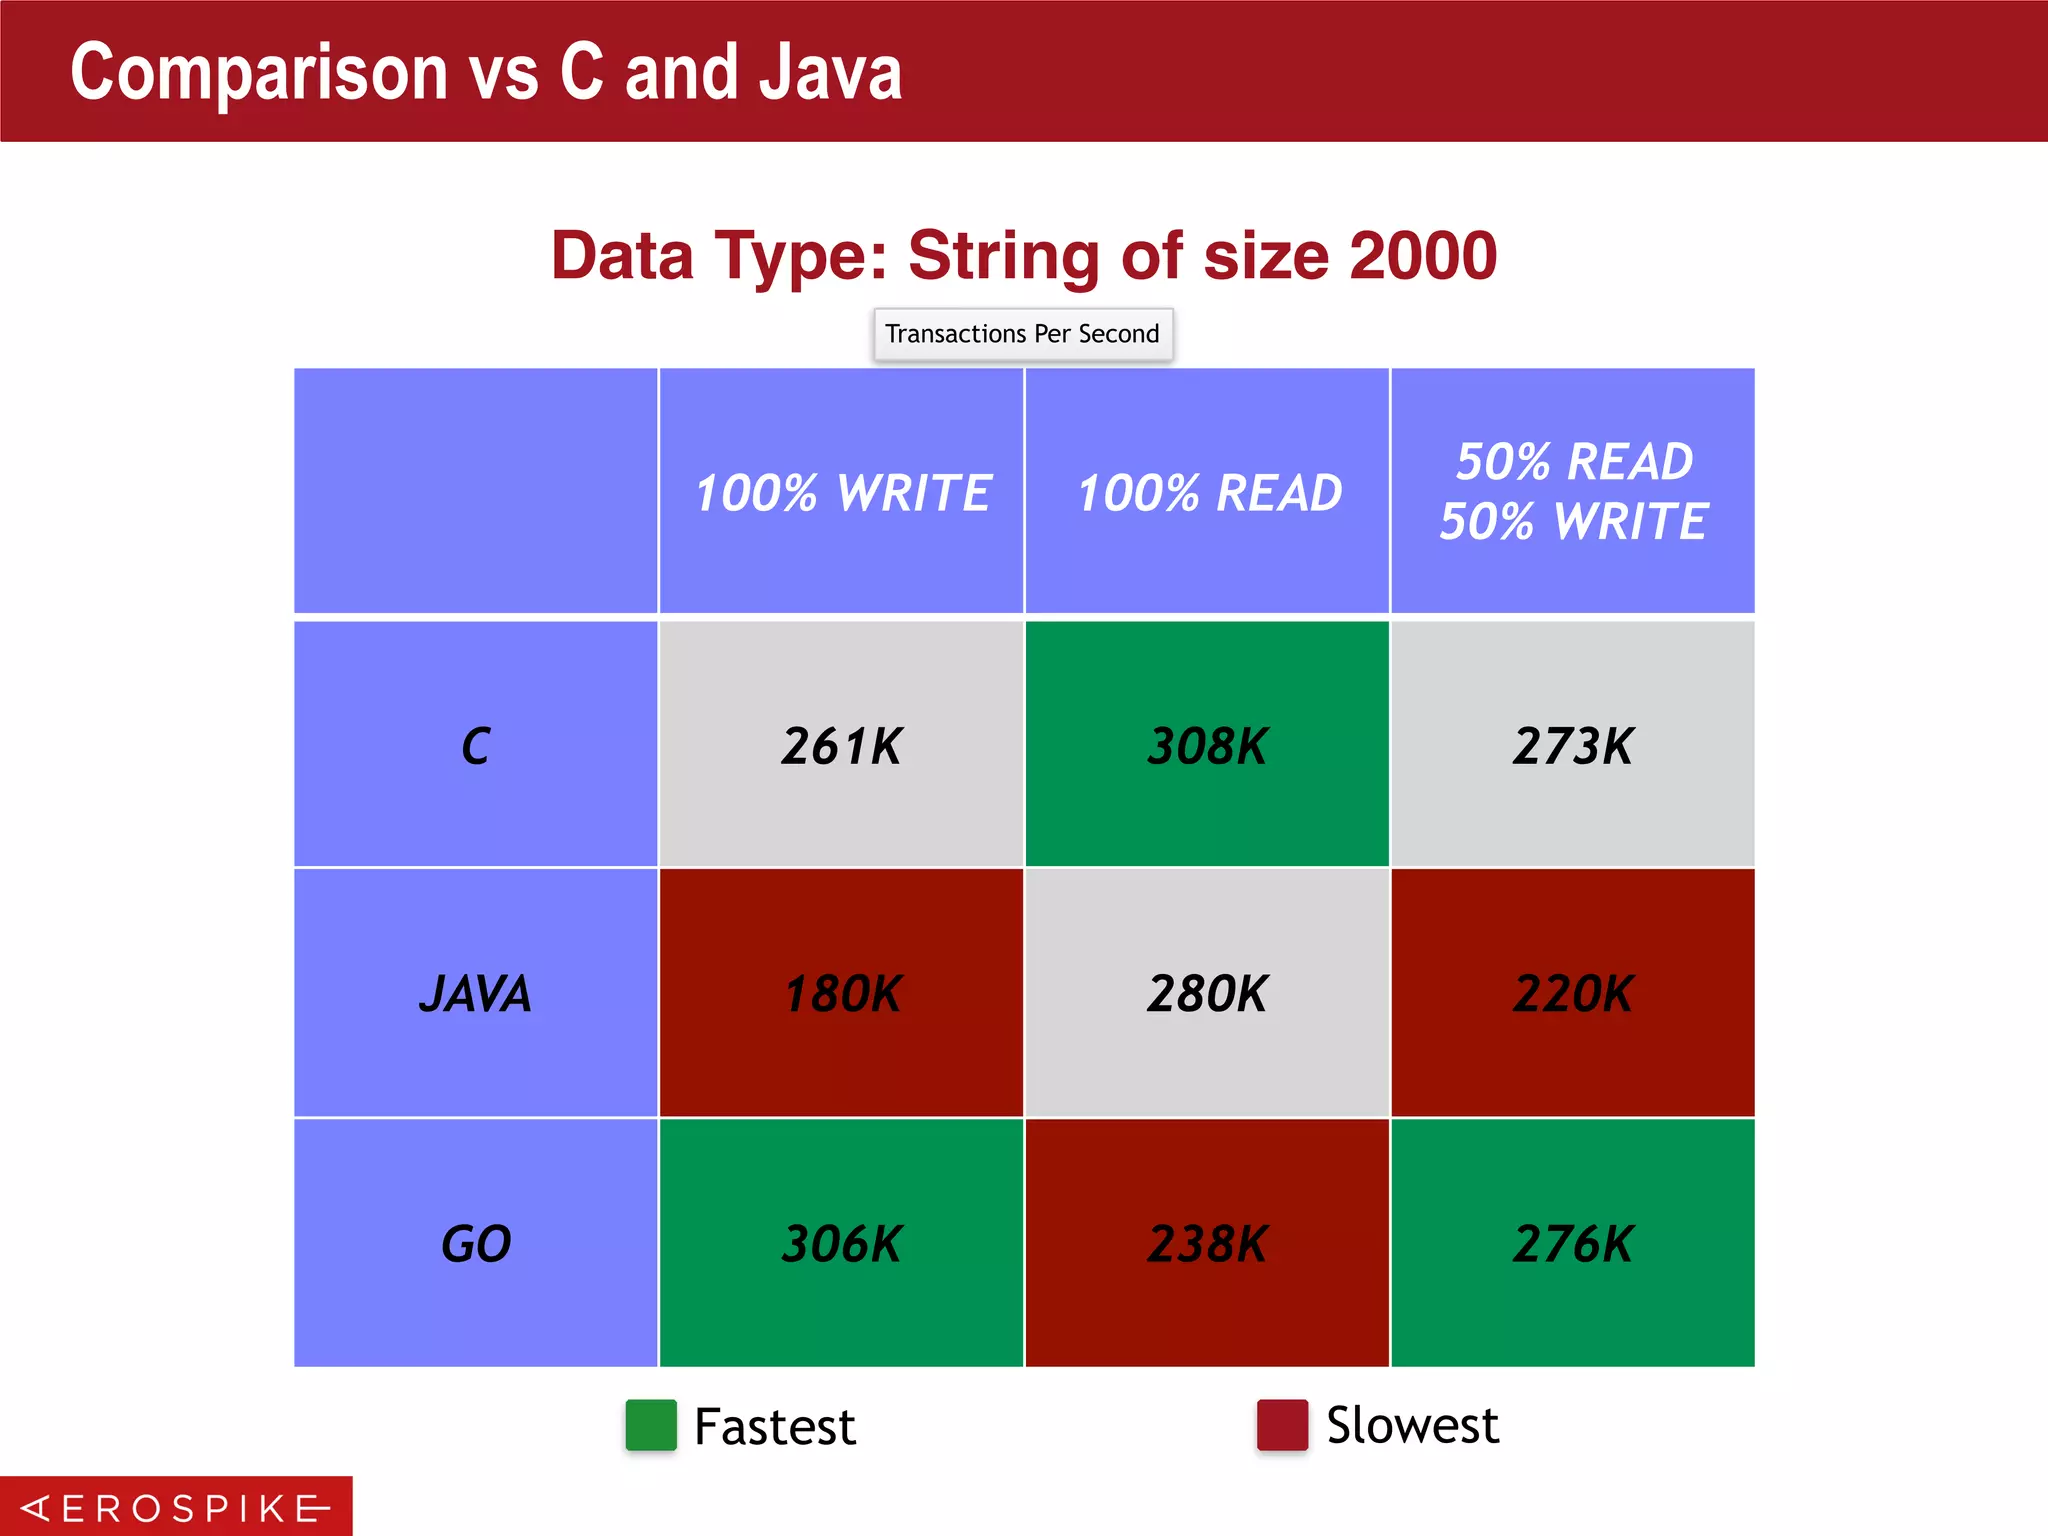
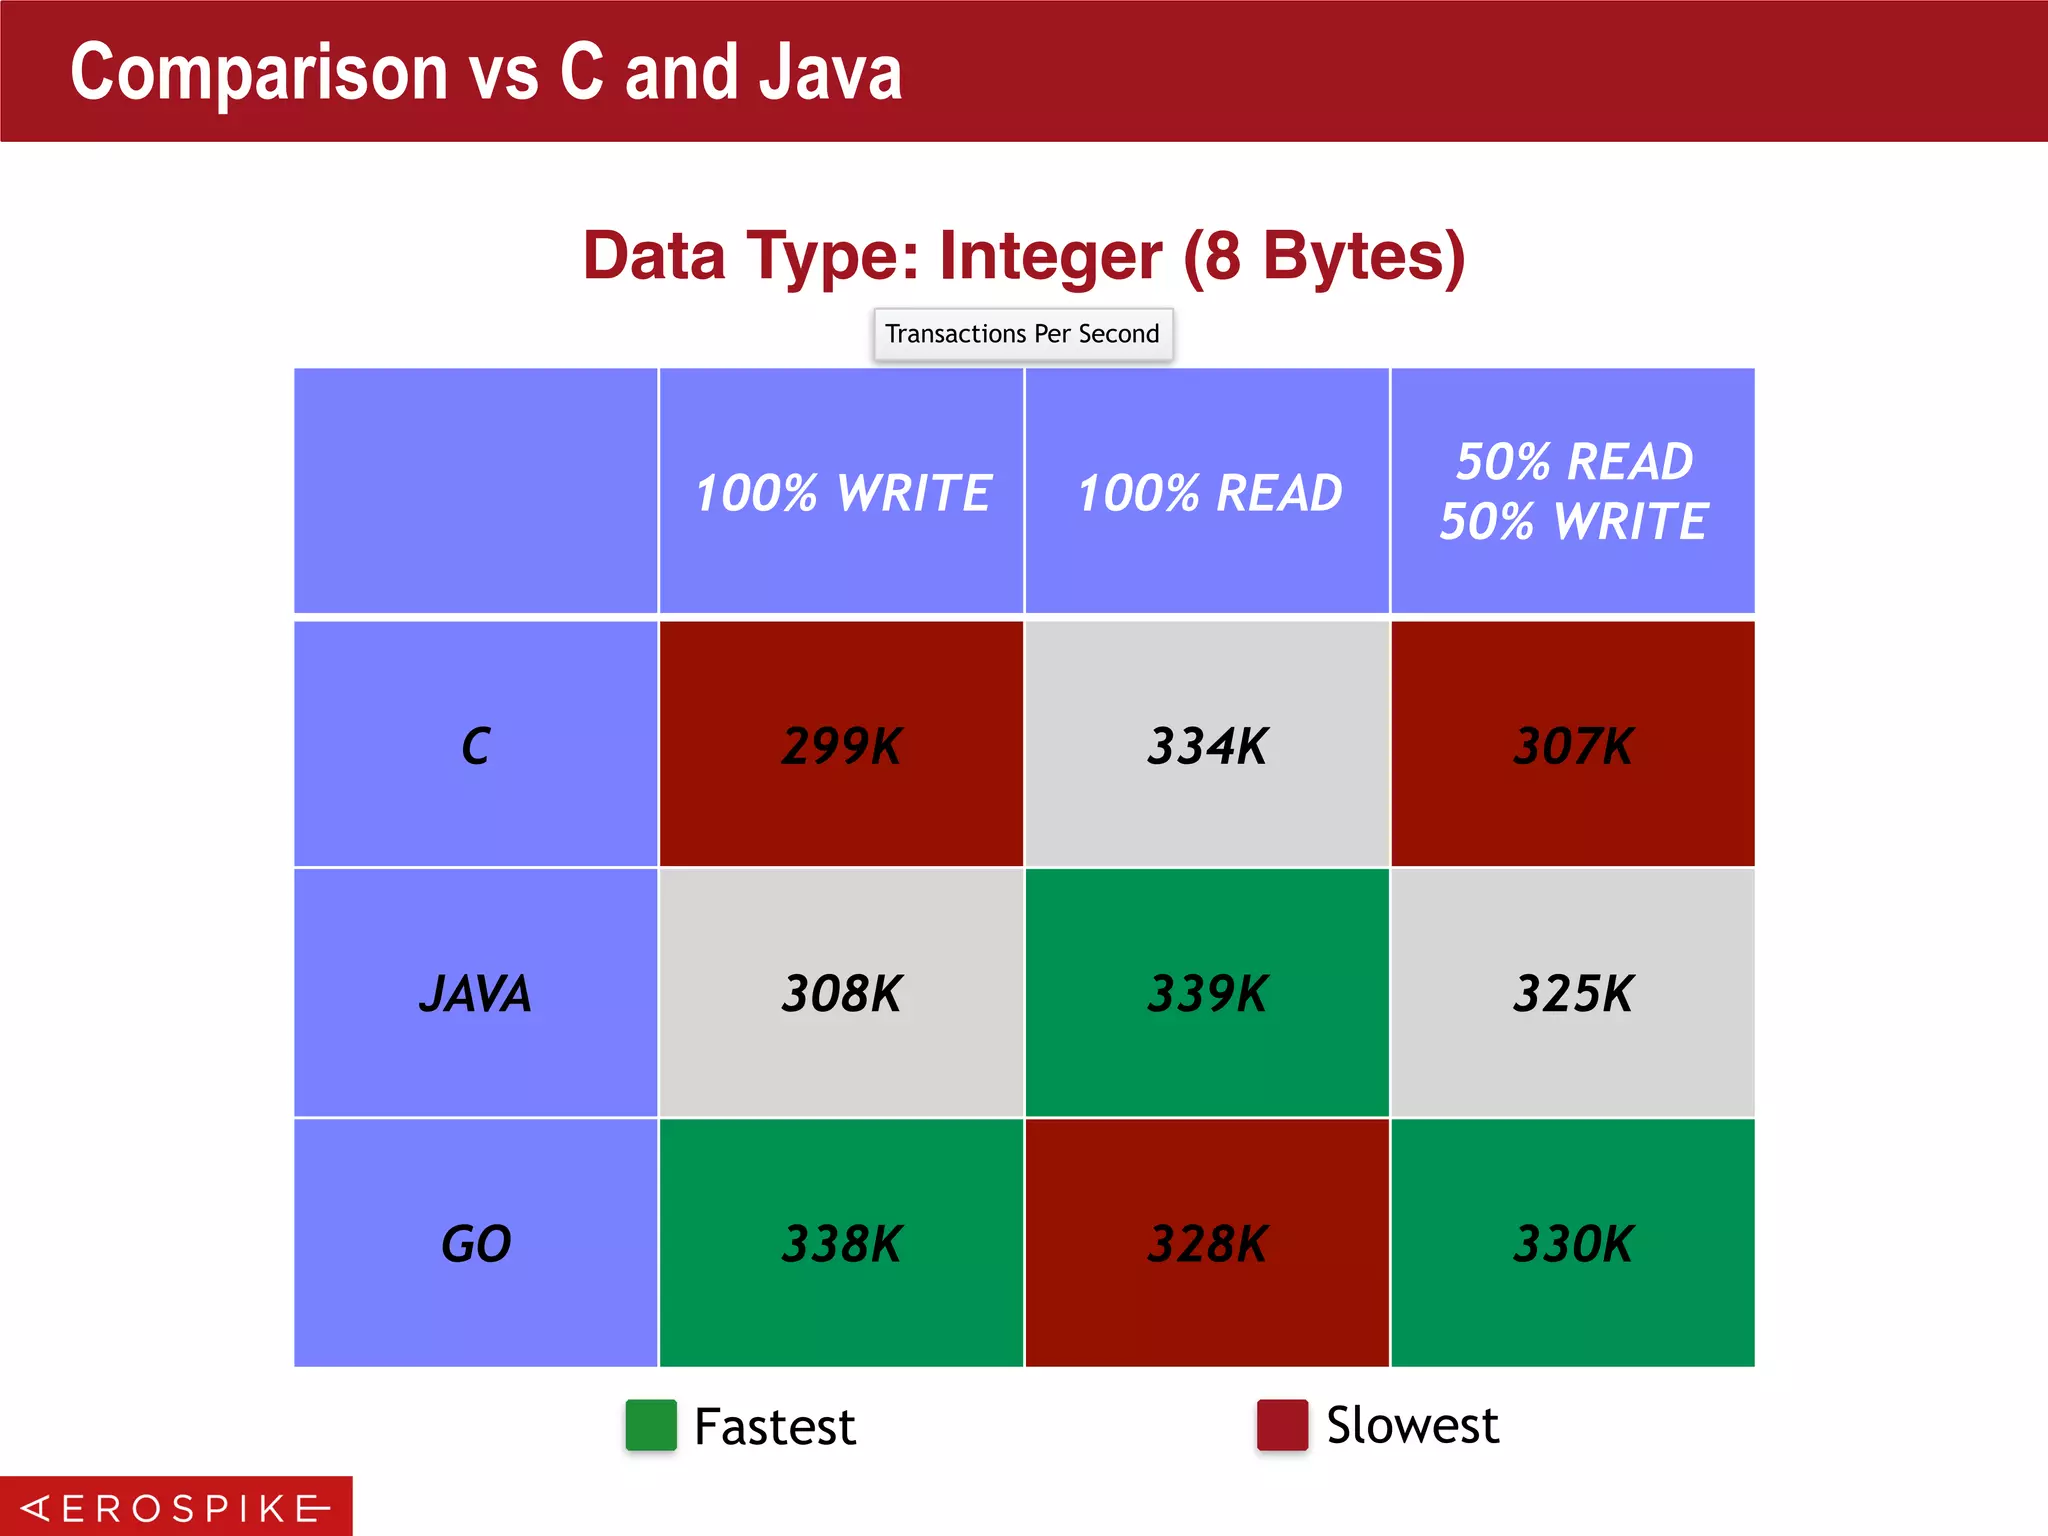

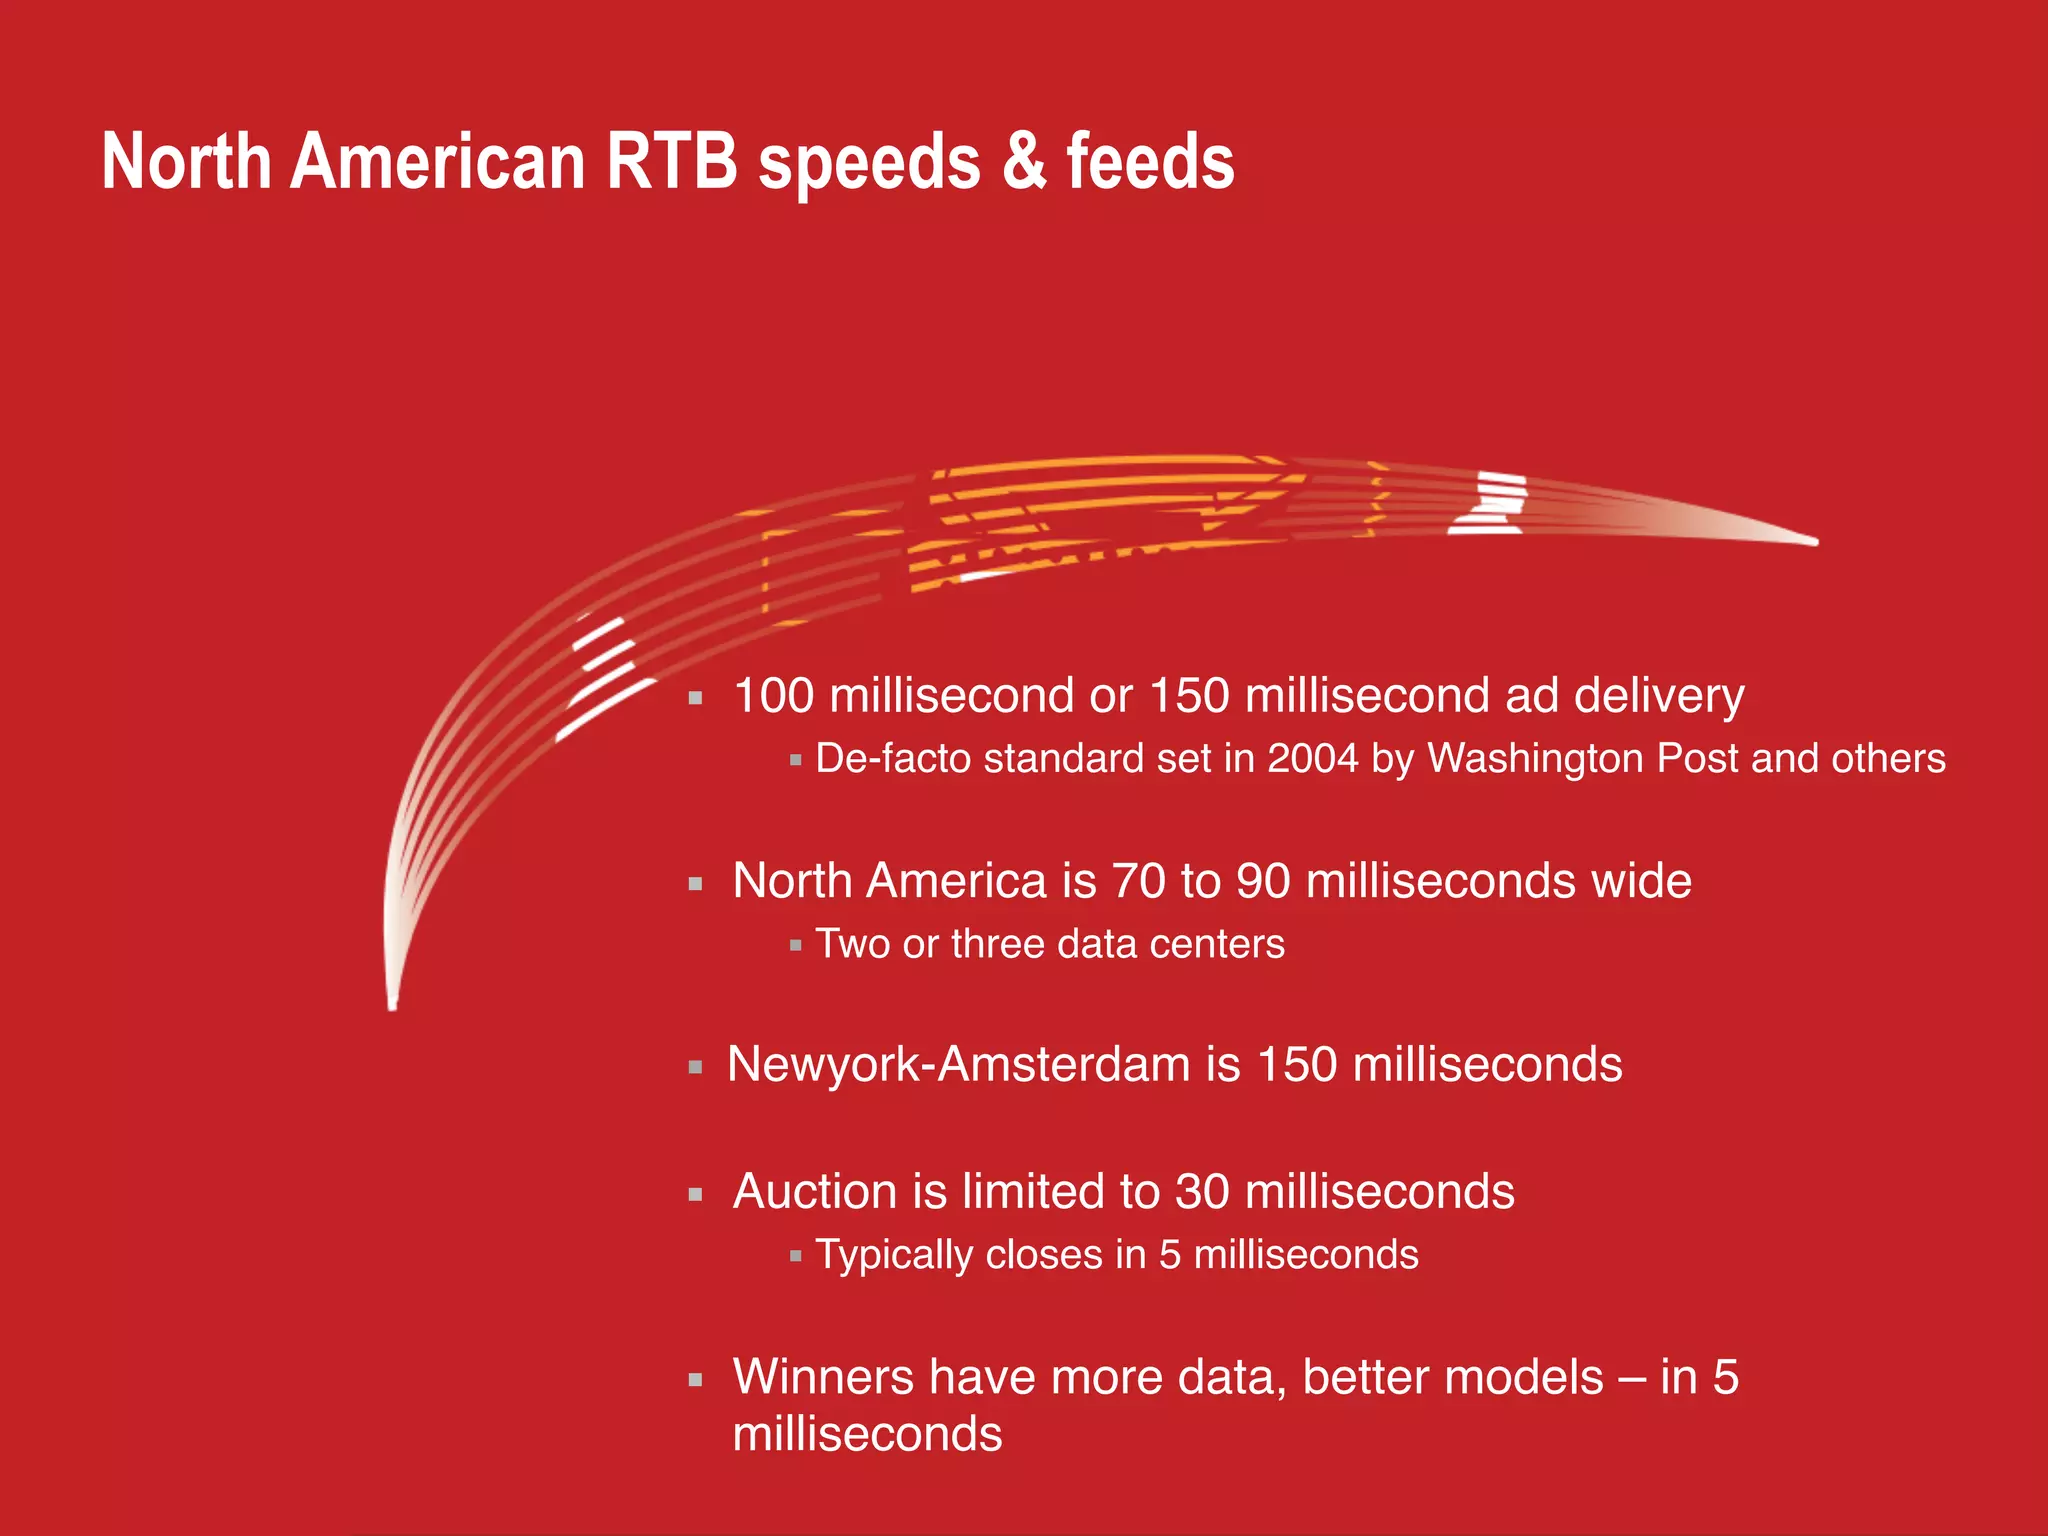
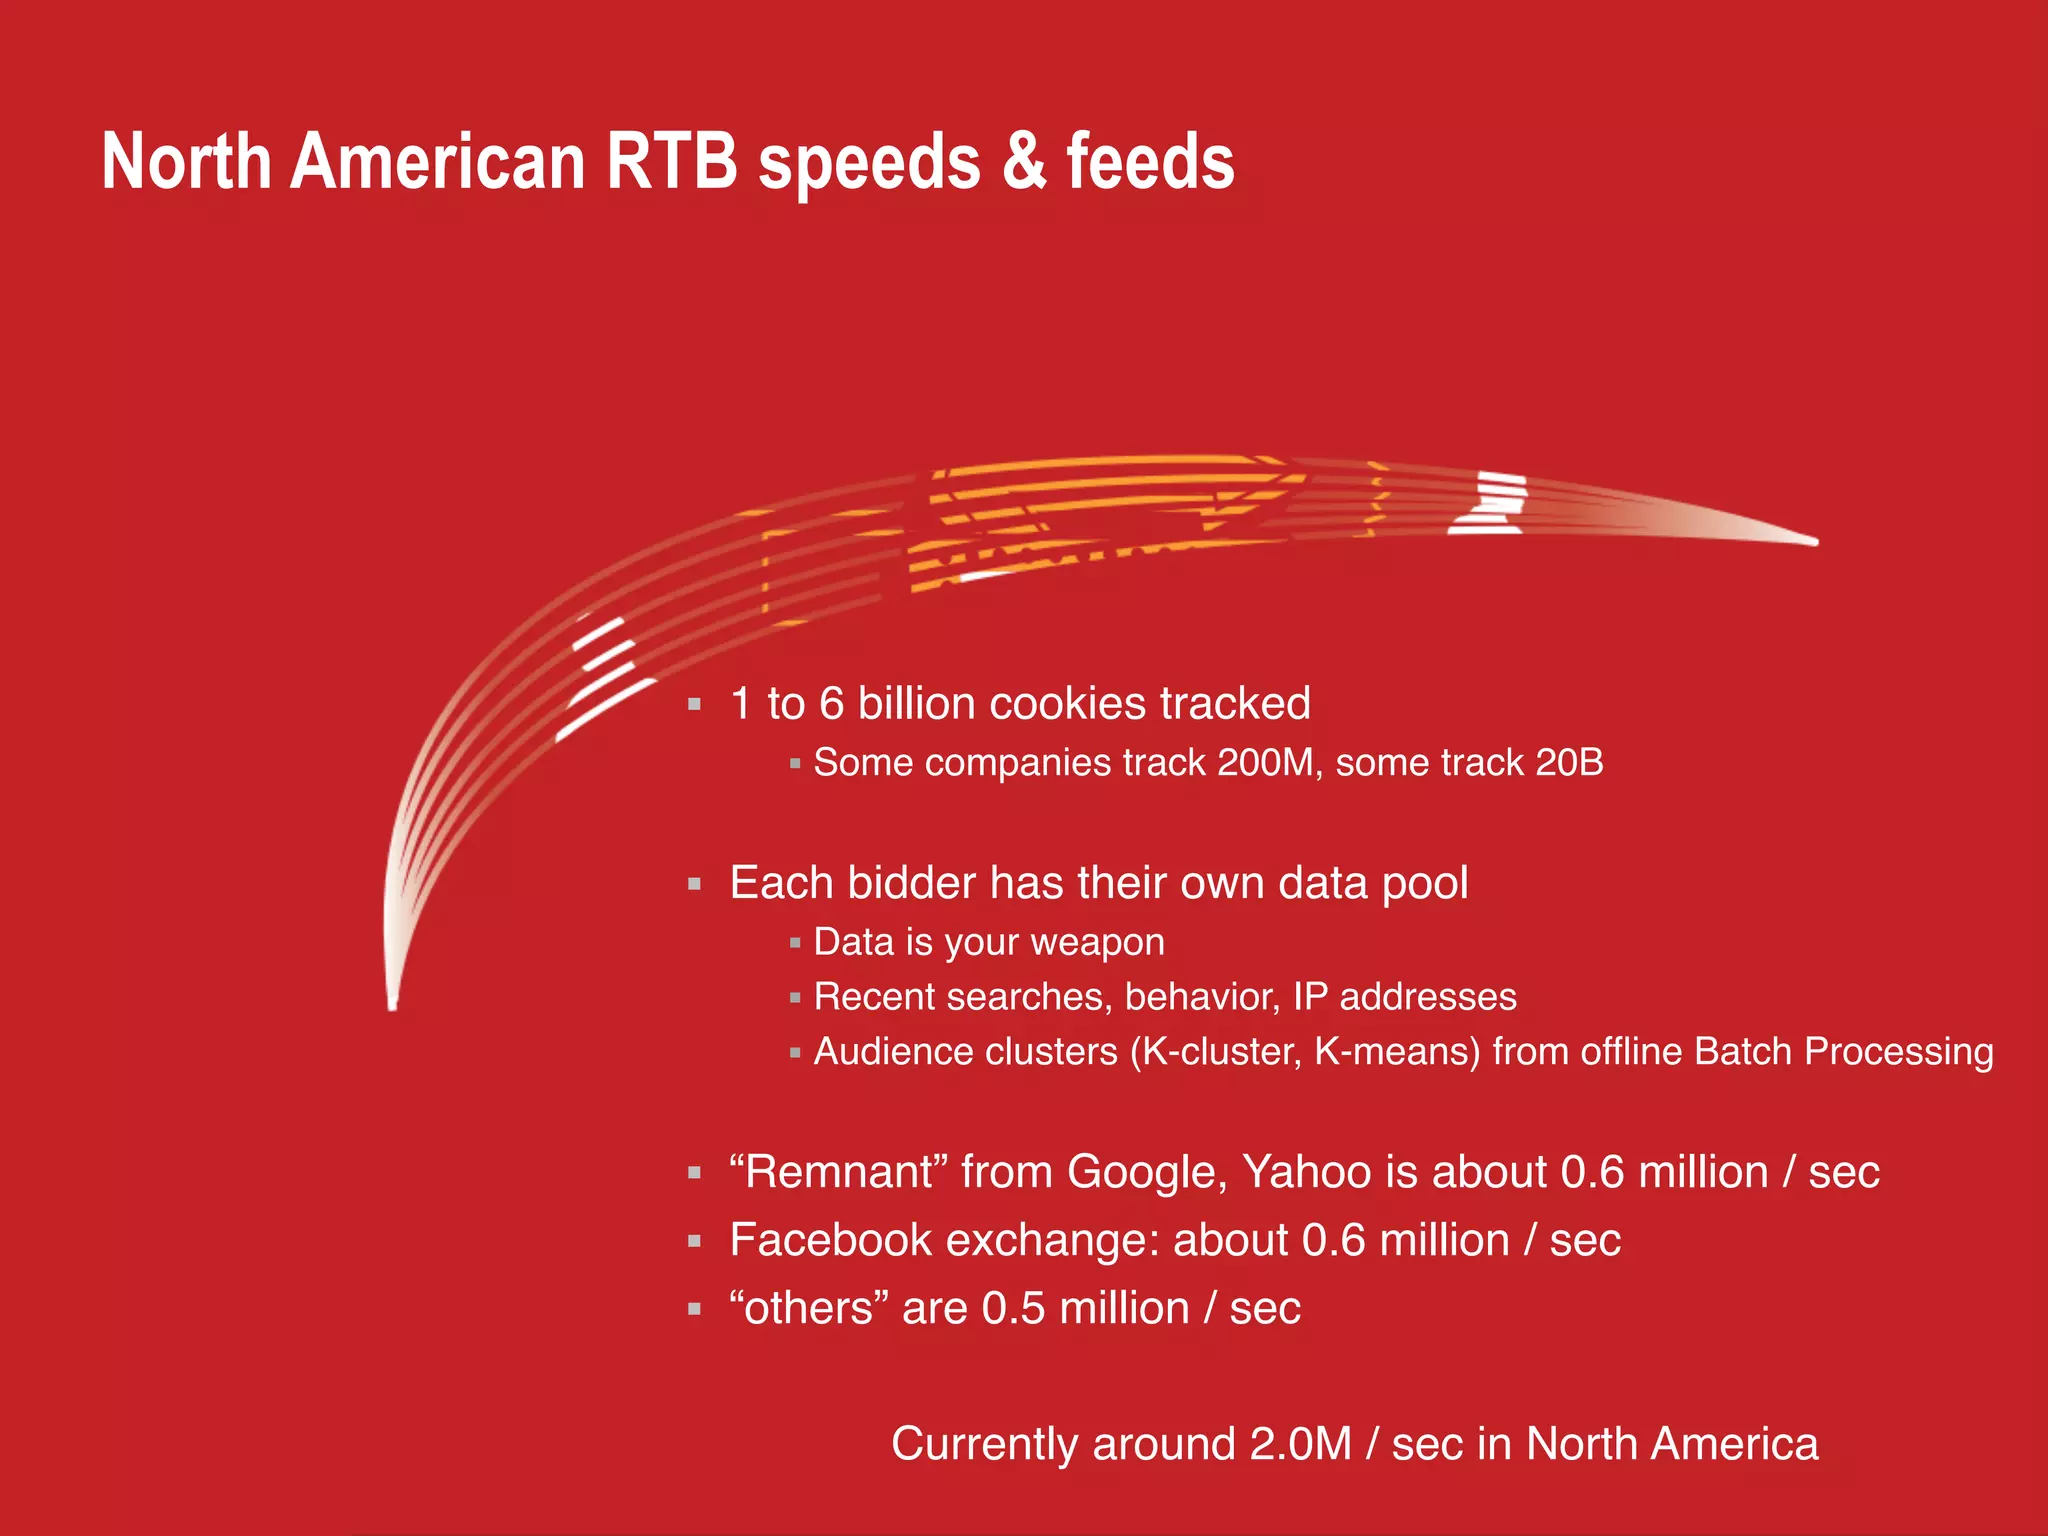
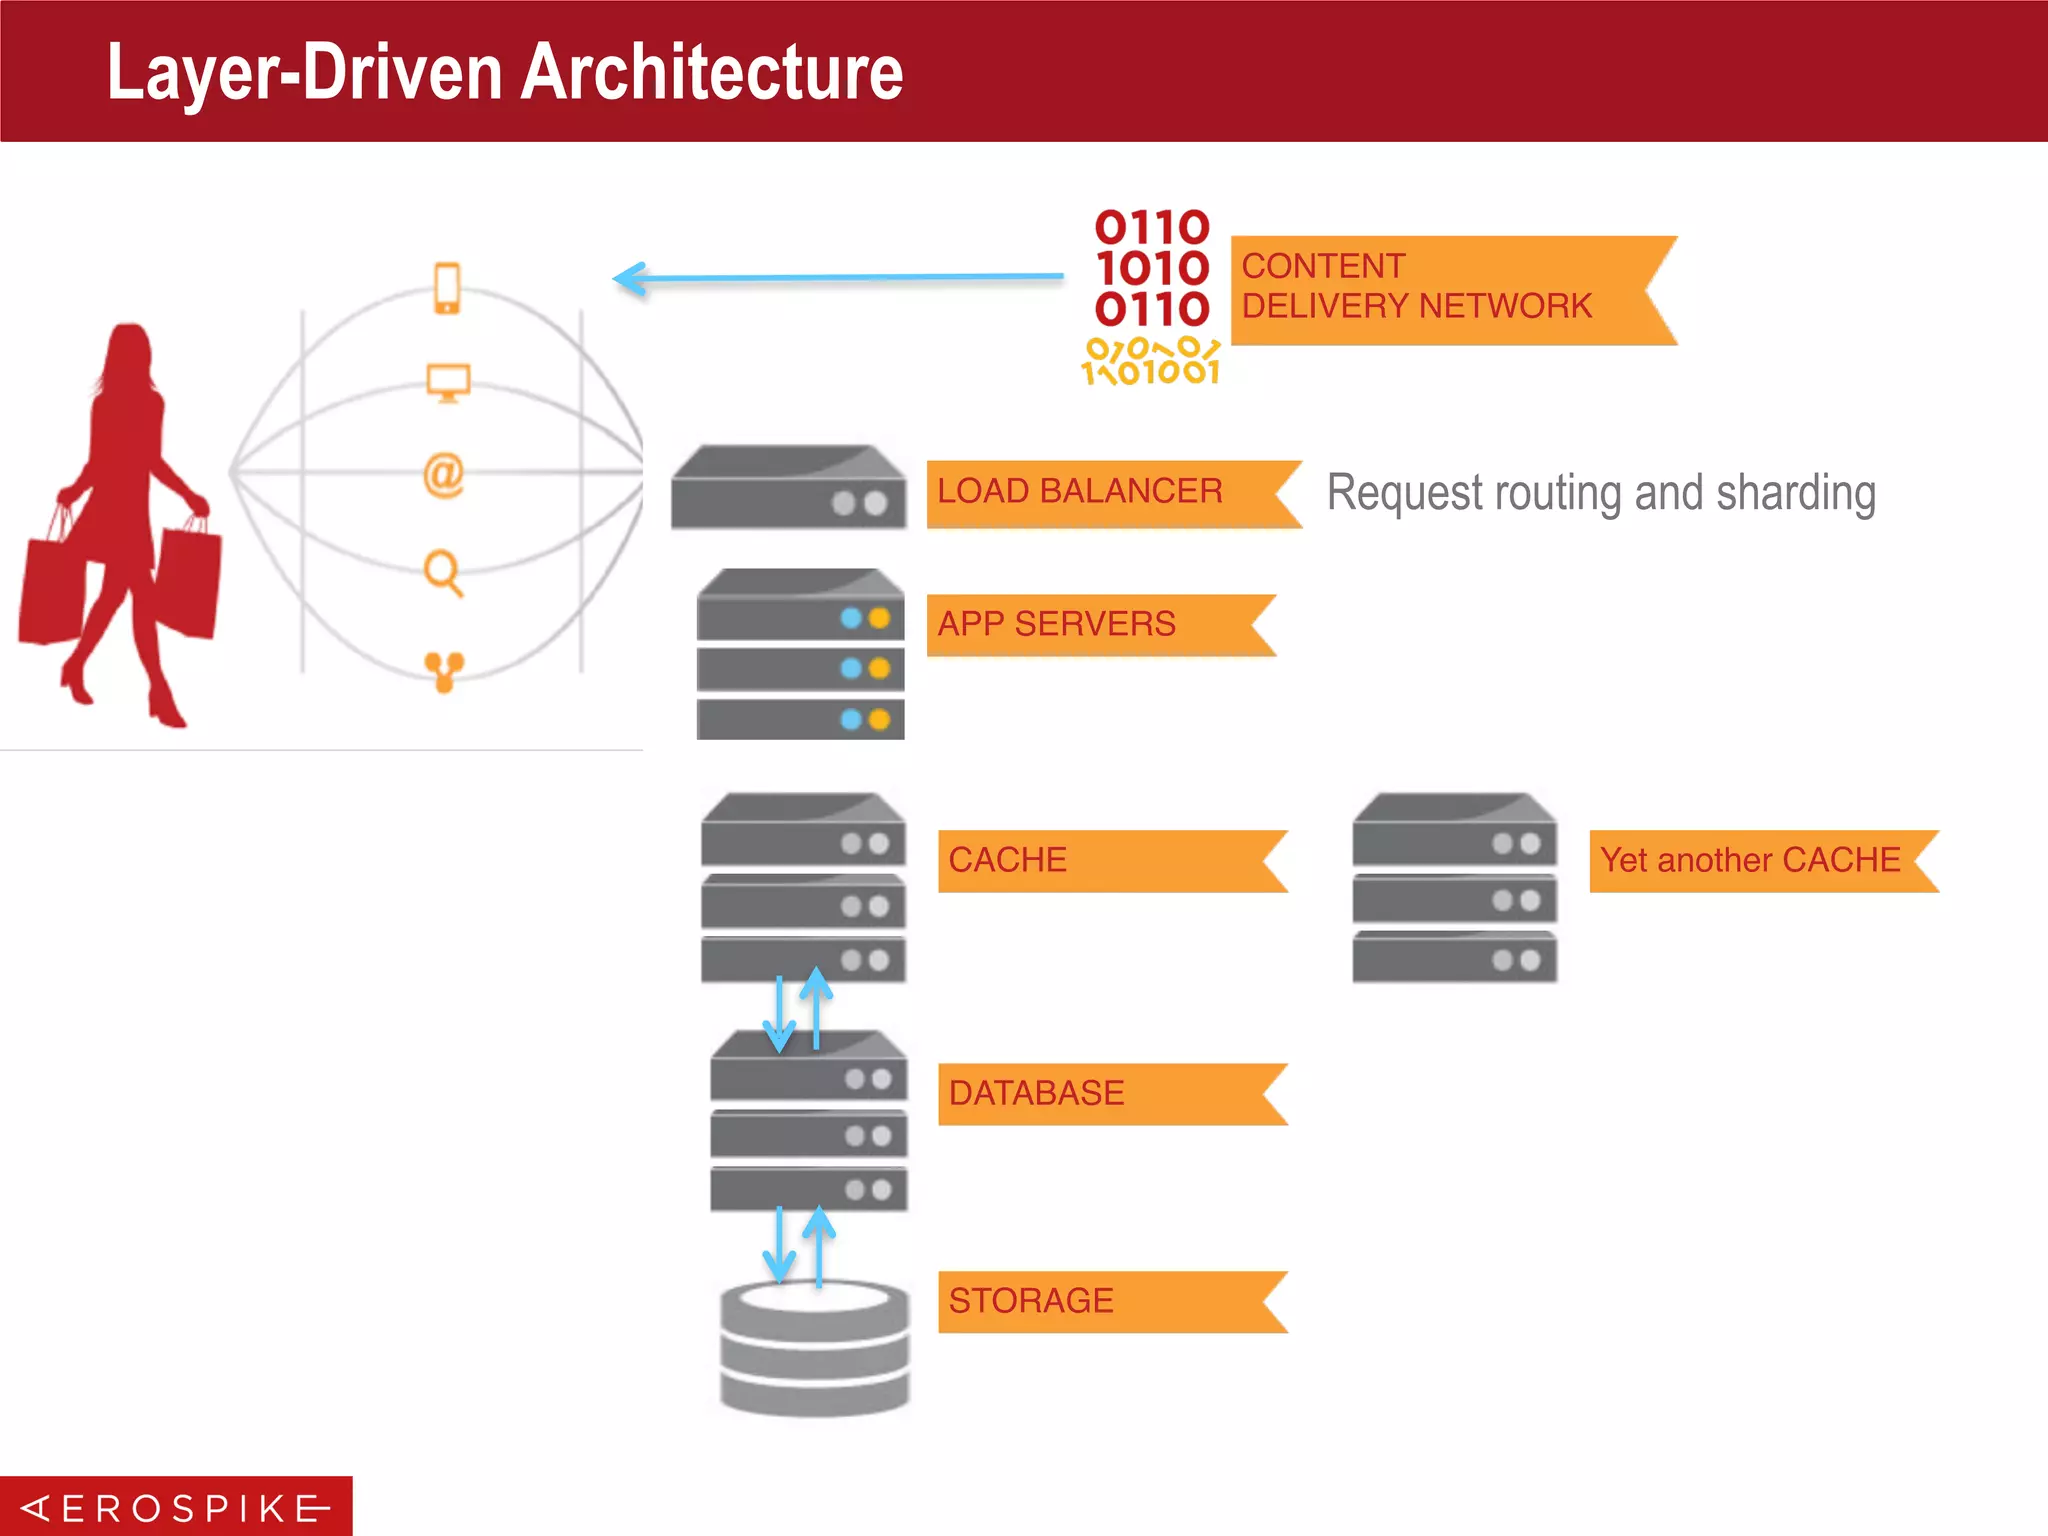
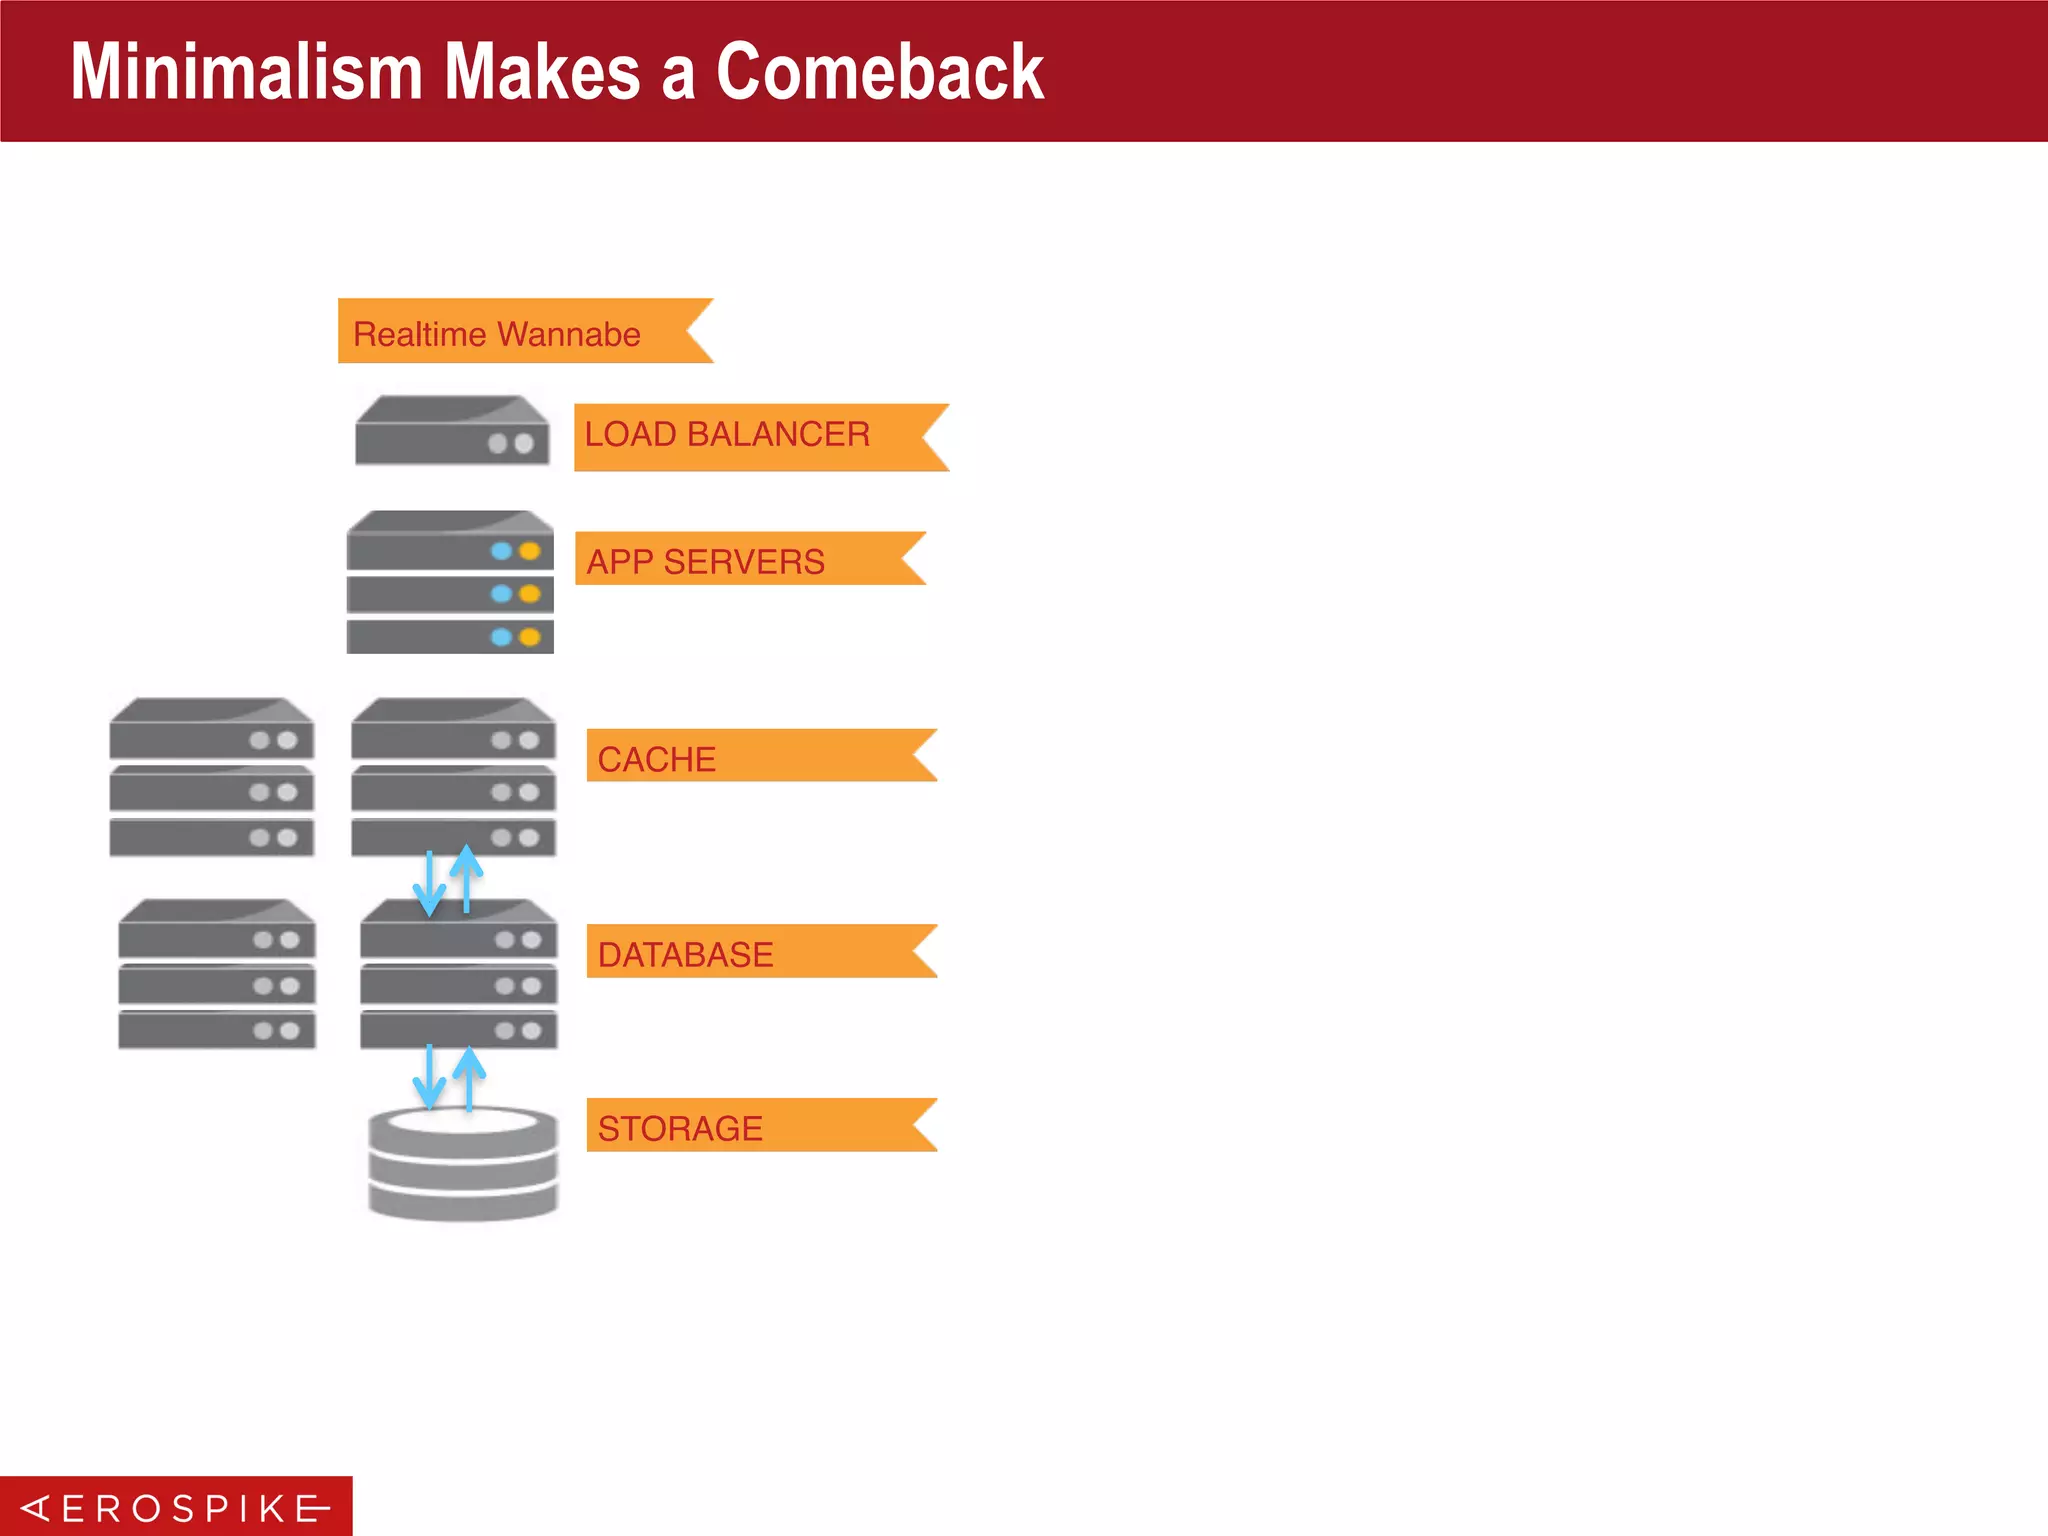
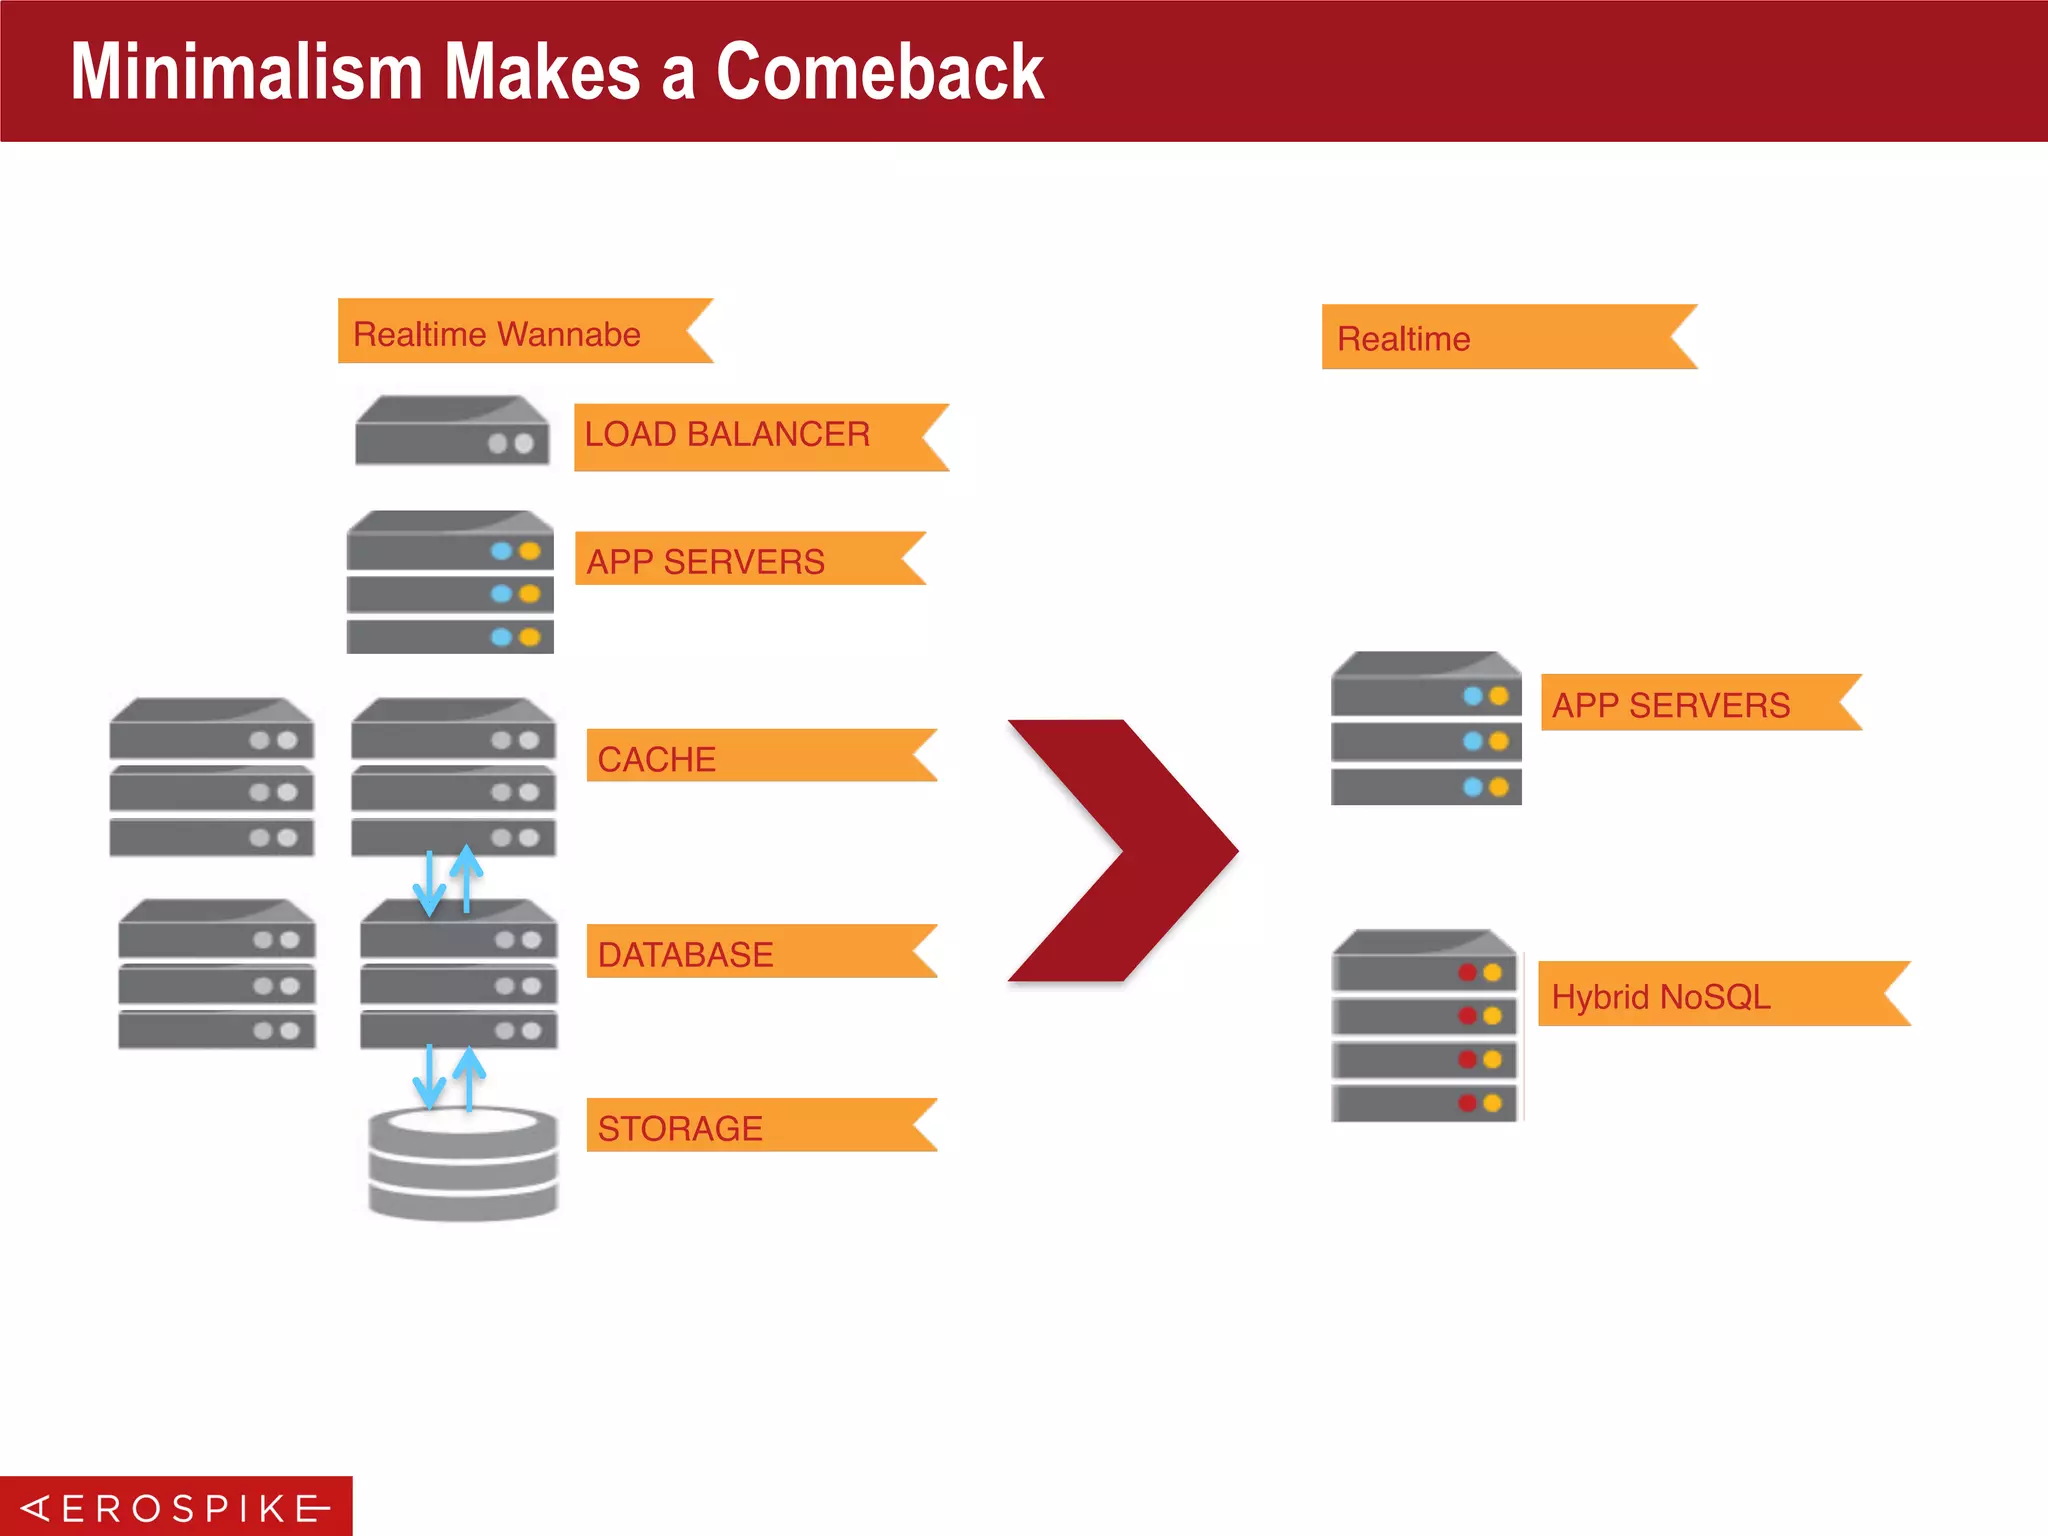
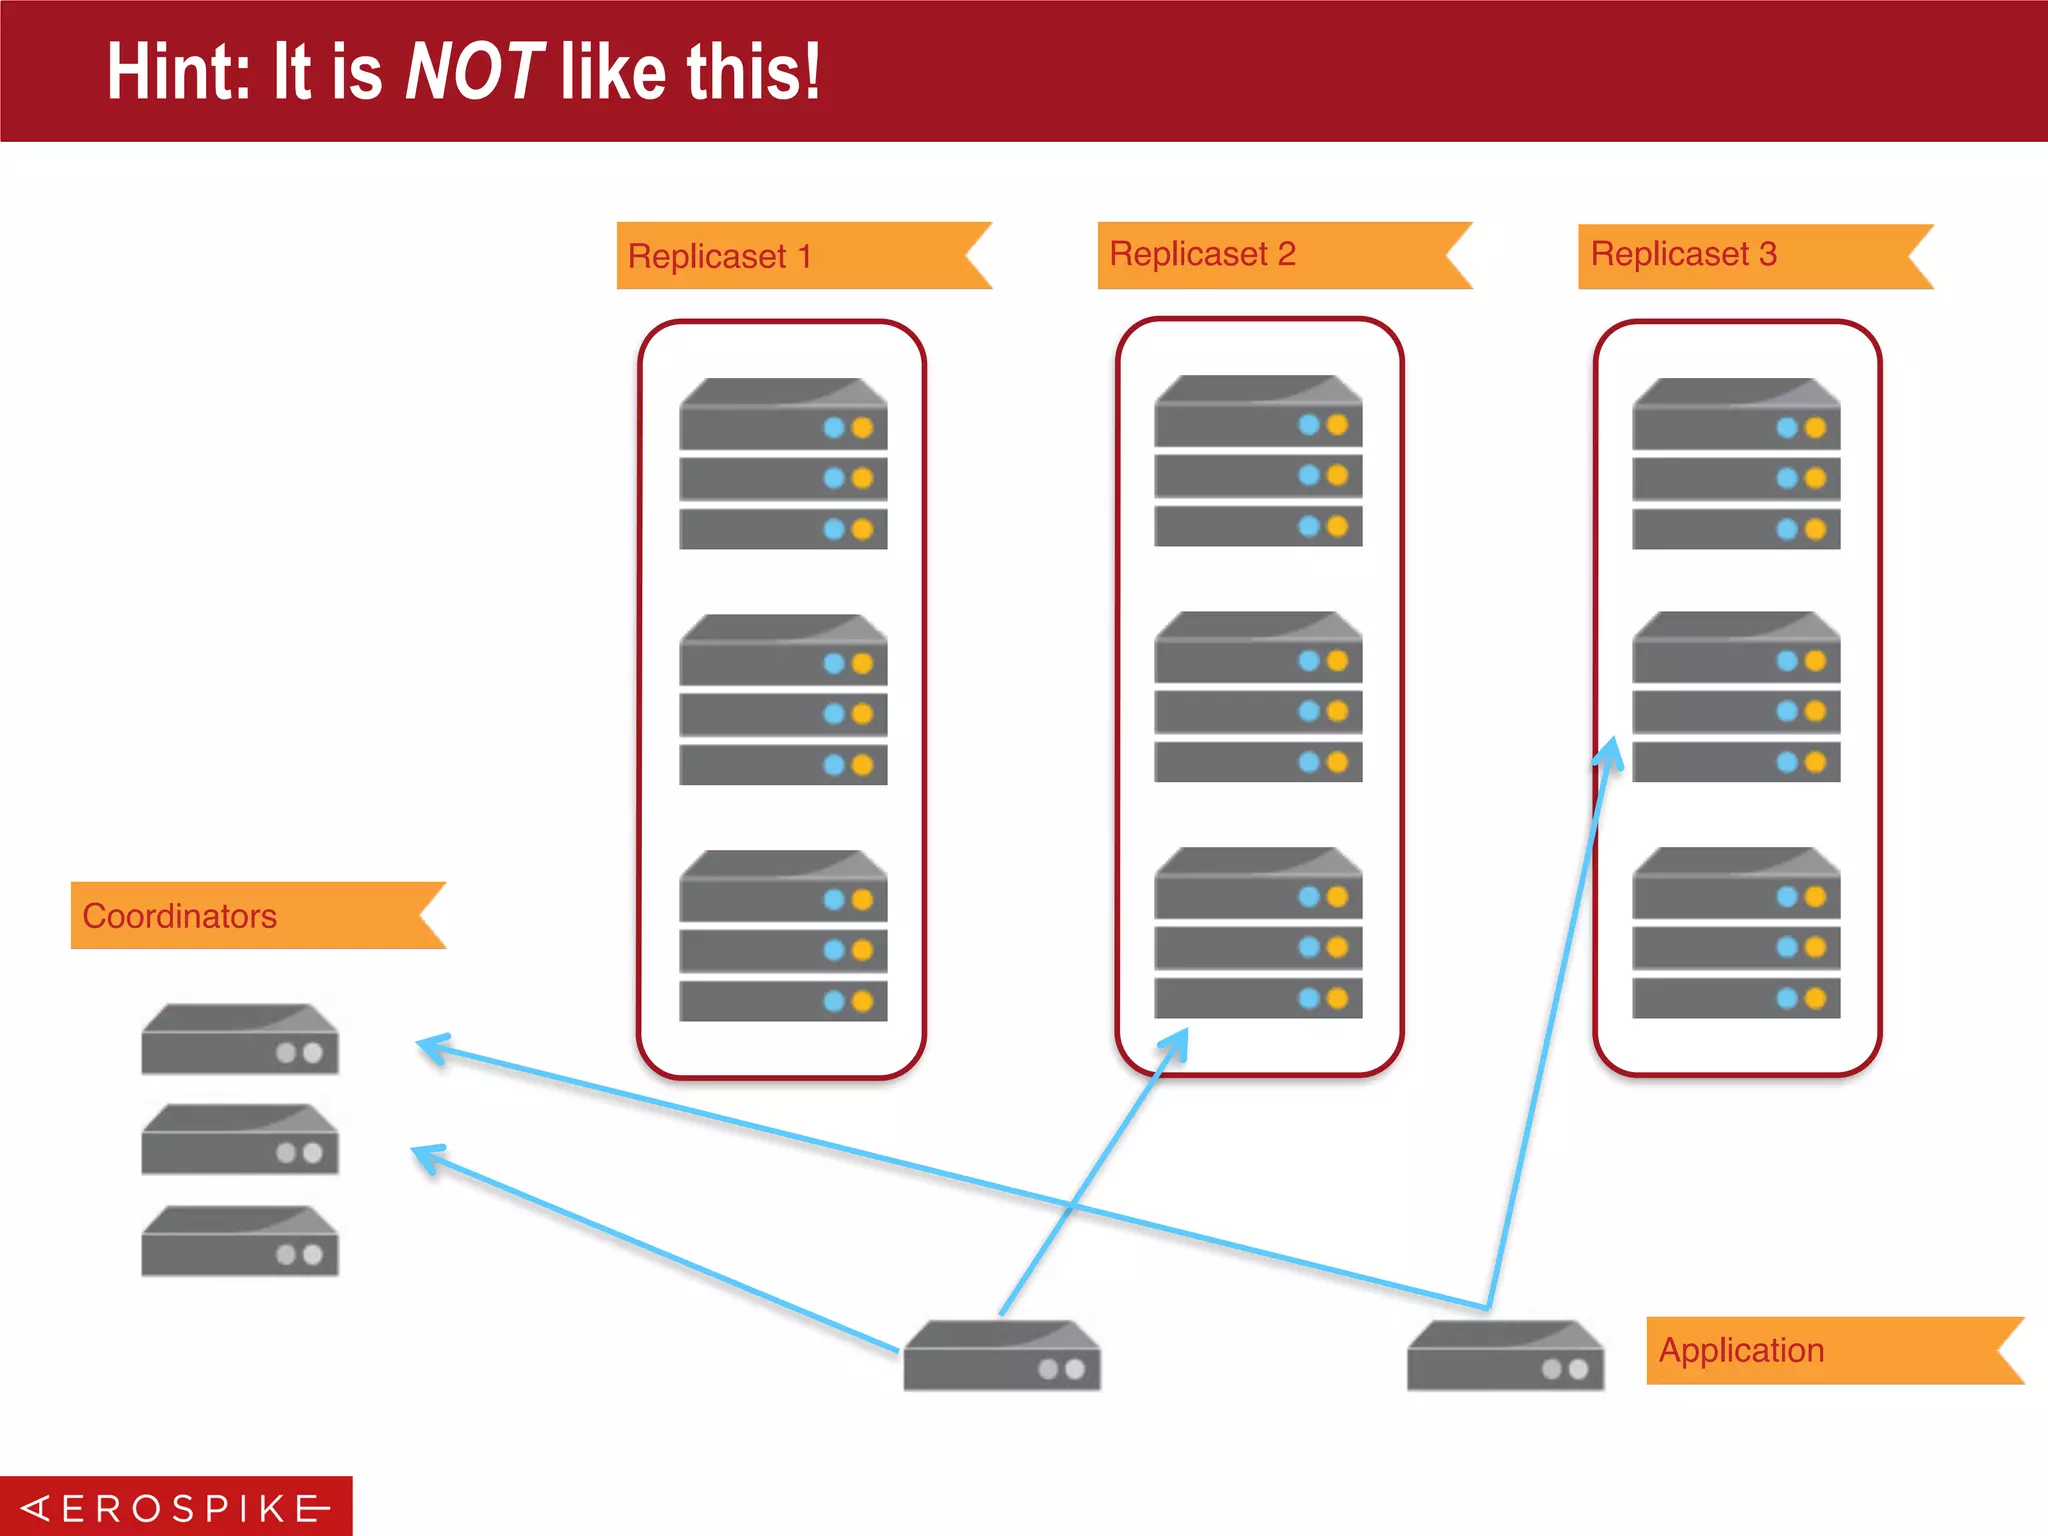
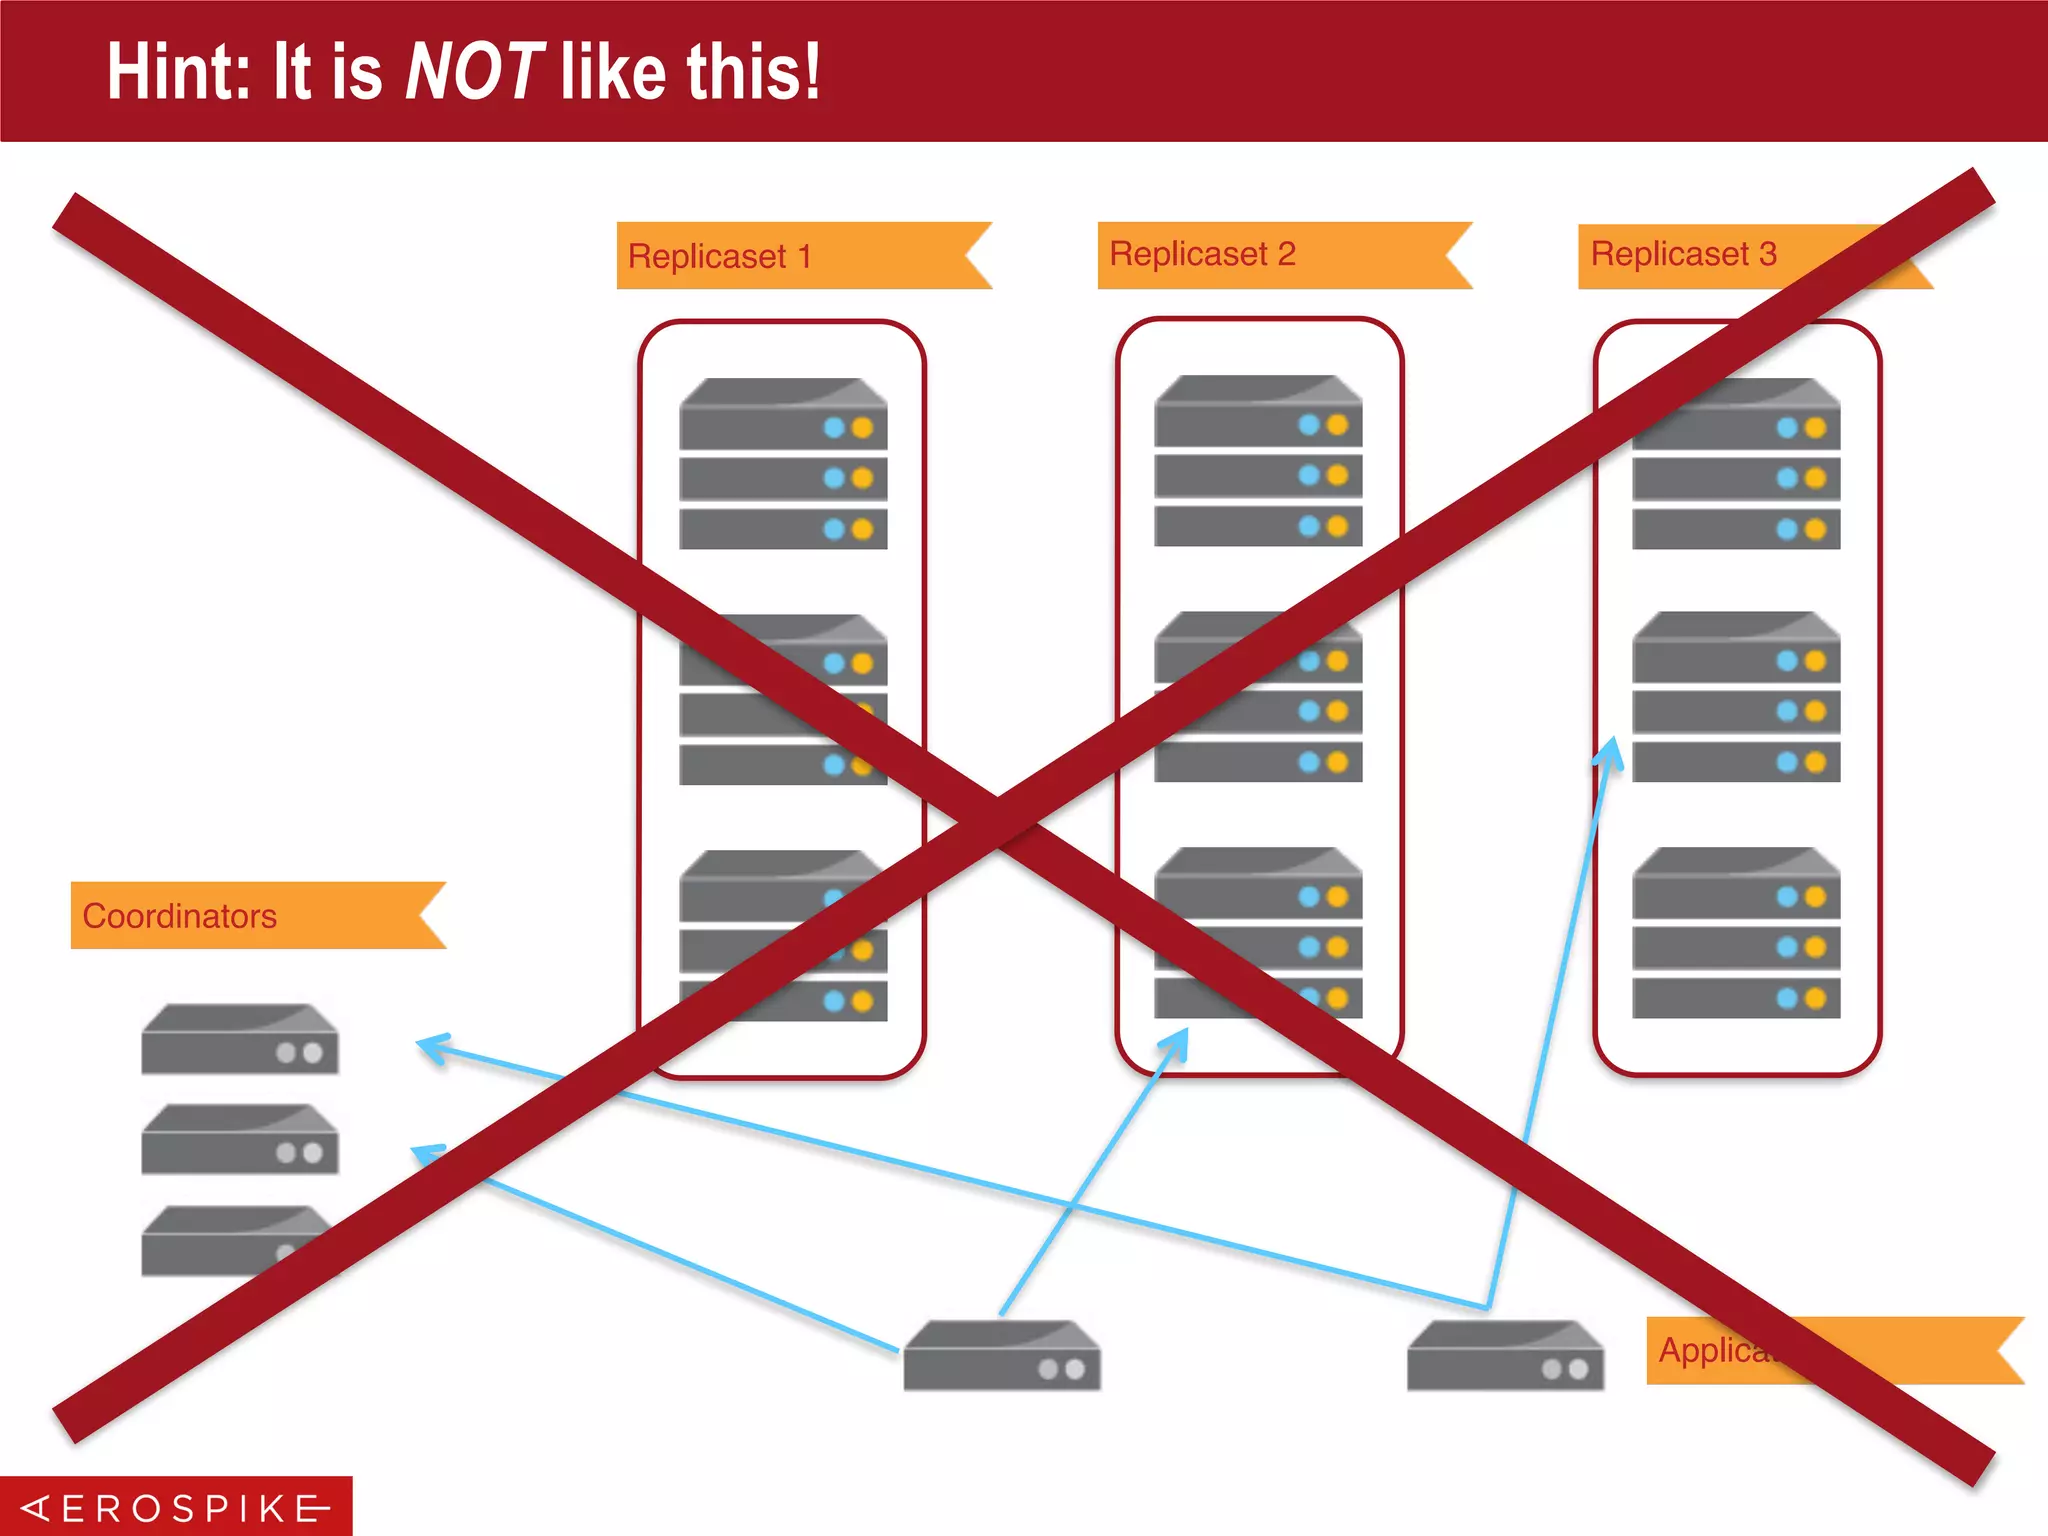
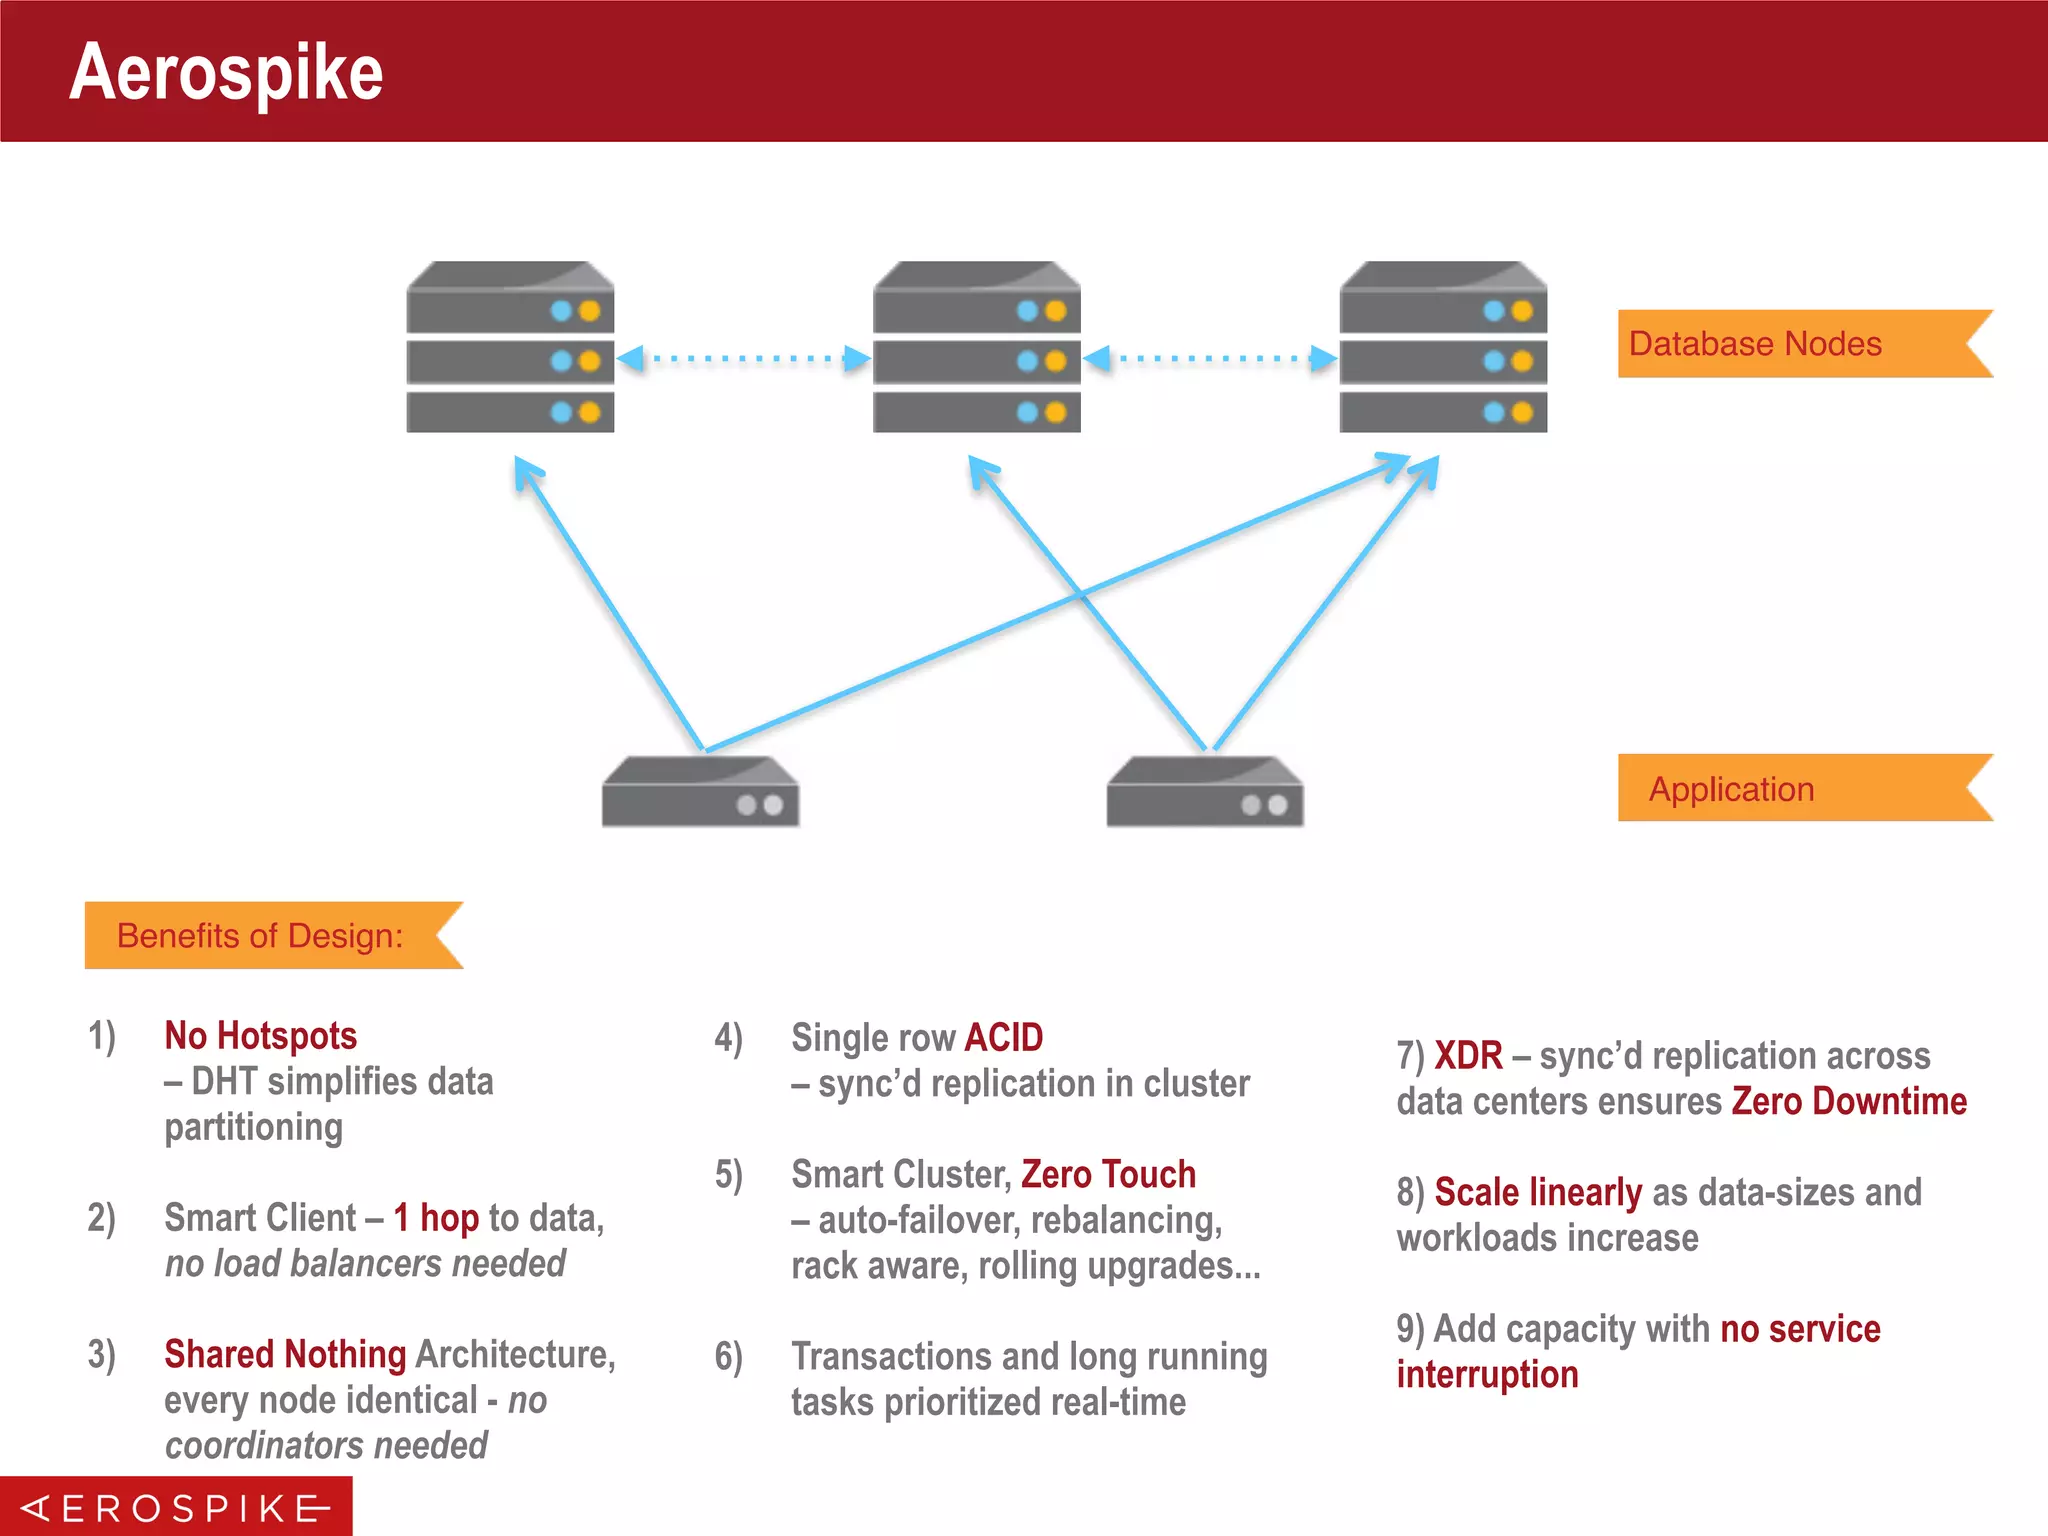
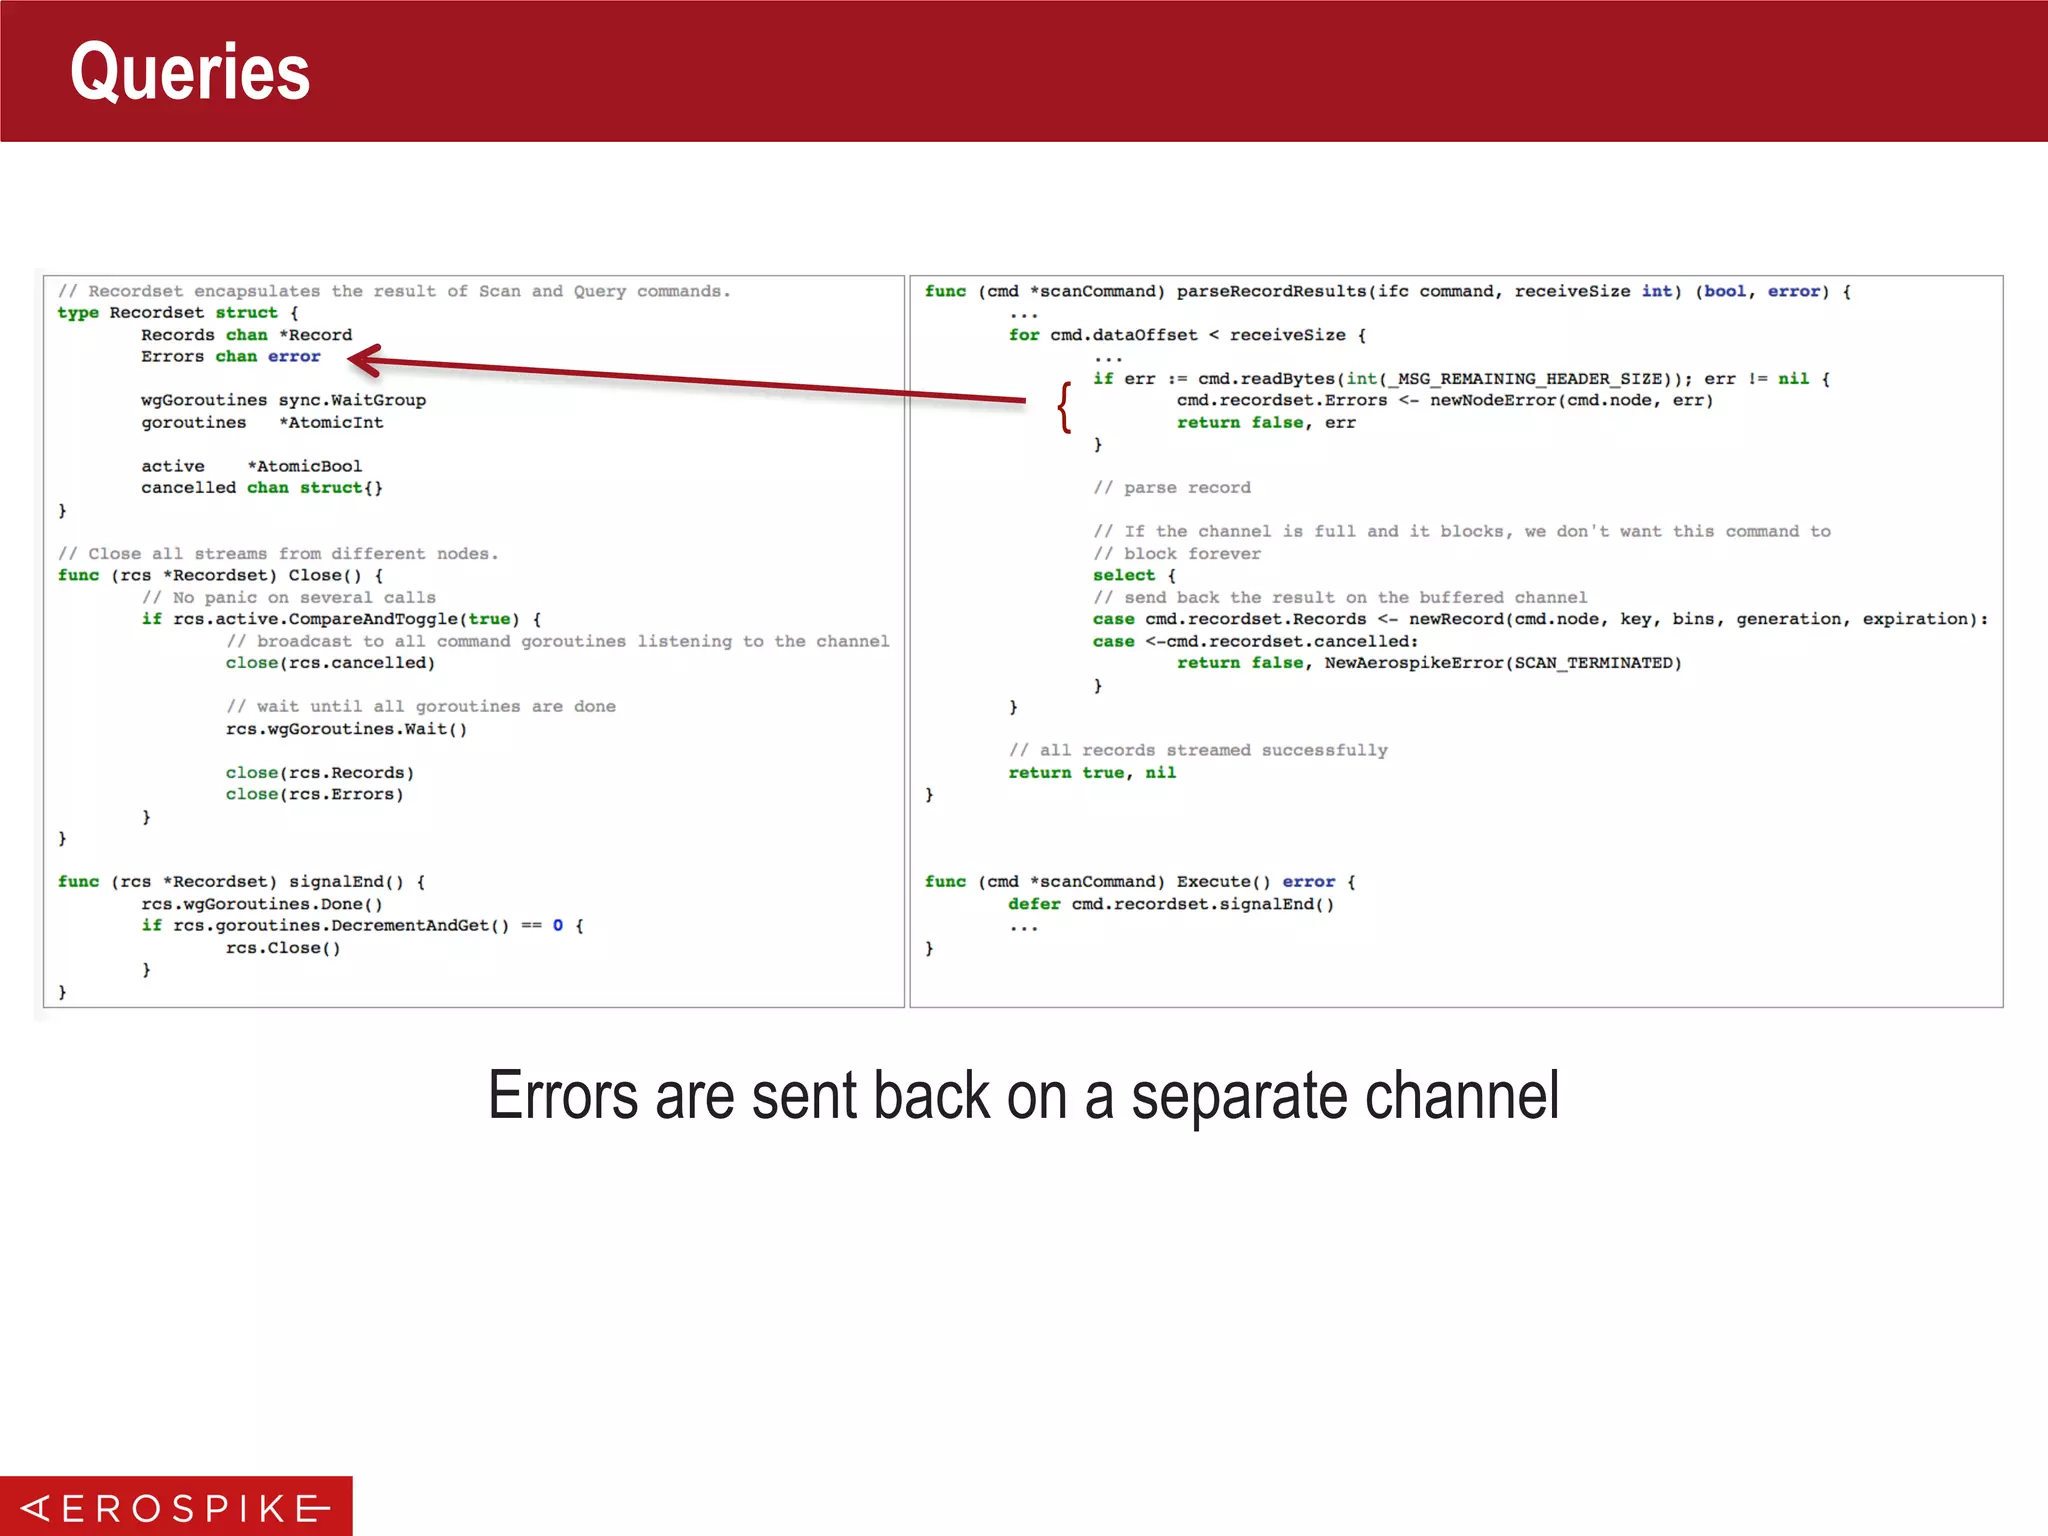
The document discusses high-performance data access in the context of North American real-time bidding (RTB), highlighting the need for low latency in ad delivery and efficient data processing. It outlines Aerospike's distributed database architecture and its capabilities, including linear scalability, shared-nothing architecture, and strong consistency features. Furthermore, the document emphasizes performance optimization techniques such as minimizing memory allocations and utilizing efficient data streaming and pooling strategies.