
Download as PDF, PPTX


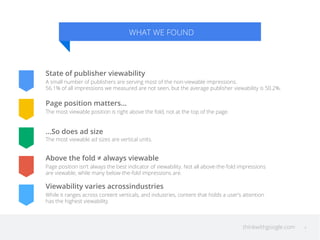

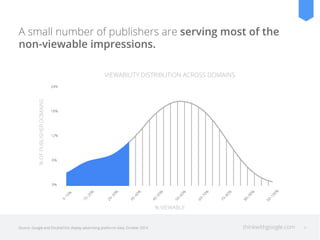
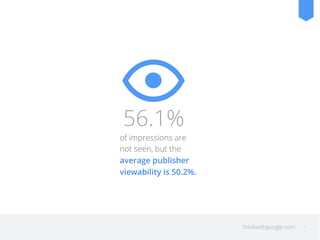

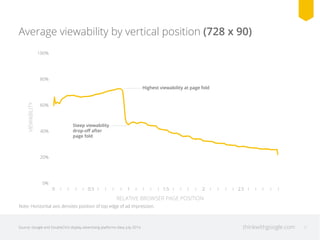
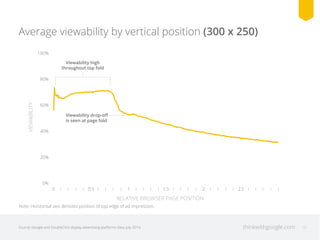
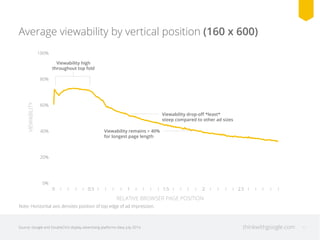
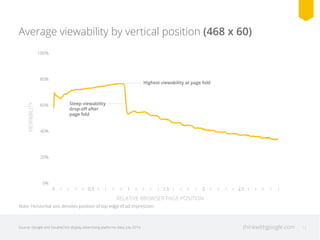
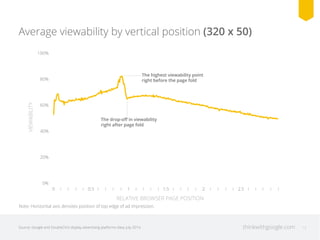

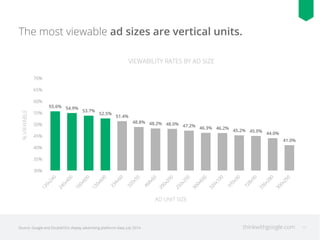

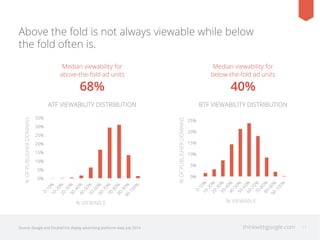

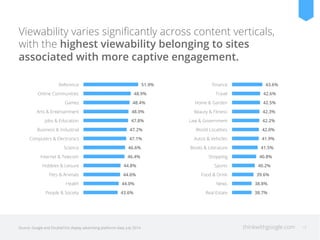
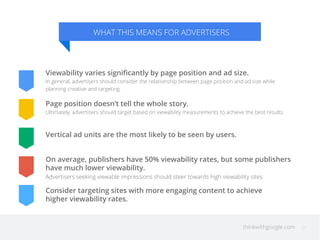

Google conducted a study of viewability rates on its advertising platforms to analyze trends in digital advertising. They found that 56.1% of impressions were not viewable, but the average publisher viewability rate was 50.2%. Certain publishers accounted for most non-viewable impressions. Page position and ad size also impacted viewability, with positions above the page fold and vertical ad units having higher rates. Viewability varied across content categories, with more engaging sites seeing higher rates. The findings provide guidance to advertisers on inventory and targeting strategies and to publishers on optimizing sites and monetizing inventory.


