Download to read offline


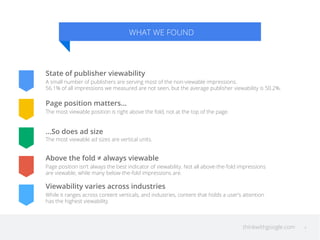

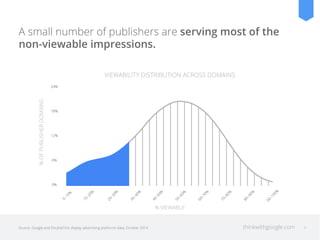
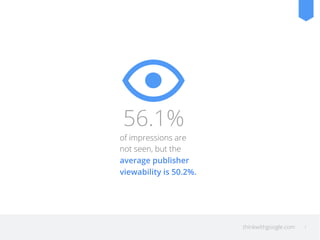

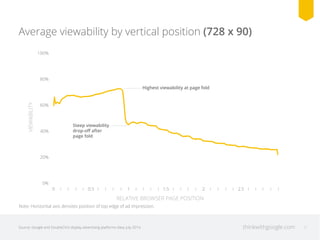
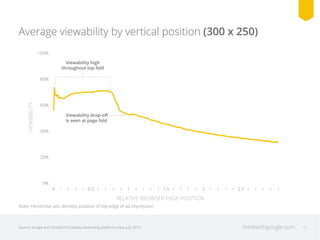
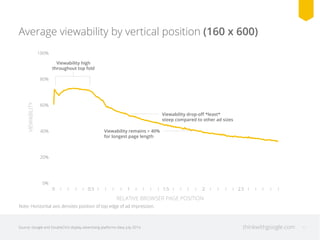
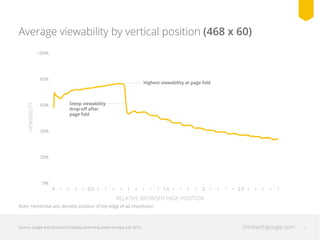
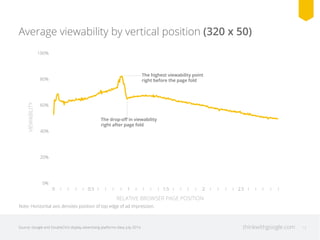

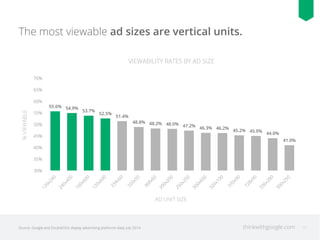

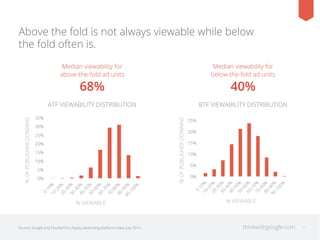

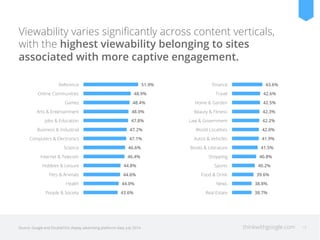

The document presents insights on ad viewability derived from a study by Google, revealing that a significant portion (56.1%) of impressions are not seen, with an average viewability rate of 50.2% across publishers. It emphasizes the impact of page position and ad size on viewability, indicating that vertical units and placements above the fold generally perform better. Additionally, it provides recommendations for advertisers and publishers on optimizing ad placements and using viewability data to enhance ROI and inventory value.


