Download as PDF, PPTX


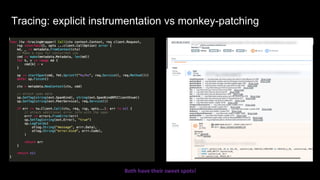
![{ …
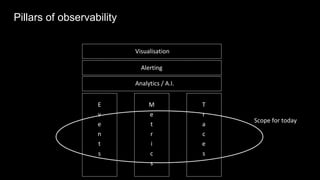
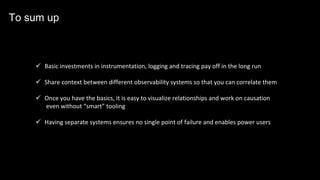
"_source": {
"stream": "stderr",
"time": "2016-06-27T14:48:39.15693871Z",
"correlation-id": "2e71f0ee-aab0-4fd0-87e7-530a9b26a37f",
"level": "debug",
"logger": "handler",
"message": "Handling MintSnowflakeID()",
"service": "com.sixt.service.idgen",
"service-id": "51494694-37c1-11e6-955e-02420afe040e",
"docker": { … }
”k8s": { … }
}
DEBUG[2017-09-27T14:48:39+02:00] Handling MintSnowflakeId() correlation-id=1365c96e-
281d-44aa-805a-1072ab165de6 ip-address=192.168.99.1 logger=handler service=com.sixt.service.idgen
service-id=a122da41-3d2e-11e6-8158-a0999b047f3f service-version=0.3.0
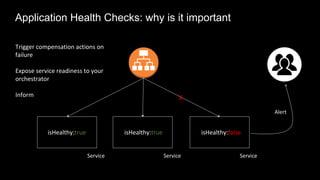
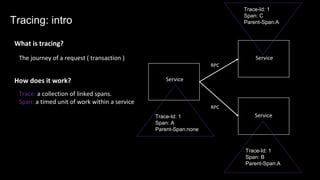
Whan an engineer sees
locally
Logging in action
Actual format
Logging in action](https://image.slidesharecdn.com/observability-foundations-in-dynamically-evolving-architectures-170928212545/85/Observability-foundations-in-dynamically-evolving-architectures-14-320.jpg)
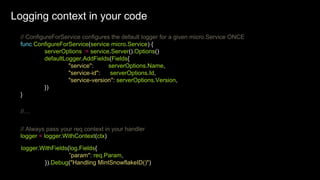


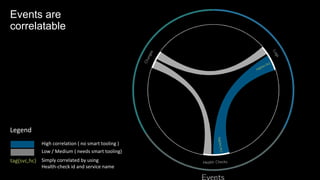

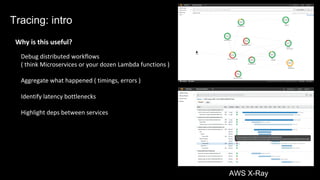
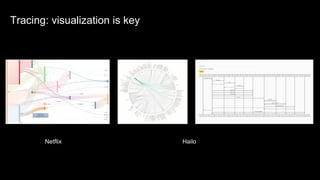
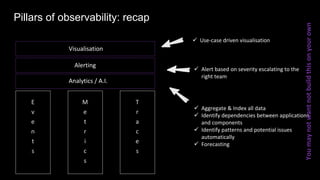
![// Somewhere in your handler
tags := map[string]string{
"method": req.Method(),
"origin_service": fromService,
"origin_method": fromMethod,
}
err := fn(ctx, req, rsp)
// Instrument errors
if err != nil {
TaggedCounter(tags, 1.0, "server_handler", "error", 1)
TaggedTiming(tags, 1.0, "server_handler", "error",
time.Since(start))
} else {
// Otherwise, success!
TaggedCounter(tags, 1.0, "server_handler", "success", 1)
TaggedTiming(tags, 1.0, "server_handler", "success",
time.Since(start))
}
Metrics: in action](https://image.slidesharecdn.com/observability-foundations-in-dynamically-evolving-architectures-170928212545/85/Observability-foundations-in-dynamically-evolving-architectures-26-320.jpg)
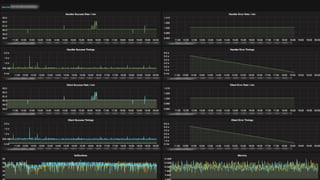
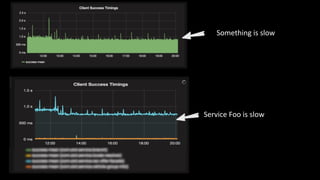

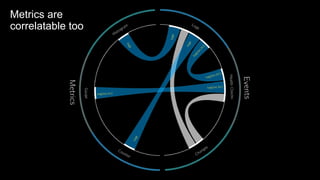
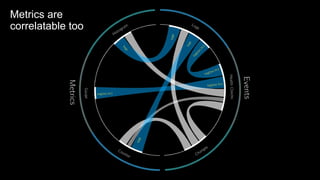


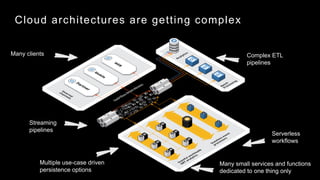
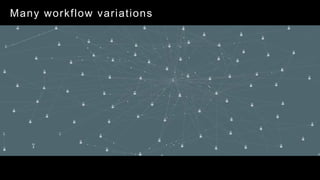
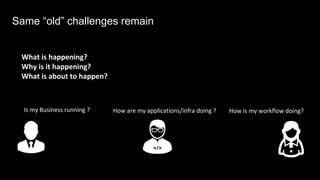
The document discusses observability in complex cloud architectures, focusing on logging, metrics, and tracing as essential components. It provides best practices for implementing structured logging, monitoring application health, and capturing metrics effectively. Additionally, it emphasizes the importance of visualizing and correlating data to understand system behaviors and improve troubleshooting.