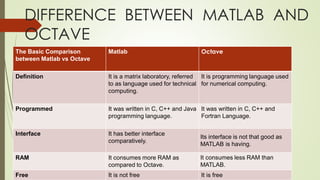
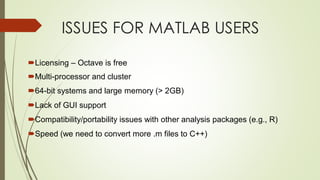
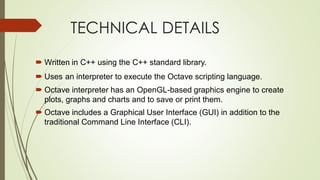
CONTENTS
 Introduction
 History
 Issues of matlab users
 Technical Details
 Some useful OCTAVE commands
 Introduction to Matrix
 Array , Vector and Matrix
 Plotting
 Functions
 Scripts
 Difference between Matlab And Octave
INTRODUCTION
 High level programming language
 Open Source Implementation
 Available in Linux and Windows
 Distributed in GPL(Gnu Public License)
 Designed for matrix computations
HISTORY
The project was conceived around 1988 . At first it was
intended to be a companion to a chemical reactor design
course. Real development was started by John W. Eaton in
1992. The first alpha release dates back to January 4, 1993 and
on February 17, 1994 version 1.0 was released. Version 4.0.0
was released on May 29, 2015. The latest version 5.1.0 of GNU
octave was released on March 1,2019.
ISSUES FOR MATLAB USERS
Licensing – Octave is free
Multi-processor and cluster
64-bit systems and large memory (> 2GB)
Lack of GUI support
Compatibility/portability issues with other analysis packages (e.g., R)
Speed (we need to convert more .m files to C++)
TECHNICAL DETAILS
 Written in C++ using the C++ standard library.
 Uses an interpreter to execute the Octave scripting language.
 Octave interpreter has an OpenGL-based graphics engine to create
plots, graphs and charts and to save or print them.
 Octave includes a Graphical User Interface (GUI) in addition to the
traditional Command Line Interface (CLI).
SOME USEFUL OCTAVE COMMANDS
 who List Known variables
 whos List known variables plus their size
 help help in finding any command
 clear Clear all variables from workspace
 clear x y Clear variables x and y from workspace
 clc Clear the command windows
 ver Display the information of version of OCTAVE
 exit quit from OCTAVE session
INTRODUCTION TO MATRIX
Creating a Matrix
Simply type:
octave:1> A = [8, 2, 1; 3, -1, 4; 7, 6, -5]
Octave will respond with a matrix in pretty-print:
A =
8 2 1
3 -1 4
7 6 -5
Indexing
Always "row before column"!
aij = A(i,j) Get an element
r = A(i,:) Get a row
c = A(:,j) Get a column
B = A(i:k,j:l) Get a submatrix
Useful indexing command end :
octave:1> data = [4 -1 35 9 11 -2];
octave:2> v = data(3:end) ;
v =
35 9 11 -2
ARRAYS, VECTORS, AND MATRICES
Array :
A collection of data elements
arranged in rows and columns
C={1 , 2 , 3; 4 , 5 , 6};
Vector:
A one-dimensional array (single row or
single column of data elements)
Matrix :
A two-dimensional array (more than
one row and/or column of data
elements)
>> A=[1;9]
>> B=[1;8;3;7]
>> C=[1:3; 4:6; 7:9]
row or column?
column vector
C =
1 2 3
4 5 6
7 8 9
PLOTTING
Plotting in 2D
 plot(x,cos(x)) Display x,y-plot
Creates automatically a figure window. Octave uses gnu plot to
handle graphics.
 figure(n) Create figure window 'n'
If the figure window already exists, brings it into the foreground
(makes it the current figure)
 figure Create new figure window with
identifier incremented by 1
EXAMPLE OF PLOTTING
>> x=0:pi/100:2*pi;
>> y1=sin(2*x);
>> y2=2*cos(2*x);
>>plot(x,y1);
>> hold on;
>> plot(x,y2);
FREQUENT COMMANDS
▪ clf Clear figure
▪ hold on Hold axes. Don't replace plot with
new plot, superimpose plots
▪ grid on Add grid lines
▪ grid off Remove grid lines
▪ title('Exp1') Set title of figure window
▪ xlabel(‘label name ') Set label of x-axis
▪ ylabel(‘label name') Set label of y-axis
▪ subplot Put several plot axes into figure
LINE SPECIFIERS
Line Style Specifier
Solid(Default) -
Dashed --
Dotted .
Dash-dot -.
Line color Specifier
Red r
Green g
Blue b
Cyan c
Magenta m
Yellow y
Black k
White w
Ex : Find the response to an input of 5u(t).
Given that amplitude of step input is 5 .
Program:
Sys1=tf([1 1 ]*5,[4 4])
Sys2=tf([1]*5,[4 1])
Step(sys,1);
Hold on;
Step(sys,2)
FUNCTIONS
Functions and their m-File
▪ When putting a function into its m-file, the name of that file must be the
same as the function name plus the .m extension.
Examples: calcmoments.m, findfirstpeak.m
▪ To call a function, type its name without the .m extension. Example:
[bool i] = findfirstpeak(myreadings, 0.3);
▪ Comments in Octave/Matlab start with % .
SCRIPTS
Scripts
▪ The second type of m-files is called script. Again, Octave scripts
are text files with an
.m extension.
▪ Scripts contain executable code. They are basically the "main"
programs.
▪ Execute a script by typing its name without the .m extension!
Example: octave:1> LocalizeRobot
DIFFERENCE BETWEEN MATLAB AND
OCTAVE
The Basic Comparison
between Matlab vs Octave
Matlab Octave
Definition It is a matrix laboratory, referred
to as language used for technical
computing.
It is programming language used
for numerical computing.
Programmed It was written in C, C++ and Java
programming language.
It was written in C, C++ and
Fortran Language.
Interface It has better interface
comparatively.
Its interface is not that good as
MATLAB is having.
RAM It consumes more RAM as
compared to Octave.
It consumes less RAM than
MATLAB.
Free It is not free It is free
THANK YOU

GNU octave

  • 1.
    CONTENTS  Introduction  History Issues of matlab users  Technical Details  Some useful OCTAVE commands  Introduction to Matrix  Array , Vector and Matrix  Plotting  Functions  Scripts  Difference between Matlab And Octave
  • 2.
    INTRODUCTION  High levelprogramming language  Open Source Implementation  Available in Linux and Windows  Distributed in GPL(Gnu Public License)  Designed for matrix computations
  • 3.
    HISTORY The project wasconceived around 1988 . At first it was intended to be a companion to a chemical reactor design course. Real development was started by John W. Eaton in 1992. The first alpha release dates back to January 4, 1993 and on February 17, 1994 version 1.0 was released. Version 4.0.0 was released on May 29, 2015. The latest version 5.1.0 of GNU octave was released on March 1,2019.
  • 4.
    ISSUES FOR MATLABUSERS Licensing – Octave is free Multi-processor and cluster 64-bit systems and large memory (> 2GB) Lack of GUI support Compatibility/portability issues with other analysis packages (e.g., R) Speed (we need to convert more .m files to C++)
  • 5.
    TECHNICAL DETAILS  Writtenin C++ using the C++ standard library.  Uses an interpreter to execute the Octave scripting language.  Octave interpreter has an OpenGL-based graphics engine to create plots, graphs and charts and to save or print them.  Octave includes a Graphical User Interface (GUI) in addition to the traditional Command Line Interface (CLI).
  • 6.
    SOME USEFUL OCTAVECOMMANDS  who List Known variables  whos List known variables plus their size  help help in finding any command  clear Clear all variables from workspace  clear x y Clear variables x and y from workspace  clc Clear the command windows  ver Display the information of version of OCTAVE  exit quit from OCTAVE session
  • 7.
    INTRODUCTION TO MATRIX Creatinga Matrix Simply type: octave:1> A = [8, 2, 1; 3, -1, 4; 7, 6, -5] Octave will respond with a matrix in pretty-print: A = 8 2 1 3 -1 4 7 6 -5
  • 8.
    Indexing Always "row beforecolumn"! aij = A(i,j) Get an element r = A(i,:) Get a row c = A(:,j) Get a column B = A(i:k,j:l) Get a submatrix Useful indexing command end : octave:1> data = [4 -1 35 9 11 -2]; octave:2> v = data(3:end) ; v = 35 9 11 -2
  • 9.
    ARRAYS, VECTORS, ANDMATRICES Array : A collection of data elements arranged in rows and columns C={1 , 2 , 3; 4 , 5 , 6}; Vector: A one-dimensional array (single row or single column of data elements) Matrix : A two-dimensional array (more than one row and/or column of data elements) >> A=[1;9] >> B=[1;8;3;7] >> C=[1:3; 4:6; 7:9] row or column? column vector C = 1 2 3 4 5 6 7 8 9
  • 10.
    PLOTTING Plotting in 2D plot(x,cos(x)) Display x,y-plot Creates automatically a figure window. Octave uses gnu plot to handle graphics.  figure(n) Create figure window 'n' If the figure window already exists, brings it into the foreground (makes it the current figure)  figure Create new figure window with identifier incremented by 1
  • 11.
    EXAMPLE OF PLOTTING >>x=0:pi/100:2*pi; >> y1=sin(2*x); >> y2=2*cos(2*x); >>plot(x,y1); >> hold on; >> plot(x,y2);
  • 12.
    FREQUENT COMMANDS ▪ clfClear figure ▪ hold on Hold axes. Don't replace plot with new plot, superimpose plots ▪ grid on Add grid lines ▪ grid off Remove grid lines ▪ title('Exp1') Set title of figure window ▪ xlabel(‘label name ') Set label of x-axis ▪ ylabel(‘label name') Set label of y-axis ▪ subplot Put several plot axes into figure
  • 13.
    LINE SPECIFIERS Line StyleSpecifier Solid(Default) - Dashed -- Dotted . Dash-dot -. Line color Specifier Red r Green g Blue b Cyan c Magenta m Yellow y Black k White w
  • 14.
    Ex : Findthe response to an input of 5u(t). Given that amplitude of step input is 5 . Program: Sys1=tf([1 1 ]*5,[4 4]) Sys2=tf([1]*5,[4 1]) Step(sys,1); Hold on; Step(sys,2)
  • 15.
    FUNCTIONS Functions and theirm-File ▪ When putting a function into its m-file, the name of that file must be the same as the function name plus the .m extension. Examples: calcmoments.m, findfirstpeak.m ▪ To call a function, type its name without the .m extension. Example: [bool i] = findfirstpeak(myreadings, 0.3); ▪ Comments in Octave/Matlab start with % .
  • 16.
    SCRIPTS Scripts ▪ The secondtype of m-files is called script. Again, Octave scripts are text files with an .m extension. ▪ Scripts contain executable code. They are basically the "main" programs. ▪ Execute a script by typing its name without the .m extension! Example: octave:1> LocalizeRobot
  • 17.
    DIFFERENCE BETWEEN MATLABAND OCTAVE The Basic Comparison between Matlab vs Octave Matlab Octave Definition It is a matrix laboratory, referred to as language used for technical computing. It is programming language used for numerical computing. Programmed It was written in C, C++ and Java programming language. It was written in C, C++ and Fortran Language. Interface It has better interface comparatively. Its interface is not that good as MATLAB is having. RAM It consumes more RAM as compared to Octave. It consumes less RAM than MATLAB. Free It is not free It is free
  • 18.