The global markets update provided the following key information:
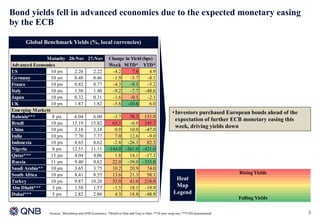
1) Bond yields fell in advanced economies due to expected ECB monetary easing, while a widening divergence between ECB and Fed policy stoked a US dollar rally and weaker euro.
2) EM equities fell on capital flight owing to expectations of higher US interest rates, while advanced markets were stable.
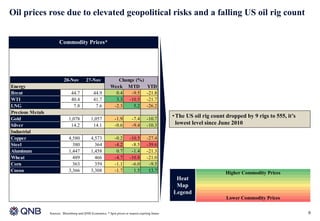
3) Oil prices rose due to elevated geopolitical risks and a falling US oil rig count.
4) The ECB monetary policy decision and US nonfarm payrolls are likely to dominate markets this week.