SlideShare a Scribd company logo
1 of 71
By
Dr.R.Nagalakshmi
SUBCODE: 18CEO406T
SUB NAME:GLOBAL WARMING AND CLIMATE
CHANGE
UNIT I - EARTH’S CLIMATE SYSTEM
Earth's climate arises from the interaction of five
major climate system components:
1. Atmosphere (air),
2. Hydrosphere (water),
3. Cryosphere (ice and permafrost),
4. Lithosphere (earth's upper rocky layer) and
5. Biosphere (living things)
ATMOSPHERE:stratospheric ozone layer,oxygen, greenhouse gases,
aerosols, water vapour, clouds, black carbon, tropospheric ozone.
OCEANS: moderate climate, absorb heat and CO2, phytoplankton
start the ocean carbon sink.
CRYOSPHERE:ice and snow- reflect solar heat, frozen soil
permafrost is a large carbon store, frozen ocean floor methane
hydrates another huge carbon store.
FORESTS: huge carbon store, net CO2 emissions when cleared.
SOILS: store and emit CO2 esp. peat lands
MOUNTAINS: 'permanent' carbon store as limestone and dolomite
that are formed under the ocean depths, long term weathering
carbon source.
VOLCANOES: emit short term cooling aerosols and long term
warming CO2
Importance of climate system
Layers of Atmosphere
• Weather is the day-to-day state of the
atmosphere, and its short-term variation in
minutes to weeks. People generally think of
weather as the combination of temperature,
humidity, precipitation, cloudiness, visibility,
and wind
WEATHER
• The climate of a place may be defined as a
"composite" of the long-term prevailing weather
that occurs at that location.
• Climate is the weather of a place averaged over a
period of time, often 30 years
• In a sense, climate is "average weather".
• Climate can be measured quantitatively by
calculating the long term averages of different
climate elements such as temperature and
rainfall. ..
CLIMATE
Atmospheric
Measurements
Temperature
Pressure
Humidity
Wind Velocity and Direction
Atmospheric Pressure
• Atmospheric pressure is the force per unit area exerted on a surface
by the weight of air above that surface in the atmosphere of earth
(or that another planet).
• In most circumstances atmospheric pressure is closely
approximated by the hydrostatic pressure caused by the weight of
air above the measurement point.
• On a given plane, low-pressure areas have less atmospheric mass
above their location, whereas high-pressure areas have more
atmospheric mass above their location. Likewise, as elevation
increases, there is less overlying atmospheric mass, so that
atmospheric pressure decreases with increasing elevation.
Atmospheric Composition affects Air
Temperature
Air temperature also changes as altitude
increases. The temperature differences result
mainly from the way solar energy is absorbed
as it moves through the atmosphere.
Some parts of the atmosphere are warmer
because they contain a high percentage of
gases that absorb solar energy.
Other parts of the atmosphere contain less of
these gases and are cooler.
Heat and Temperature
Temperature: Average energy of molecules or
atoms in a material.
Heat: Total energy of molecules or atoms in a
material.
It’s possible to have large amount of heat but
low temperatures and high temperatures but
little heat.
Heat and Temperature
 The Arctic Ocean has a large amount of heat (because
of large mass) even though the temperature is low.
 Air in an oven at 500⁰F has high temperature but little
heat.
 However if you touch anything solid in the oven
you’ll get burned. Same temperature but much larger
amount of heat.
 The earth’s outermost atmosphere is extremely “hot”
but its heat content is negligible.
 It takes time for things to warm up and cool off.
Temperature Scales
1) Fahrenheit
a) Water Freezes at 32 F
b) Water Boils at 212 F
2) Centigrade or Celsius
a) Water Freezes at 0 C
b) Water Boils at 100 C
3) Two scales exactly equal at -40
Absolute Temperature
Once atoms stop moving  that’s as cold as it
can get.
Absolute Zero  -273⁰C / -459⁰F.
Kelvin scale uses Celsius degrees and starts at
absolute zero.
Most formulas involving temperature use the
Kelvin Scale.
Atmospheric humidity
• Atmospheric humidity is the amount of water
vapour carried in the air. It can be measured
as vapour pressure, mixing ratio or
specific humidity. ... Atmospheric water
vapour is also the most important greenhouse
gas in the atmosphere.
Types of Humidity
• (i) Relative humidity,
• (ii) Specific humidity,
• (iii) Mixing ratio, and
• (iv) Absolute humidity.
• It is the ratio of mass of water vapours actually
present in the air to a unit mass of air including
the water vapour (dry air + moisture). It is
expressed as grams of water vapour per kg of
moist air mass. The amount of water vapour that
air can hold depends upon temperature. Specific
humidity at 20°C is 15g per kg. At 30°C, it is 26 g
per kg and at -10°C, it is 2 g per kg.
• Suppose, 1kg of air contains 12 grams of water
vapours, then the specific humidity of air is 12 g
per kg.
Specific Humidity:
• Relative humidity may also be defined as the
ratio of actual vapour pressure to that
required for saturation at the same
temperature.
• Mixing Ratio:
• It is defined as the ratio of mass of water
vapours per unit mass of dry air. It is also
defined as the ratio of density of water
vapours to the density of dry air. It varies from
1 g per kg in arctic zone to 40 g per kg in
humid equatorial zone.
Absolute Humidity:
• It is defined as the weight of water vapours in a
given volume of air. It is expressed as grams of
water vapours per cubic meter of air (g m-3).
Absolute humidity is rarely used because it varies
with the expansion and contraction of air. It
varies with temperature, even though the
amount of water vapours remains constant.
Rainfall
• Rainfall is a form of Precipitation. The term
"rainfall" is used to describe precipitation in
the form of water drops of sizes larger than
0.5 mm. Other forms are snow, drizzle, glaze,
sleet and hail. ... Sleet is frozen raindrops of
transparent grains which form when rain falls
through air at subfreezing temperature.
Types of Rainfall
Convectional Rainfall
• Suppose we are enjoying the rays of sunshine and suddenly, the sky
gets darker with the grey cloud. Without any warning the heavens
open and it begins to rain, with a thundery feel. This is the
convectional rain. It occurs frequently on hot days usually giving
cumulus cloud and thundery showers.
• The sun heats the ground which causes the air to warm and
become very hot. Then the air rises upwards and becomes cool.
Then it condenses to form cumulus cloud.
• When this cloud is saturated, it begins to precipitate giving heavy
and thundery showers. Due to this, we get thundershowers on a
hot day, as the Sun warms the air and it rises, cools and begins to
rain.
Frontal Rainfall
• This rainfall occurs when a warm, tropical air mass comes in contact
with a cold, polar air mass. It is very common in Britain and Ireland.
Because the air is in the warm front, then it rises over the cold
front. The air is cooled and so condenses to form a stratus cloud.
Thus when the stratus cloud becomes saturated, it begins to
precipitate.
Relief Rainfall
• This type of rainfall is common in places with mountains
and sea. Relief rainfall frequently occurs near mountains
beside the sea. The moisture-laden wind blows in from the
sea because the wind meets a high mountain and hence it
is forced to rise upwards. At the height, it is cooled and
then the cloud is formed.
• This saturated cloud with water vapor begins to precipitate
on the side of the mountain facing the sea. This front side
of the mountain is called the windward side.
• The cloud mostly precipitates on the windward side of the
mountain. Meanwhile, the cloud meets the other side,
which is called the leeward side. Since the cloud has
already lost most of its moisture so it rains very little there.
• This makes leeward sides of a mountain very little rains.
There is a much more moist climate on the windward sides
of slopes. On the other hand, there is a more dry,
sheltered climate on the leeward side. This rainfall is
common in Hawaii, Sierra Nevada, and the Andes.
Air movement
Air moves from areas of high atmospheric
pressure to areas of low atmospheric pressure
Low pressure areas - troughs
High pressure areas - ridges
Influences on air movement
Pressure gradient force
Coriolis effect
Friction  Close to ground
Friction between atmosphere and surface slows air
down
Winds are stronger at high elevations
Solar radiation
 Regions near the
equator receive light at
90o
 High latitudes receive
light at low angles
 Light energy is more
concentrated near the
equator. In other words,
there is a greater flux
per unit area (W/m2)
Solar energy received is greatest near the
equator.
Energy is moved from the equator to the
poles.
Energy is transferred by wind and ocean
currents
Air near the equator is warmed, and rises
Solar
radiation
Warm air rises
Air cools, sinks
Rising air is replaced
Hadley Circulation Cell
LOW
HIGH HIGH
Warm air rises
Air cools, sinks
Rising air is replaced
LOW
HIGH HIGH
Rising air cools; the air’s
capacity to hold water
drops. Rain!
No rain in
regions
where
air is
descending
 Due to the rotation of the earth, wind and ocean
currents are deflected to the right in the northern
hemisphere and to the left in the southern
hemisphere. This effect is known as the "Coriolis
force."
 The deflection leads to highs and lows of sea level
directly proportional to the speed of the surface
currents
Coriolis force
The Earth would have two large Hadley cells, if it did not
rotate.
Rotation of the Earth leads to the Coriolis Effect
This causes winds (and all moving objects) to be
deflected:
To the right in the Northern Hemisphere
To the left in the Southern Hemisphere
Global Wind Pattern
Ocean circulation is the large scale movement of waters in the ocean
basins.
There are two main types of ocean currents: currents driven mainly by wind
and currents mainly driven by density differences. Density depends on
temperature and salinity of the water.
1. Horizontal circulation
1. Surface currents
2. Deep currents
(Cold and salty water is dense and will sink. Warm and less salty
water will float)
1. Vertical circulation
1. Upwelling
2. Downwelling
Global ocean circulation
Horizontal currents:
Winds drive surface circulation, and the cooling and sinking of waters in the polar
regions drive deep circulation.
 Surface circulation carries the warm upper waters poleward from the
tropics.
 Heat is disbursed along the way from the waters to the atmosphere. At the
poles, the water is further cooled during winter, and sinks to the deep
ocean. This is especially true in the North Atlantic and along Antarctica.
 Deep ocean water gradually returns to the surface nearly everywhere in
the ocean. Once at the surface it is carried back to the tropics, and the cycle
begins again. The more efficient the cycle, the more heat is transferred,
and the warmer the climate.
 Winds blowing across the ocean surface push water away.
Water then rises up from beneath the surface to replace the
water that was pushed away. This process is known as
“upwelling.”
 Upwelling occurs in the open ocean and along coastlines. The
reverse process, called “downwelling,”
 ocean currents have a major impact on the global
climate. They cause the relative mildness of the Western
European climate, for example.
 Ocean and atmospheric currents form a coupled
dynamic system. Instabilities of this system, the El Nino
Southern Oscillation (ENSO) in particular, produce
important climate fluctuations.
 Ocean currents not only distribute heat, but they also
play a crucial role in the global ecosystem by
storing CO2 and recycling nutrients.
Importance of ocean circulation
Atmospheric lapse rate
 The atmospheric lapse rate refers to the change of an atmospheric
variable with a change of altitude, the variable
being temperature unless specified otherwise (such
as pressure, density or humidity).
 Lapse rates are usually expressed as the amount of temperature
change associated with a specified amount of altitude change, such
as 9.8 K per kilometre, 0.0098 K per metre or the equivalent
5.4 °F per 1000 feet.
 If the atmospheric air cools with increasing altitude, the lapse rate
may be expressed as a negative number. If the air heats with
increasing altitude, the lapse rate may be expressed as a positive
number.
Lapse rates and atmospheric stability
 Atmospheric stability is a term used to qualitatively describe the amount of
vertical motion of the air in the lower atmosphere (the troposphere). In
broad general terms, the atmospheric stability can be characterized by these
four categories:
 A very stable atmosphere is one that has very little vertical motion of the
air.
 A stable atmosphere is one that discourages vertical motion but does have
some motion of the air.
 An unstable atmosphere is one that encourages continual vertical motion of
the air, upwards or downwards.
 A neutral atmosphere is one that neither discourages nor encourages
vertical motion of the air and is often referred to as conditionally stable.
 The numerical value of the environmental lapse rate determines the stability
category of the atmospheric air.
 If the environmental lapse rate (i.e., the actual ambient temperature gradient) is
greater than zero as for the rate marked 1 in the diagram, then an inversion layer is
present and the atmospheric temperature increases with altitude. There is essentially
no vertical turbulence and the atmosphere is said to be very stable or extremely
stable.
 If the environmental lapse rate is greater than – 5.5 K/km as for the rate marked 2 in
the diagram, then there is some small amount of vertical turbulence and the
atmosphere is said to be stable. It is also referred to as being sub-adiabatic.
 If the environmental lapse rate lies between the wet adiabatic lapse rate and the dry
adiabatic lapse rate as for the rate marked 3 in the diagram, then the atmosphere is
said to be neutral.
 If the environmental lapse rate is less than the dry adiabatic lapse rate as for the line
marked 4 in the diagram, then there turbulence in the atmosphere and it is said to be
unstable. It is also referred to as being super-adiabatic.
 If the environmental lapse rate were zero (perfectly vertical), then the atmosphere
would be in an isothermal condition (no change of temperature with altitude) and
would be also be said to be very stable.
Importance of understanding atmospheric
stability
 An understanding and knowledge of atmospheric stability is important for many
reasons. What follows is a brief discussion of some of those reasons:
 Probably one of the most important reasons is that atmospheric turbulence and
mixing plays a major role in air pollution dispersion modeling. Turbulence and
mixing is provided by an unstable atmosphere and thus enhances the dispersion of
air pollutant, while a stable atmosphere inhibits turbulence and results in very poor
dispersion of air pollutants.
 A stable atmosphere inhibits rain fall, while an unstable atmosphere encourages
rainfall and thunderstorms.
 A stable atmosphere also inhibits forest fire activity and an understanding of
atmospheric stability helps explain certain aspects of forest fire behavior.
 A certain amount of atmospheric instability is important for glider pilots, since
without it the thermals needed for glider flight would not form. Understanding of
atmospheric stability is also important for the safety of glider pilots because high
atmospheric instability may lead to thunderstorms.
 The atmospheric stability has a large impact on the deposition and drift of aerially
applied sprays of various farm crop protection materials.
Green house gas effect
• A greenhouse gas (sometimes abbreviated GHG) is
a gas that absorbs and emits radiant energy within the
thermal infrared range.
• Greenhouse gases cause the greenhouse effect on planets.
The primary greenhouse gases in Earth's atmosphere are
1. carbon dioxide,
2. methane,
3. nitrous oxide,
4. hydrofluorocarbons,
5. perfluorocarbons and
6. sulphur hexafluoride
Albedo
 Albedo is the fraction of solar energy
(shortwave radiation) reflected from
the Earth back into space. It is a
measure of the reflectivity of the earth's
surface.
 Ice, especially with snow on top of it,
has a high albedo: Most sunlight hitting
the surface bounces back towards
space. Water is much more absorbent
and less reflective. So, if there is a lot
of water, more solar radiation is
absorbed by the ocean than when ice
dominates.
 Albedo is not important at high
latitudes in winter: There is hardly any
incoming sunlight to worry about. It
becomes important in spring and
summer when the radiation entering
through can greatly increase the melt
rate of the sea ice.
Carbon emissions
 Carbon dioxide, though not the most potent of greenhouse gases, is
the most significant one. Human activity has caused an imbalance in
the natural cycle of the greenhouse effect and related processes
 Brown carbon:Industrial emissions of greenhouse gases that affect
the climate.
 Green carbon:Carbon stored in terrestrial ecosystems e.g. plant
biomass, soils, wetlands and pasture and increasingly recognized as
a key item for negotiation in the UNFCCC.
 Blue carbon:Carbon bound in the world’s oceans. An estimated 55%
of all carbon in living organisms is stored in mangroves, marshes,
sea grasses, coral reefs and macro-algae.
 Black carbon:Formed through incomplete combustion of fuels and
may be significantly reduced if clean burning technologies are
employed.
Photochemical smog
• Photochemical smog is a mixture of pollutants
that are formed when nitrogen oxides and
volatile organic compounds (VOCs) react to
sunlight, creating a brown haze above cities. It
tends to occur more often in summer, because
that is when we have the most sunlight.
Ozone
 Ozone (O3) is a pale blue distinctively pungent smelling gas found in the
atmosphere consisting of three oxygen atoms.
 Ozone is formed in the atmosphere when energetic ultraviolet (UV) radiation
dissociates molecules of oxygen (O2) into separate oxygen atoms.
 Free oxygen atoms can recombine to form oxygen molecules but if a free oxygen
atom collides with an oxygen molecule, it joins up forming ozone.
 Ozone molecules can also be decomposed by ultraviolet radiation into a free atom
and an oxygen molecule.
 Ozone is thus continuously created and destroyed in the atmosphere by UV
radiation coming from the sun. This highly energetic UV radiation is called UVC
(wavelength 280 nm) and is very harmful for human health. UVC is fully absorbed
in the atmosphere by oxygen and ozone molecules. Ozone also absorbs UVB
radiation, which is less energetic (wavelength 280 - 325 nm) but also harmful,
before it reaches the surface of the Earth.
 In this creation/destruction process the amounts of ozone molecules created and
destroyed are roughly equal, so that the total amount of ozone in the atmosphere is
nearly constant. The absolute concentration of ozone in the atmosphere is very low.
Out of 10 million air molecules only 3 are ozone molecules.
Ozone layer
 Discovery (1913)  French physicists Charles Fabry and Henri
Buisson.
 Dobson  Developed simple spectrophotometer to measure
stratospheric ozone from the ground. Established worldwide
network of ozone monitoring stations (1928-58) that continue
operation till today.
 Dobson unit  Measure of the amount of ozone overhead.
 United Nations General Assembly  Designated September 16
as the International Day for the Preservation of the Ozone
Layer.
Absorption of UV rays by ozone
layer
Ozone formation
What is Ozone Depletion?
Ozone layer depletion, is simply the wearing
out (reduction) of the amount of ozone in the
stratosphere.
Ozone depletion occurs when destruction of
the stratospheric ozone is more than the
production of the molecule.
Cause of ozone depletion
• Natural causes of depletion of ozone layer:
• Sun-spots and stratospheric winds. major volcanic
eruptions
• Man-made causes of depletion of ozone layer:
excessive release of chlorine and bromine from man-
made compounds such as
CFCs (chlorofluorocarbons),
halons, CH3CCl3 (Methyl chloroform),
CCl4(Carbon tetrachloride),
HCFCs (hydro-chlorofluorocarbons),
hydrobromofluorocarbons and
methyl bromide are found to have direct impact on the
depletion of the ozone layer. These are categorized as
ozone-depleting substances (ODS).
Ozone depletion by CFCs
Ozone hole
 The ozone hole is defined as the area having less than
220 dobson units (DU) of ozone in the overhead
column (i.e., between the ground and space).
 Since the 1970’s the ozone hole has been increasing in
size over the Antarctic.
 For the first time, in September of 2000, the ozone hole
became so large it actually left populated areas of
southern Chile fully exposed to the effects of the Sun’s
UV rays.
Ozone hole over the poles
El nino and La nina
El Niño and La Niña events are a natural part
of the global climate system. They occur when
the Pacific Ocean and the atmosphere above it
change from their neutral ('normal') state for
several seasons.
El Niño events are associated with a warming
of the central and eastern tropical Pacific,
while La Niña events are the reverse, with a
sustained cooling of these same areas.
• During an El Niño year, the east–west SST
difference weakens, the air pressure
difference weakens, and the trade winds and
their effects on the ocean weaken, so the
eastern Pacific warms (Figure 1(b)).
• During a La Niña year, the opposite happens:
the east–west difference in temperature
strengthens, the pressure difference
strengthens, and the trade winds and their
effects on the ocean strengthen, so the east
Pacific cools further (Figure 1(c)).
Unit 1 (2) (1).pptx

More Related Content

Similar to Unit 1 (2) (1).pptx

Weather and climate 7C
Weather and climate 7CWeather and climate 7C
Weather and climate 7Cchives
 
humidity.pptx
humidity.pptxhumidity.pptx
humidity.pptxShreyasJR
 
Composition of the atmosphere.pptx
Composition of the atmosphere.pptxComposition of the atmosphere.pptx
Composition of the atmosphere.pptxPhilip67
 
Hydrology presentation on rainfall
Hydrology presentation on rainfallHydrology presentation on rainfall
Hydrology presentation on rainfallanimesh91
 
THE ATMOSPHERE. WEATHER AND CLIMATE
THE ATMOSPHERE. WEATHER AND CLIMATETHE ATMOSPHERE. WEATHER AND CLIMATE
THE ATMOSPHERE. WEATHER AND CLIMATEMencar Car
 
Weather And Climate
Weather And ClimateWeather And Climate
Weather And ClimateMrs. Henley
 
Temperature radiation climatology-Climatology Chapter
Temperature radiation climatology-Climatology ChapterTemperature radiation climatology-Climatology Chapter
Temperature radiation climatology-Climatology ChapterKaium Chowdhury
 
Presentation1 module 2
Presentation1 module 2Presentation1 module 2
Presentation1 module 2alsats
 
Chapter 16 & 17-weather and climate
Chapter 16 & 17-weather and climateChapter 16 & 17-weather and climate
Chapter 16 & 17-weather and climateSteven_iannuccilli
 
Unit3 climateandlivingbeings-ppt-110306065855-phpapp02
Unit3 climateandlivingbeings-ppt-110306065855-phpapp02Unit3 climateandlivingbeings-ppt-110306065855-phpapp02
Unit3 climateandlivingbeings-ppt-110306065855-phpapp02deewoodard
 
Global-Circulation-of-the-Atmosphere.pptx
Global-Circulation-of-the-Atmosphere.pptxGlobal-Circulation-of-the-Atmosphere.pptx
Global-Circulation-of-the-Atmosphere.pptxSGGhosh2
 

Similar to Unit 1 (2) (1).pptx (20)

Weather and climate 7C
Weather and climate 7CWeather and climate 7C
Weather and climate 7C
 
Air 1_AA.pptx
Air 1_AA.pptxAir 1_AA.pptx
Air 1_AA.pptx
 
humidity.pptx
humidity.pptxhumidity.pptx
humidity.pptx
 
Chapt15 lecture
Chapt15 lectureChapt15 lecture
Chapt15 lecture
 
Climate
ClimateClimate
Climate
 
Composition of the atmosphere.pptx
Composition of the atmosphere.pptxComposition of the atmosphere.pptx
Composition of the atmosphere.pptx
 
Hydrology presentation on rainfall
Hydrology presentation on rainfallHydrology presentation on rainfall
Hydrology presentation on rainfall
 
THE ATMOSPHERE. WEATHER AND CLIMATE
THE ATMOSPHERE. WEATHER AND CLIMATETHE ATMOSPHERE. WEATHER AND CLIMATE
THE ATMOSPHERE. WEATHER AND CLIMATE
 
Weather And Climate
Weather And ClimateWeather And Climate
Weather And Climate
 
Temperature radiation climatology-Climatology Chapter
Temperature radiation climatology-Climatology ChapterTemperature radiation climatology-Climatology Chapter
Temperature radiation climatology-Climatology Chapter
 
Presentation1 module 2
Presentation1 module 2Presentation1 module 2
Presentation1 module 2
 
Chapter 16 & 17-weather and climate
Chapter 16 & 17-weather and climateChapter 16 & 17-weather and climate
Chapter 16 & 17-weather and climate
 
Cloud Development & Classification
Cloud Development & ClassificationCloud Development & Classification
Cloud Development & Classification
 
Unit3 climateandlivingbeings-ppt-110306065855-phpapp02
Unit3 climateandlivingbeings-ppt-110306065855-phpapp02Unit3 climateandlivingbeings-ppt-110306065855-phpapp02
Unit3 climateandlivingbeings-ppt-110306065855-phpapp02
 
Cloud Development
Cloud DevelopmentCloud Development
Cloud Development
 
Global-Circulation-of-the-Atmosphere.pptx
Global-Circulation-of-the-Atmosphere.pptxGlobal-Circulation-of-the-Atmosphere.pptx
Global-Circulation-of-the-Atmosphere.pptx
 
6th Grade Chapter 18 Part 2
6th Grade Chapter 18 Part 26th Grade Chapter 18 Part 2
6th Grade Chapter 18 Part 2
 
Chapter atmosphere
Chapter atmosphereChapter atmosphere
Chapter atmosphere
 
Unit 5
Unit 5Unit 5
Unit 5
 
The Weather
The WeatherThe Weather
The Weather
 

More from RishuRaj953240

More from RishuRaj953240 (11)

milankovitch cycle.pptx
milankovitch cycle.pptxmilankovitch cycle.pptx
milankovitch cycle.pptx
 
Unit I_dany (1).pptx
Unit I_dany (1).pptxUnit I_dany (1).pptx
Unit I_dany (1).pptx
 
UNIT 1.pdf
UNIT 1.pdfUNIT 1.pdf
UNIT 1.pdf
 
UNIT 1 SRMIST KTR_problem and agents.pdf
UNIT 1 SRMIST KTR_problem and agents.pdfUNIT 1 SRMIST KTR_problem and agents.pdf
UNIT 1 SRMIST KTR_problem and agents.pdf
 
ADE ALL UNITS.pdf
ADE ALL UNITS.pdfADE ALL UNITS.pdf
ADE ALL UNITS.pdf
 
Unit 3.pdf
Unit 3.pdfUnit 3.pdf
Unit 3.pdf
 
Important question.pdf
Important question.pdfImportant question.pdf
Important question.pdf
 
graph-theory-Slides.pdf
graph-theory-Slides.pdfgraph-theory-Slides.pdf
graph-theory-Slides.pdf
 
PNP.pptx
PNP.pptxPNP.pptx
PNP.pptx
 
BOD&COD.pdf
BOD&COD.pdfBOD&COD.pdf
BOD&COD.pdf
 
Object Oriented programming Using Python.pdf
Object Oriented programming Using Python.pdfObject Oriented programming Using Python.pdf
Object Oriented programming Using Python.pdf
 

Recently uploaded

Oxy acetylene welding presentation note.
Oxy acetylene welding presentation note.Oxy acetylene welding presentation note.
Oxy acetylene welding presentation note.eptoze12
 
Heart Disease Prediction using machine learning.pptx
Heart Disease Prediction using machine learning.pptxHeart Disease Prediction using machine learning.pptx
Heart Disease Prediction using machine learning.pptxPoojaBan
 
HARMONY IN THE NATURE AND EXISTENCE - Unit-IV
HARMONY IN THE NATURE AND EXISTENCE - Unit-IVHARMONY IN THE NATURE AND EXISTENCE - Unit-IV
HARMONY IN THE NATURE AND EXISTENCE - Unit-IVRajaP95
 
Arduino_CSE ece ppt for working and principal of arduino.ppt
Arduino_CSE ece ppt for working and principal of arduino.pptArduino_CSE ece ppt for working and principal of arduino.ppt
Arduino_CSE ece ppt for working and principal of arduino.pptSAURABHKUMAR892774
 
Effects of rheological properties on mixing
Effects of rheological properties on mixingEffects of rheological properties on mixing
Effects of rheological properties on mixingviprabot1
 
IVE Industry Focused Event - Defence Sector 2024
IVE Industry Focused Event - Defence Sector 2024IVE Industry Focused Event - Defence Sector 2024
IVE Industry Focused Event - Defence Sector 2024Mark Billinghurst
 
Biology for Computer Engineers Course Handout.pptx
Biology for Computer Engineers Course Handout.pptxBiology for Computer Engineers Course Handout.pptx
Biology for Computer Engineers Course Handout.pptxDeepakSakkari2
 
Decoding Kotlin - Your guide to solving the mysterious in Kotlin.pptx
Decoding Kotlin - Your guide to solving the mysterious in Kotlin.pptxDecoding Kotlin - Your guide to solving the mysterious in Kotlin.pptx
Decoding Kotlin - Your guide to solving the mysterious in Kotlin.pptxJoão Esperancinha
 
CCS355 Neural Network & Deep Learning Unit II Notes with Question bank .pdf
CCS355 Neural Network & Deep Learning Unit II Notes with Question bank .pdfCCS355 Neural Network & Deep Learning Unit II Notes with Question bank .pdf
CCS355 Neural Network & Deep Learning Unit II Notes with Question bank .pdfAsst.prof M.Gokilavani
 
complete construction, environmental and economics information of biomass com...
complete construction, environmental and economics information of biomass com...complete construction, environmental and economics information of biomass com...
complete construction, environmental and economics information of biomass com...asadnawaz62
 
EduAI - E learning Platform integrated with AI
EduAI - E learning Platform integrated with AIEduAI - E learning Platform integrated with AI
EduAI - E learning Platform integrated with AIkoyaldeepu123
 
Introduction-To-Agricultural-Surveillance-Rover.pptx
Introduction-To-Agricultural-Surveillance-Rover.pptxIntroduction-To-Agricultural-Surveillance-Rover.pptx
Introduction-To-Agricultural-Surveillance-Rover.pptxk795866
 
Work Experience-Dalton Park.pptxfvvvvvvv
Work Experience-Dalton Park.pptxfvvvvvvvWork Experience-Dalton Park.pptxfvvvvvvv
Work Experience-Dalton Park.pptxfvvvvvvvLewisJB
 
Call Girls Delhi {Jodhpur} 9711199012 high profile service
Call Girls Delhi {Jodhpur} 9711199012 high profile serviceCall Girls Delhi {Jodhpur} 9711199012 high profile service
Call Girls Delhi {Jodhpur} 9711199012 high profile servicerehmti665
 
Study on Air-Water & Water-Water Heat Exchange in a Finned Tube Exchanger
Study on Air-Water & Water-Water Heat Exchange in a Finned Tube ExchangerStudy on Air-Water & Water-Water Heat Exchange in a Finned Tube Exchanger
Study on Air-Water & Water-Water Heat Exchange in a Finned Tube ExchangerAnamika Sarkar
 
Application of Residue Theorem to evaluate real integrations.pptx
Application of Residue Theorem to evaluate real integrations.pptxApplication of Residue Theorem to evaluate real integrations.pptx
Application of Residue Theorem to evaluate real integrations.pptx959SahilShah
 
Concrete Mix Design - IS 10262-2019 - .pptx
Concrete Mix Design - IS 10262-2019 - .pptxConcrete Mix Design - IS 10262-2019 - .pptx
Concrete Mix Design - IS 10262-2019 - .pptxKartikeyaDwivedi3
 
Gurgaon ✡️9711147426✨Call In girls Gurgaon Sector 51 escort service
Gurgaon ✡️9711147426✨Call In girls Gurgaon Sector 51 escort serviceGurgaon ✡️9711147426✨Call In girls Gurgaon Sector 51 escort service
Gurgaon ✡️9711147426✨Call In girls Gurgaon Sector 51 escort servicejennyeacort
 

Recently uploaded (20)

Oxy acetylene welding presentation note.
Oxy acetylene welding presentation note.Oxy acetylene welding presentation note.
Oxy acetylene welding presentation note.
 
Heart Disease Prediction using machine learning.pptx
Heart Disease Prediction using machine learning.pptxHeart Disease Prediction using machine learning.pptx
Heart Disease Prediction using machine learning.pptx
 
HARMONY IN THE NATURE AND EXISTENCE - Unit-IV
HARMONY IN THE NATURE AND EXISTENCE - Unit-IVHARMONY IN THE NATURE AND EXISTENCE - Unit-IV
HARMONY IN THE NATURE AND EXISTENCE - Unit-IV
 
Arduino_CSE ece ppt for working and principal of arduino.ppt
Arduino_CSE ece ppt for working and principal of arduino.pptArduino_CSE ece ppt for working and principal of arduino.ppt
Arduino_CSE ece ppt for working and principal of arduino.ppt
 
Effects of rheological properties on mixing
Effects of rheological properties on mixingEffects of rheological properties on mixing
Effects of rheological properties on mixing
 
IVE Industry Focused Event - Defence Sector 2024
IVE Industry Focused Event - Defence Sector 2024IVE Industry Focused Event - Defence Sector 2024
IVE Industry Focused Event - Defence Sector 2024
 
Biology for Computer Engineers Course Handout.pptx
Biology for Computer Engineers Course Handout.pptxBiology for Computer Engineers Course Handout.pptx
Biology for Computer Engineers Course Handout.pptx
 
Decoding Kotlin - Your guide to solving the mysterious in Kotlin.pptx
Decoding Kotlin - Your guide to solving the mysterious in Kotlin.pptxDecoding Kotlin - Your guide to solving the mysterious in Kotlin.pptx
Decoding Kotlin - Your guide to solving the mysterious in Kotlin.pptx
 
CCS355 Neural Network & Deep Learning Unit II Notes with Question bank .pdf
CCS355 Neural Network & Deep Learning Unit II Notes with Question bank .pdfCCS355 Neural Network & Deep Learning Unit II Notes with Question bank .pdf
CCS355 Neural Network & Deep Learning Unit II Notes with Question bank .pdf
 
complete construction, environmental and economics information of biomass com...
complete construction, environmental and economics information of biomass com...complete construction, environmental and economics information of biomass com...
complete construction, environmental and economics information of biomass com...
 
Design and analysis of solar grass cutter.pdf
Design and analysis of solar grass cutter.pdfDesign and analysis of solar grass cutter.pdf
Design and analysis of solar grass cutter.pdf
 
EduAI - E learning Platform integrated with AI
EduAI - E learning Platform integrated with AIEduAI - E learning Platform integrated with AI
EduAI - E learning Platform integrated with AI
 
Introduction-To-Agricultural-Surveillance-Rover.pptx
Introduction-To-Agricultural-Surveillance-Rover.pptxIntroduction-To-Agricultural-Surveillance-Rover.pptx
Introduction-To-Agricultural-Surveillance-Rover.pptx
 
Work Experience-Dalton Park.pptxfvvvvvvv
Work Experience-Dalton Park.pptxfvvvvvvvWork Experience-Dalton Park.pptxfvvvvvvv
Work Experience-Dalton Park.pptxfvvvvvvv
 
Call Girls Delhi {Jodhpur} 9711199012 high profile service
Call Girls Delhi {Jodhpur} 9711199012 high profile serviceCall Girls Delhi {Jodhpur} 9711199012 high profile service
Call Girls Delhi {Jodhpur} 9711199012 high profile service
 
Study on Air-Water & Water-Water Heat Exchange in a Finned Tube Exchanger
Study on Air-Water & Water-Water Heat Exchange in a Finned Tube ExchangerStudy on Air-Water & Water-Water Heat Exchange in a Finned Tube Exchanger
Study on Air-Water & Water-Water Heat Exchange in a Finned Tube Exchanger
 
🔝9953056974🔝!!-YOUNG call girls in Rajendra Nagar Escort rvice Shot 2000 nigh...
🔝9953056974🔝!!-YOUNG call girls in Rajendra Nagar Escort rvice Shot 2000 nigh...🔝9953056974🔝!!-YOUNG call girls in Rajendra Nagar Escort rvice Shot 2000 nigh...
🔝9953056974🔝!!-YOUNG call girls in Rajendra Nagar Escort rvice Shot 2000 nigh...
 
Application of Residue Theorem to evaluate real integrations.pptx
Application of Residue Theorem to evaluate real integrations.pptxApplication of Residue Theorem to evaluate real integrations.pptx
Application of Residue Theorem to evaluate real integrations.pptx
 
Concrete Mix Design - IS 10262-2019 - .pptx
Concrete Mix Design - IS 10262-2019 - .pptxConcrete Mix Design - IS 10262-2019 - .pptx
Concrete Mix Design - IS 10262-2019 - .pptx
 
Gurgaon ✡️9711147426✨Call In girls Gurgaon Sector 51 escort service
Gurgaon ✡️9711147426✨Call In girls Gurgaon Sector 51 escort serviceGurgaon ✡️9711147426✨Call In girls Gurgaon Sector 51 escort service
Gurgaon ✡️9711147426✨Call In girls Gurgaon Sector 51 escort service
 

Unit 1 (2) (1).pptx

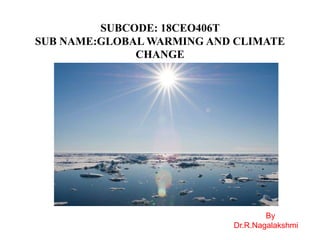
  • 2. UNIT I - EARTH’S CLIMATE SYSTEM Earth's climate arises from the interaction of five major climate system components: 1. Atmosphere (air), 2. Hydrosphere (water), 3. Cryosphere (ice and permafrost), 4. Lithosphere (earth's upper rocky layer) and 5. Biosphere (living things)
  • 3.
  • 4. ATMOSPHERE:stratospheric ozone layer,oxygen, greenhouse gases, aerosols, water vapour, clouds, black carbon, tropospheric ozone. OCEANS: moderate climate, absorb heat and CO2, phytoplankton start the ocean carbon sink. CRYOSPHERE:ice and snow- reflect solar heat, frozen soil permafrost is a large carbon store, frozen ocean floor methane hydrates another huge carbon store. FORESTS: huge carbon store, net CO2 emissions when cleared. SOILS: store and emit CO2 esp. peat lands MOUNTAINS: 'permanent' carbon store as limestone and dolomite that are formed under the ocean depths, long term weathering carbon source. VOLCANOES: emit short term cooling aerosols and long term warming CO2
  • 5.
  • 6.
  • 8.
  • 9.
  • 11. • Weather is the day-to-day state of the atmosphere, and its short-term variation in minutes to weeks. People generally think of weather as the combination of temperature, humidity, precipitation, cloudiness, visibility, and wind WEATHER
  • 12. • The climate of a place may be defined as a "composite" of the long-term prevailing weather that occurs at that location. • Climate is the weather of a place averaged over a period of time, often 30 years • In a sense, climate is "average weather". • Climate can be measured quantitatively by calculating the long term averages of different climate elements such as temperature and rainfall. .. CLIMATE
  • 14. Atmospheric Pressure • Atmospheric pressure is the force per unit area exerted on a surface by the weight of air above that surface in the atmosphere of earth (or that another planet). • In most circumstances atmospheric pressure is closely approximated by the hydrostatic pressure caused by the weight of air above the measurement point. • On a given plane, low-pressure areas have less atmospheric mass above their location, whereas high-pressure areas have more atmospheric mass above their location. Likewise, as elevation increases, there is less overlying atmospheric mass, so that atmospheric pressure decreases with increasing elevation.
  • 15.
  • 16. Atmospheric Composition affects Air Temperature Air temperature also changes as altitude increases. The temperature differences result mainly from the way solar energy is absorbed as it moves through the atmosphere. Some parts of the atmosphere are warmer because they contain a high percentage of gases that absorb solar energy. Other parts of the atmosphere contain less of these gases and are cooler.
  • 17. Heat and Temperature Temperature: Average energy of molecules or atoms in a material. Heat: Total energy of molecules or atoms in a material. It’s possible to have large amount of heat but low temperatures and high temperatures but little heat.
  • 18. Heat and Temperature  The Arctic Ocean has a large amount of heat (because of large mass) even though the temperature is low.  Air in an oven at 500⁰F has high temperature but little heat.  However if you touch anything solid in the oven you’ll get burned. Same temperature but much larger amount of heat.  The earth’s outermost atmosphere is extremely “hot” but its heat content is negligible.  It takes time for things to warm up and cool off.
  • 19. Temperature Scales 1) Fahrenheit a) Water Freezes at 32 F b) Water Boils at 212 F 2) Centigrade or Celsius a) Water Freezes at 0 C b) Water Boils at 100 C 3) Two scales exactly equal at -40
  • 20. Absolute Temperature Once atoms stop moving  that’s as cold as it can get. Absolute Zero  -273⁰C / -459⁰F. Kelvin scale uses Celsius degrees and starts at absolute zero. Most formulas involving temperature use the Kelvin Scale.
  • 21. Atmospheric humidity • Atmospheric humidity is the amount of water vapour carried in the air. It can be measured as vapour pressure, mixing ratio or specific humidity. ... Atmospheric water vapour is also the most important greenhouse gas in the atmosphere.
  • 22.
  • 23. Types of Humidity • (i) Relative humidity, • (ii) Specific humidity, • (iii) Mixing ratio, and • (iv) Absolute humidity.
  • 24. • It is the ratio of mass of water vapours actually present in the air to a unit mass of air including the water vapour (dry air + moisture). It is expressed as grams of water vapour per kg of moist air mass. The amount of water vapour that air can hold depends upon temperature. Specific humidity at 20°C is 15g per kg. At 30°C, it is 26 g per kg and at -10°C, it is 2 g per kg. • Suppose, 1kg of air contains 12 grams of water vapours, then the specific humidity of air is 12 g per kg. Specific Humidity:
  • 25. • Relative humidity may also be defined as the ratio of actual vapour pressure to that required for saturation at the same temperature.
  • 26. • Mixing Ratio: • It is defined as the ratio of mass of water vapours per unit mass of dry air. It is also defined as the ratio of density of water vapours to the density of dry air. It varies from 1 g per kg in arctic zone to 40 g per kg in humid equatorial zone.
  • 27. Absolute Humidity: • It is defined as the weight of water vapours in a given volume of air. It is expressed as grams of water vapours per cubic meter of air (g m-3). Absolute humidity is rarely used because it varies with the expansion and contraction of air. It varies with temperature, even though the amount of water vapours remains constant.
  • 28. Rainfall • Rainfall is a form of Precipitation. The term "rainfall" is used to describe precipitation in the form of water drops of sizes larger than 0.5 mm. Other forms are snow, drizzle, glaze, sleet and hail. ... Sleet is frozen raindrops of transparent grains which form when rain falls through air at subfreezing temperature.
  • 29. Types of Rainfall Convectional Rainfall • Suppose we are enjoying the rays of sunshine and suddenly, the sky gets darker with the grey cloud. Without any warning the heavens open and it begins to rain, with a thundery feel. This is the convectional rain. It occurs frequently on hot days usually giving cumulus cloud and thundery showers. • The sun heats the ground which causes the air to warm and become very hot. Then the air rises upwards and becomes cool. Then it condenses to form cumulus cloud. • When this cloud is saturated, it begins to precipitate giving heavy and thundery showers. Due to this, we get thundershowers on a hot day, as the Sun warms the air and it rises, cools and begins to rain. Frontal Rainfall • This rainfall occurs when a warm, tropical air mass comes in contact with a cold, polar air mass. It is very common in Britain and Ireland. Because the air is in the warm front, then it rises over the cold front. The air is cooled and so condenses to form a stratus cloud. Thus when the stratus cloud becomes saturated, it begins to precipitate.
  • 30. Relief Rainfall • This type of rainfall is common in places with mountains and sea. Relief rainfall frequently occurs near mountains beside the sea. The moisture-laden wind blows in from the sea because the wind meets a high mountain and hence it is forced to rise upwards. At the height, it is cooled and then the cloud is formed. • This saturated cloud with water vapor begins to precipitate on the side of the mountain facing the sea. This front side of the mountain is called the windward side. • The cloud mostly precipitates on the windward side of the mountain. Meanwhile, the cloud meets the other side, which is called the leeward side. Since the cloud has already lost most of its moisture so it rains very little there. • This makes leeward sides of a mountain very little rains. There is a much more moist climate on the windward sides of slopes. On the other hand, there is a more dry, sheltered climate on the leeward side. This rainfall is common in Hawaii, Sierra Nevada, and the Andes.
  • 31. Air movement Air moves from areas of high atmospheric pressure to areas of low atmospheric pressure Low pressure areas - troughs High pressure areas - ridges
  • 32. Influences on air movement Pressure gradient force Coriolis effect Friction  Close to ground Friction between atmosphere and surface slows air down Winds are stronger at high elevations
  • 33. Solar radiation  Regions near the equator receive light at 90o  High latitudes receive light at low angles  Light energy is more concentrated near the equator. In other words, there is a greater flux per unit area (W/m2)
  • 34. Solar energy received is greatest near the equator. Energy is moved from the equator to the poles. Energy is transferred by wind and ocean currents
  • 35. Air near the equator is warmed, and rises Solar radiation
  • 36. Warm air rises Air cools, sinks Rising air is replaced Hadley Circulation Cell LOW HIGH HIGH
  • 37. Warm air rises Air cools, sinks Rising air is replaced LOW HIGH HIGH Rising air cools; the air’s capacity to hold water drops. Rain! No rain in regions where air is descending
  • 38.  Due to the rotation of the earth, wind and ocean currents are deflected to the right in the northern hemisphere and to the left in the southern hemisphere. This effect is known as the "Coriolis force."  The deflection leads to highs and lows of sea level directly proportional to the speed of the surface currents Coriolis force
  • 39. The Earth would have two large Hadley cells, if it did not rotate. Rotation of the Earth leads to the Coriolis Effect This causes winds (and all moving objects) to be deflected: To the right in the Northern Hemisphere To the left in the Southern Hemisphere
  • 40.
  • 42. Ocean circulation is the large scale movement of waters in the ocean basins. There are two main types of ocean currents: currents driven mainly by wind and currents mainly driven by density differences. Density depends on temperature and salinity of the water. 1. Horizontal circulation 1. Surface currents 2. Deep currents (Cold and salty water is dense and will sink. Warm and less salty water will float) 1. Vertical circulation 1. Upwelling 2. Downwelling Global ocean circulation
  • 43. Horizontal currents: Winds drive surface circulation, and the cooling and sinking of waters in the polar regions drive deep circulation.  Surface circulation carries the warm upper waters poleward from the tropics.  Heat is disbursed along the way from the waters to the atmosphere. At the poles, the water is further cooled during winter, and sinks to the deep ocean. This is especially true in the North Atlantic and along Antarctica.  Deep ocean water gradually returns to the surface nearly everywhere in the ocean. Once at the surface it is carried back to the tropics, and the cycle begins again. The more efficient the cycle, the more heat is transferred, and the warmer the climate.
  • 44.
  • 45.  Winds blowing across the ocean surface push water away. Water then rises up from beneath the surface to replace the water that was pushed away. This process is known as “upwelling.”  Upwelling occurs in the open ocean and along coastlines. The reverse process, called “downwelling,”
  • 46.  ocean currents have a major impact on the global climate. They cause the relative mildness of the Western European climate, for example.  Ocean and atmospheric currents form a coupled dynamic system. Instabilities of this system, the El Nino Southern Oscillation (ENSO) in particular, produce important climate fluctuations.  Ocean currents not only distribute heat, but they also play a crucial role in the global ecosystem by storing CO2 and recycling nutrients. Importance of ocean circulation
  • 47. Atmospheric lapse rate  The atmospheric lapse rate refers to the change of an atmospheric variable with a change of altitude, the variable being temperature unless specified otherwise (such as pressure, density or humidity).  Lapse rates are usually expressed as the amount of temperature change associated with a specified amount of altitude change, such as 9.8 K per kilometre, 0.0098 K per metre or the equivalent 5.4 °F per 1000 feet.  If the atmospheric air cools with increasing altitude, the lapse rate may be expressed as a negative number. If the air heats with increasing altitude, the lapse rate may be expressed as a positive number.
  • 48. Lapse rates and atmospheric stability  Atmospheric stability is a term used to qualitatively describe the amount of vertical motion of the air in the lower atmosphere (the troposphere). In broad general terms, the atmospheric stability can be characterized by these four categories:  A very stable atmosphere is one that has very little vertical motion of the air.  A stable atmosphere is one that discourages vertical motion but does have some motion of the air.  An unstable atmosphere is one that encourages continual vertical motion of the air, upwards or downwards.  A neutral atmosphere is one that neither discourages nor encourages vertical motion of the air and is often referred to as conditionally stable.
  • 49.
  • 50.  The numerical value of the environmental lapse rate determines the stability category of the atmospheric air.  If the environmental lapse rate (i.e., the actual ambient temperature gradient) is greater than zero as for the rate marked 1 in the diagram, then an inversion layer is present and the atmospheric temperature increases with altitude. There is essentially no vertical turbulence and the atmosphere is said to be very stable or extremely stable.  If the environmental lapse rate is greater than – 5.5 K/km as for the rate marked 2 in the diagram, then there is some small amount of vertical turbulence and the atmosphere is said to be stable. It is also referred to as being sub-adiabatic.  If the environmental lapse rate lies between the wet adiabatic lapse rate and the dry adiabatic lapse rate as for the rate marked 3 in the diagram, then the atmosphere is said to be neutral.  If the environmental lapse rate is less than the dry adiabatic lapse rate as for the line marked 4 in the diagram, then there turbulence in the atmosphere and it is said to be unstable. It is also referred to as being super-adiabatic.  If the environmental lapse rate were zero (perfectly vertical), then the atmosphere would be in an isothermal condition (no change of temperature with altitude) and would be also be said to be very stable.
  • 51. Importance of understanding atmospheric stability  An understanding and knowledge of atmospheric stability is important for many reasons. What follows is a brief discussion of some of those reasons:  Probably one of the most important reasons is that atmospheric turbulence and mixing plays a major role in air pollution dispersion modeling. Turbulence and mixing is provided by an unstable atmosphere and thus enhances the dispersion of air pollutant, while a stable atmosphere inhibits turbulence and results in very poor dispersion of air pollutants.  A stable atmosphere inhibits rain fall, while an unstable atmosphere encourages rainfall and thunderstorms.  A stable atmosphere also inhibits forest fire activity and an understanding of atmospheric stability helps explain certain aspects of forest fire behavior.  A certain amount of atmospheric instability is important for glider pilots, since without it the thermals needed for glider flight would not form. Understanding of atmospheric stability is also important for the safety of glider pilots because high atmospheric instability may lead to thunderstorms.  The atmospheric stability has a large impact on the deposition and drift of aerially applied sprays of various farm crop protection materials.
  • 52. Green house gas effect • A greenhouse gas (sometimes abbreviated GHG) is a gas that absorbs and emits radiant energy within the thermal infrared range. • Greenhouse gases cause the greenhouse effect on planets. The primary greenhouse gases in Earth's atmosphere are 1. carbon dioxide, 2. methane, 3. nitrous oxide, 4. hydrofluorocarbons, 5. perfluorocarbons and 6. sulphur hexafluoride
  • 53.
  • 54. Albedo  Albedo is the fraction of solar energy (shortwave radiation) reflected from the Earth back into space. It is a measure of the reflectivity of the earth's surface.  Ice, especially with snow on top of it, has a high albedo: Most sunlight hitting the surface bounces back towards space. Water is much more absorbent and less reflective. So, if there is a lot of water, more solar radiation is absorbed by the ocean than when ice dominates.  Albedo is not important at high latitudes in winter: There is hardly any incoming sunlight to worry about. It becomes important in spring and summer when the radiation entering through can greatly increase the melt rate of the sea ice.
  • 55. Carbon emissions  Carbon dioxide, though not the most potent of greenhouse gases, is the most significant one. Human activity has caused an imbalance in the natural cycle of the greenhouse effect and related processes  Brown carbon:Industrial emissions of greenhouse gases that affect the climate.  Green carbon:Carbon stored in terrestrial ecosystems e.g. plant biomass, soils, wetlands and pasture and increasingly recognized as a key item for negotiation in the UNFCCC.  Blue carbon:Carbon bound in the world’s oceans. An estimated 55% of all carbon in living organisms is stored in mangroves, marshes, sea grasses, coral reefs and macro-algae.  Black carbon:Formed through incomplete combustion of fuels and may be significantly reduced if clean burning technologies are employed.
  • 56. Photochemical smog • Photochemical smog is a mixture of pollutants that are formed when nitrogen oxides and volatile organic compounds (VOCs) react to sunlight, creating a brown haze above cities. It tends to occur more often in summer, because that is when we have the most sunlight.
  • 57.
  • 58. Ozone  Ozone (O3) is a pale blue distinctively pungent smelling gas found in the atmosphere consisting of three oxygen atoms.  Ozone is formed in the atmosphere when energetic ultraviolet (UV) radiation dissociates molecules of oxygen (O2) into separate oxygen atoms.  Free oxygen atoms can recombine to form oxygen molecules but if a free oxygen atom collides with an oxygen molecule, it joins up forming ozone.  Ozone molecules can also be decomposed by ultraviolet radiation into a free atom and an oxygen molecule.  Ozone is thus continuously created and destroyed in the atmosphere by UV radiation coming from the sun. This highly energetic UV radiation is called UVC (wavelength 280 nm) and is very harmful for human health. UVC is fully absorbed in the atmosphere by oxygen and ozone molecules. Ozone also absorbs UVB radiation, which is less energetic (wavelength 280 - 325 nm) but also harmful, before it reaches the surface of the Earth.  In this creation/destruction process the amounts of ozone molecules created and destroyed are roughly equal, so that the total amount of ozone in the atmosphere is nearly constant. The absolute concentration of ozone in the atmosphere is very low. Out of 10 million air molecules only 3 are ozone molecules.
  • 59. Ozone layer  Discovery (1913)  French physicists Charles Fabry and Henri Buisson.  Dobson  Developed simple spectrophotometer to measure stratospheric ozone from the ground. Established worldwide network of ozone monitoring stations (1928-58) that continue operation till today.  Dobson unit  Measure of the amount of ozone overhead.  United Nations General Assembly  Designated September 16 as the International Day for the Preservation of the Ozone Layer.
  • 60. Absorption of UV rays by ozone layer
  • 62. What is Ozone Depletion? Ozone layer depletion, is simply the wearing out (reduction) of the amount of ozone in the stratosphere. Ozone depletion occurs when destruction of the stratospheric ozone is more than the production of the molecule.
  • 63. Cause of ozone depletion • Natural causes of depletion of ozone layer: • Sun-spots and stratospheric winds. major volcanic eruptions • Man-made causes of depletion of ozone layer: excessive release of chlorine and bromine from man- made compounds such as CFCs (chlorofluorocarbons), halons, CH3CCl3 (Methyl chloroform), CCl4(Carbon tetrachloride), HCFCs (hydro-chlorofluorocarbons), hydrobromofluorocarbons and methyl bromide are found to have direct impact on the depletion of the ozone layer. These are categorized as ozone-depleting substances (ODS).
  • 65. Ozone hole  The ozone hole is defined as the area having less than 220 dobson units (DU) of ozone in the overhead column (i.e., between the ground and space).  Since the 1970’s the ozone hole has been increasing in size over the Antarctic.  For the first time, in September of 2000, the ozone hole became so large it actually left populated areas of southern Chile fully exposed to the effects of the Sun’s UV rays.
  • 66.
  • 67. Ozone hole over the poles
  • 68. El nino and La nina El Niño and La Niña events are a natural part of the global climate system. They occur when the Pacific Ocean and the atmosphere above it change from their neutral ('normal') state for several seasons. El Niño events are associated with a warming of the central and eastern tropical Pacific, while La Niña events are the reverse, with a sustained cooling of these same areas.
  • 69.
  • 70. • During an El Niño year, the east–west SST difference weakens, the air pressure difference weakens, and the trade winds and their effects on the ocean weaken, so the eastern Pacific warms (Figure 1(b)). • During a La Niña year, the opposite happens: the east–west difference in temperature strengthens, the pressure difference strengthens, and the trade winds and their effects on the ocean strengthen, so the east Pacific cools further (Figure 1(c)).