As An
administra
tor
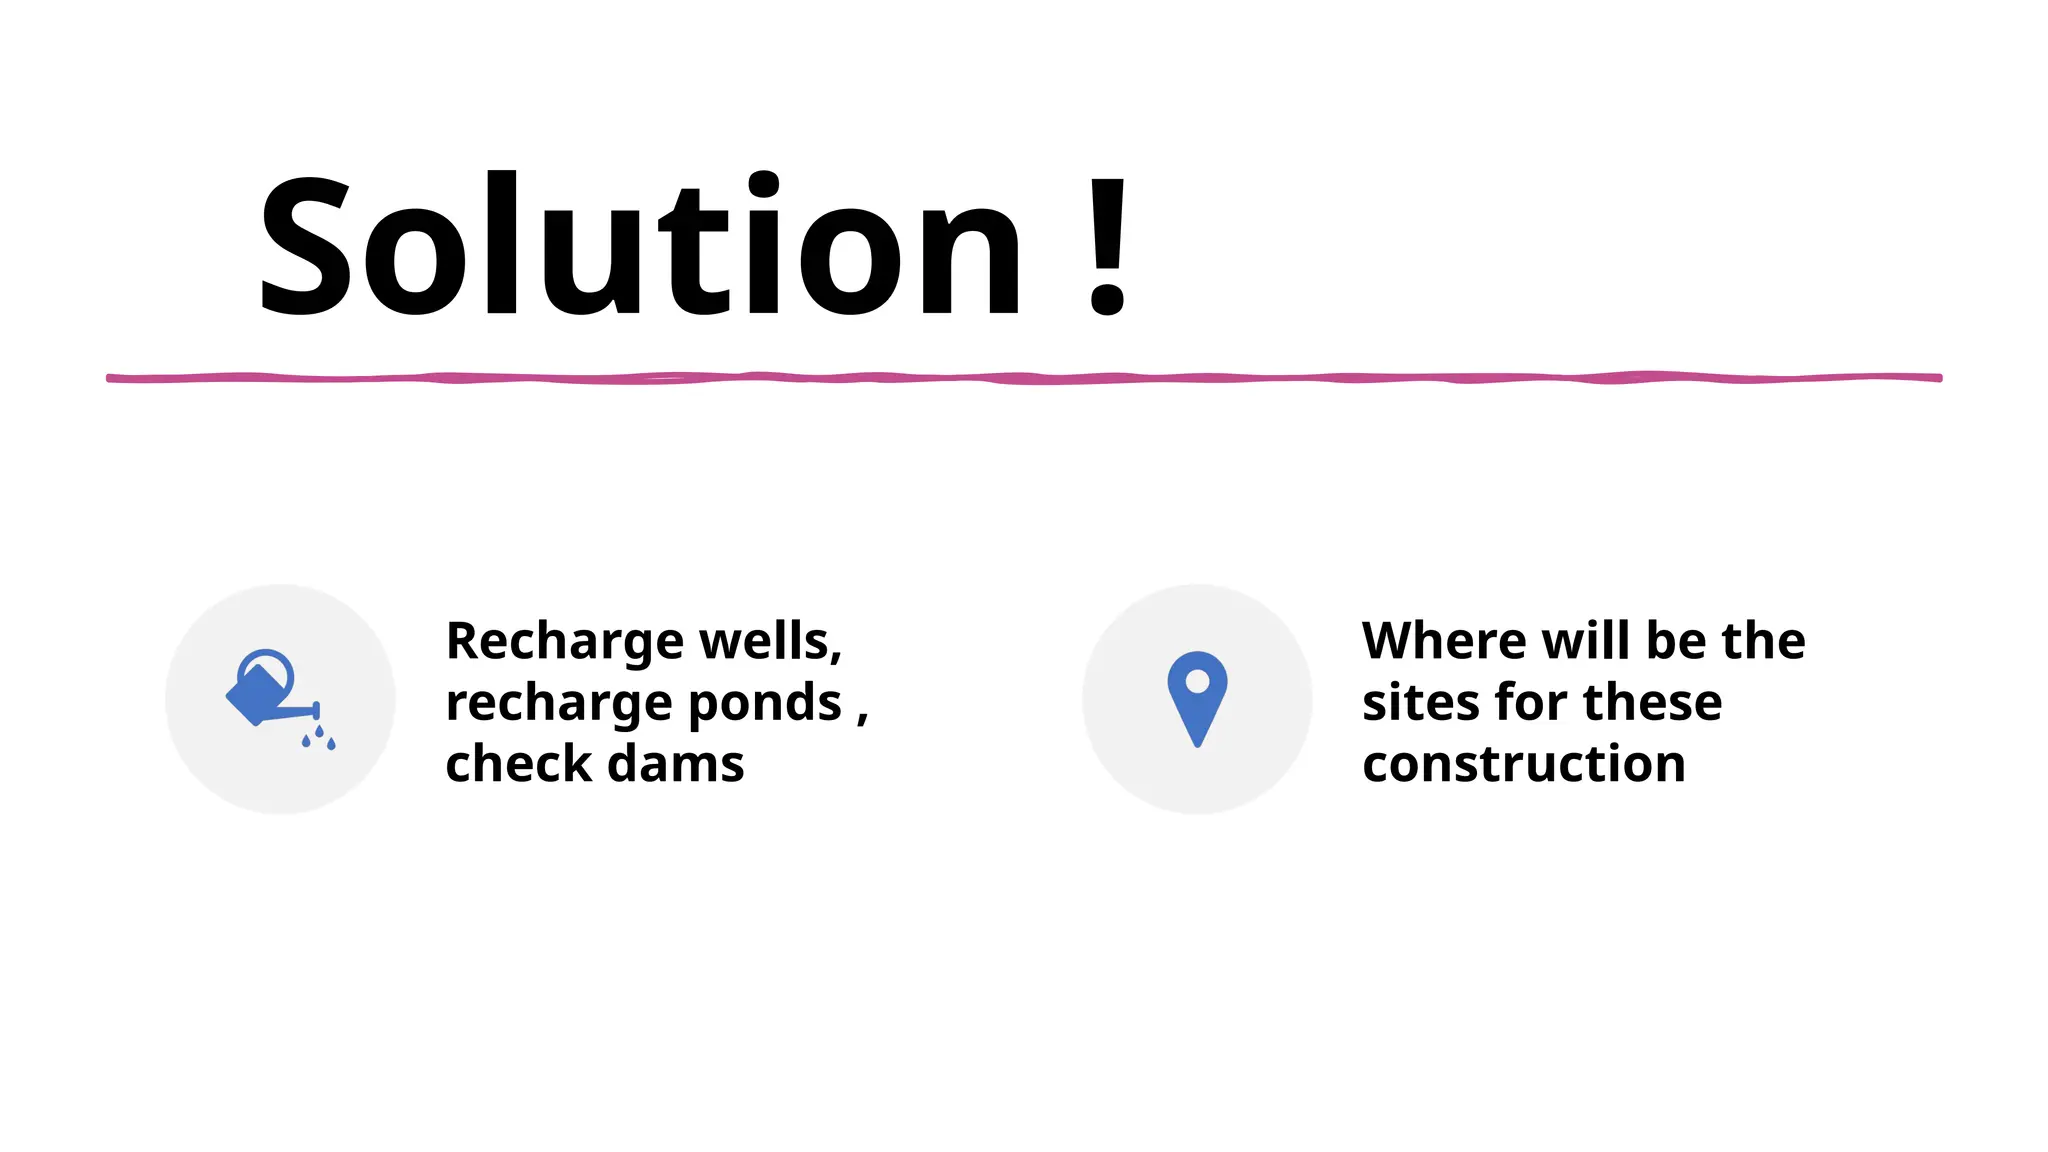
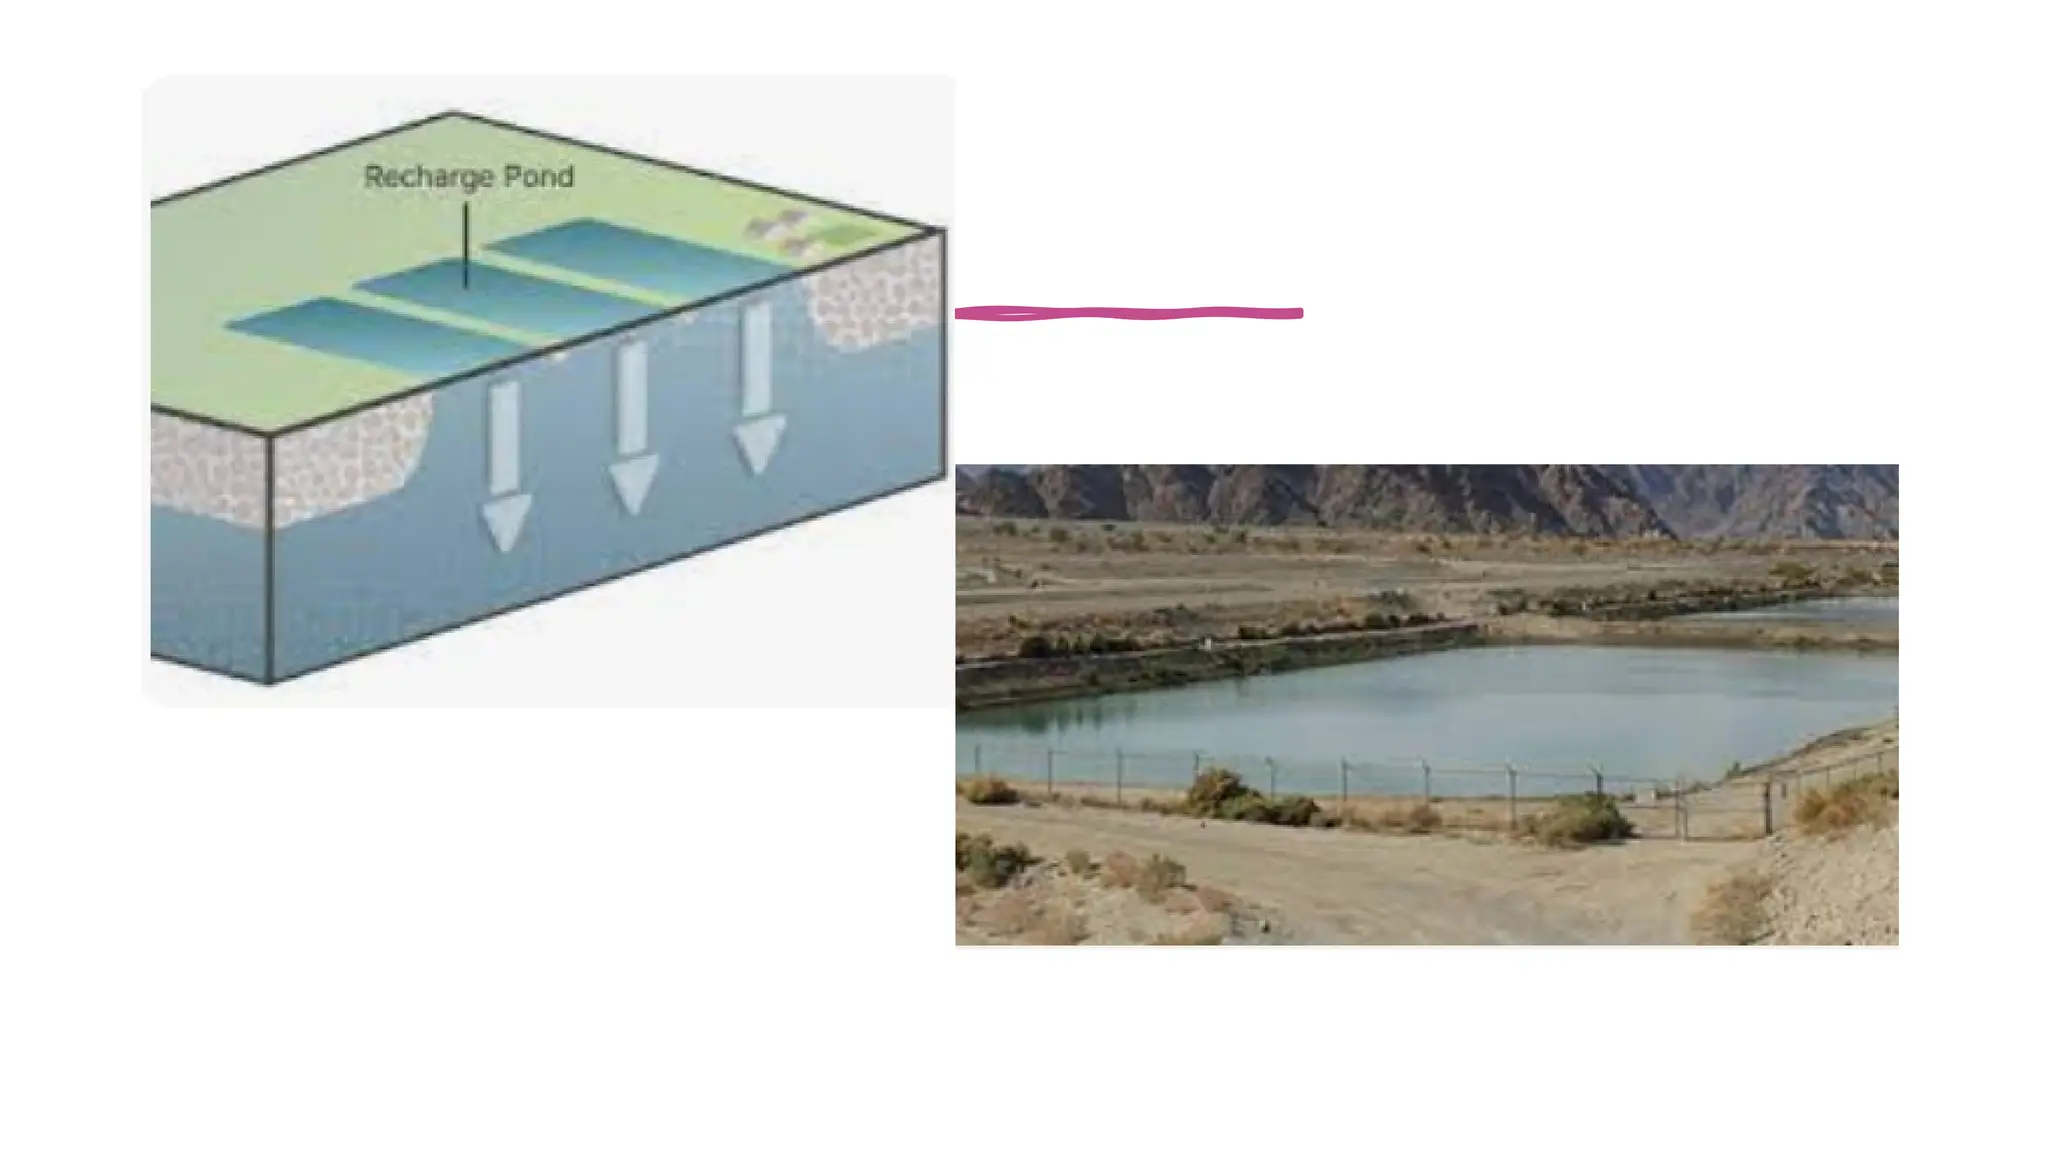
•Make surewhatever
rainfall we are having ,
as much as possible of
it infilters into ground
surface and do not
flow as runoff (which
is a waste as from our
problem standpoint)
•How to do that ?
Misc.
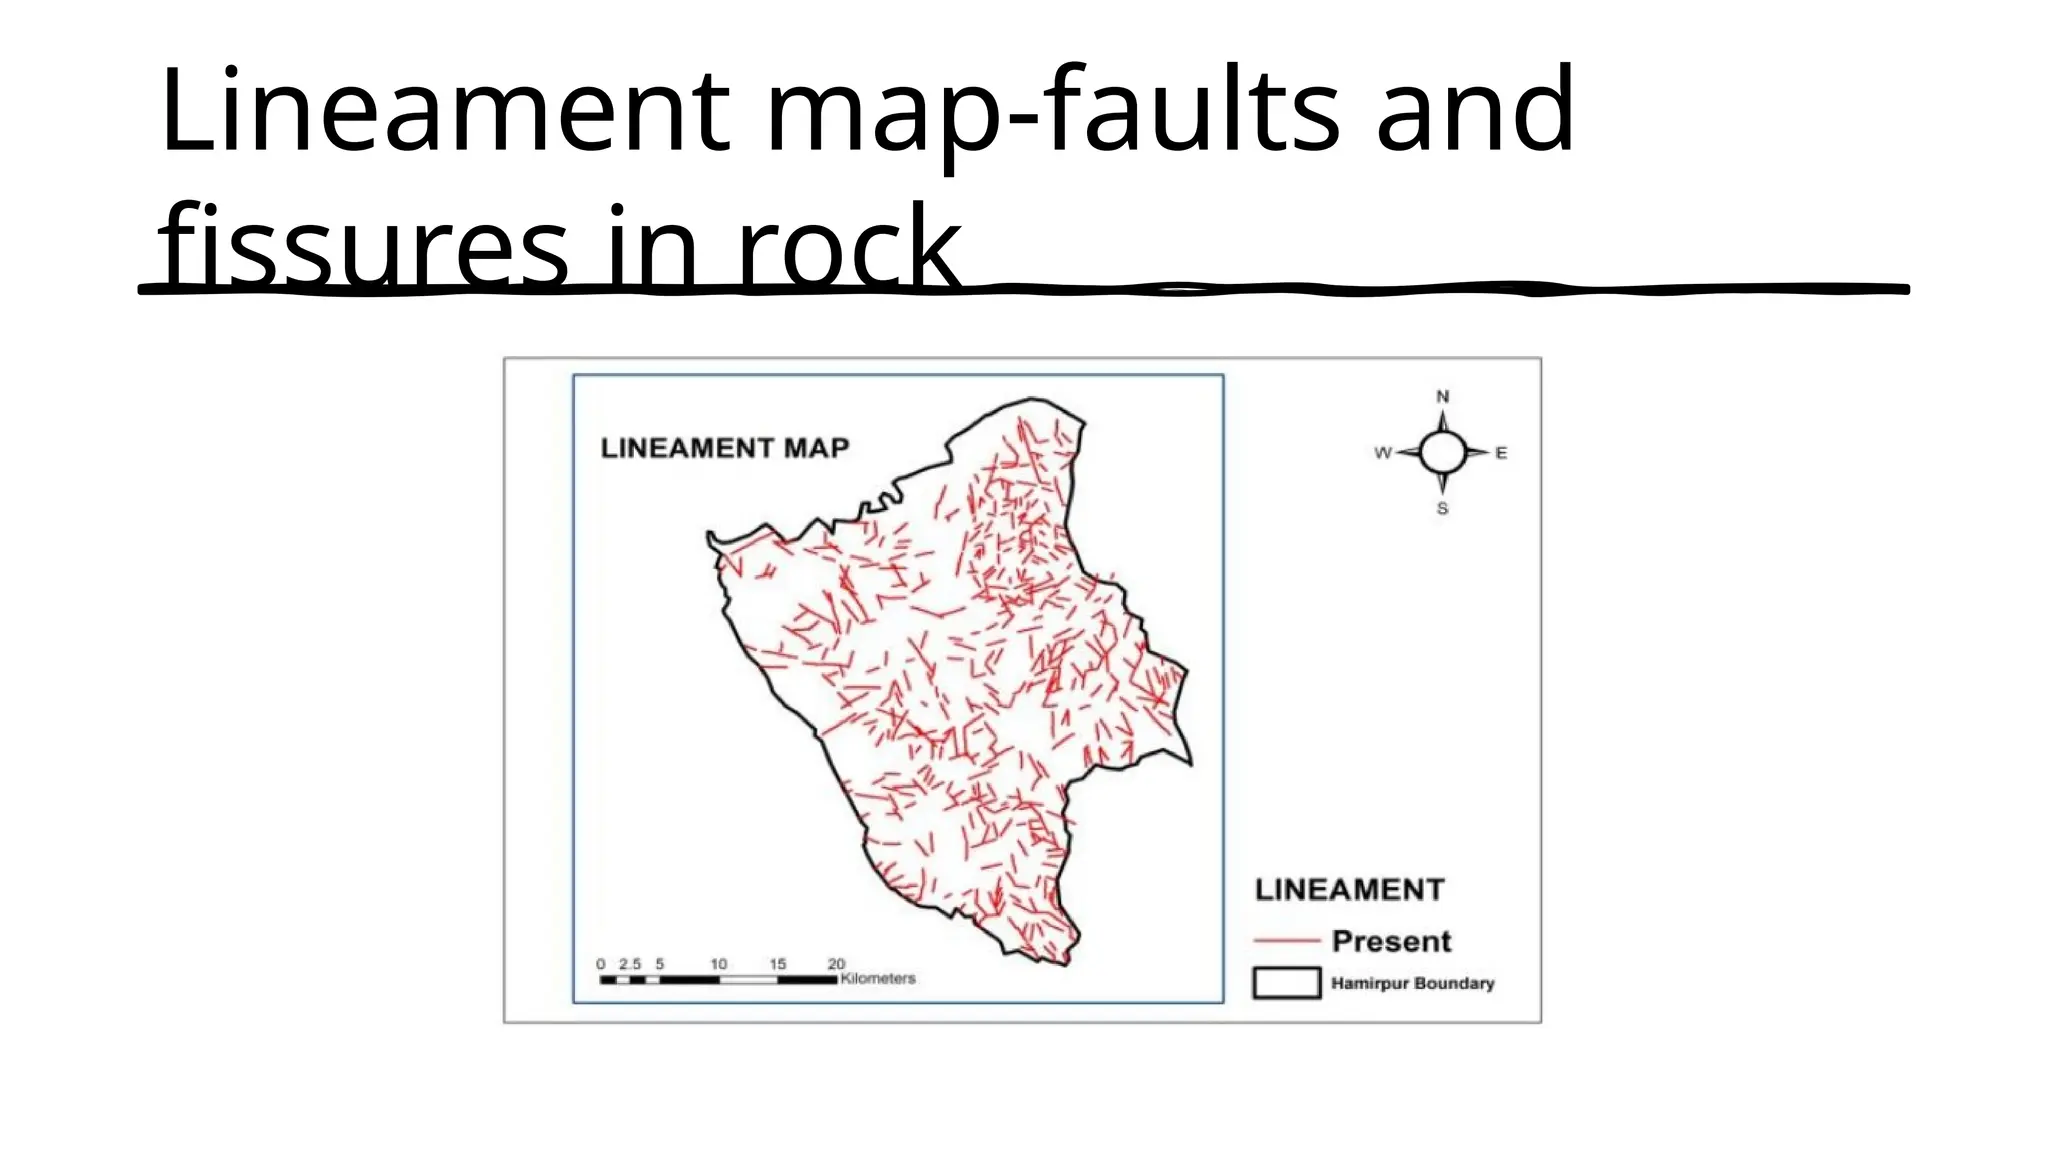
•Lineament maps- showingjoints, fractures
and folds that are present beneath the
surface of earth .
•Water holding capacity of these lineaments
is very good and acts as a good conductor of
water transmission
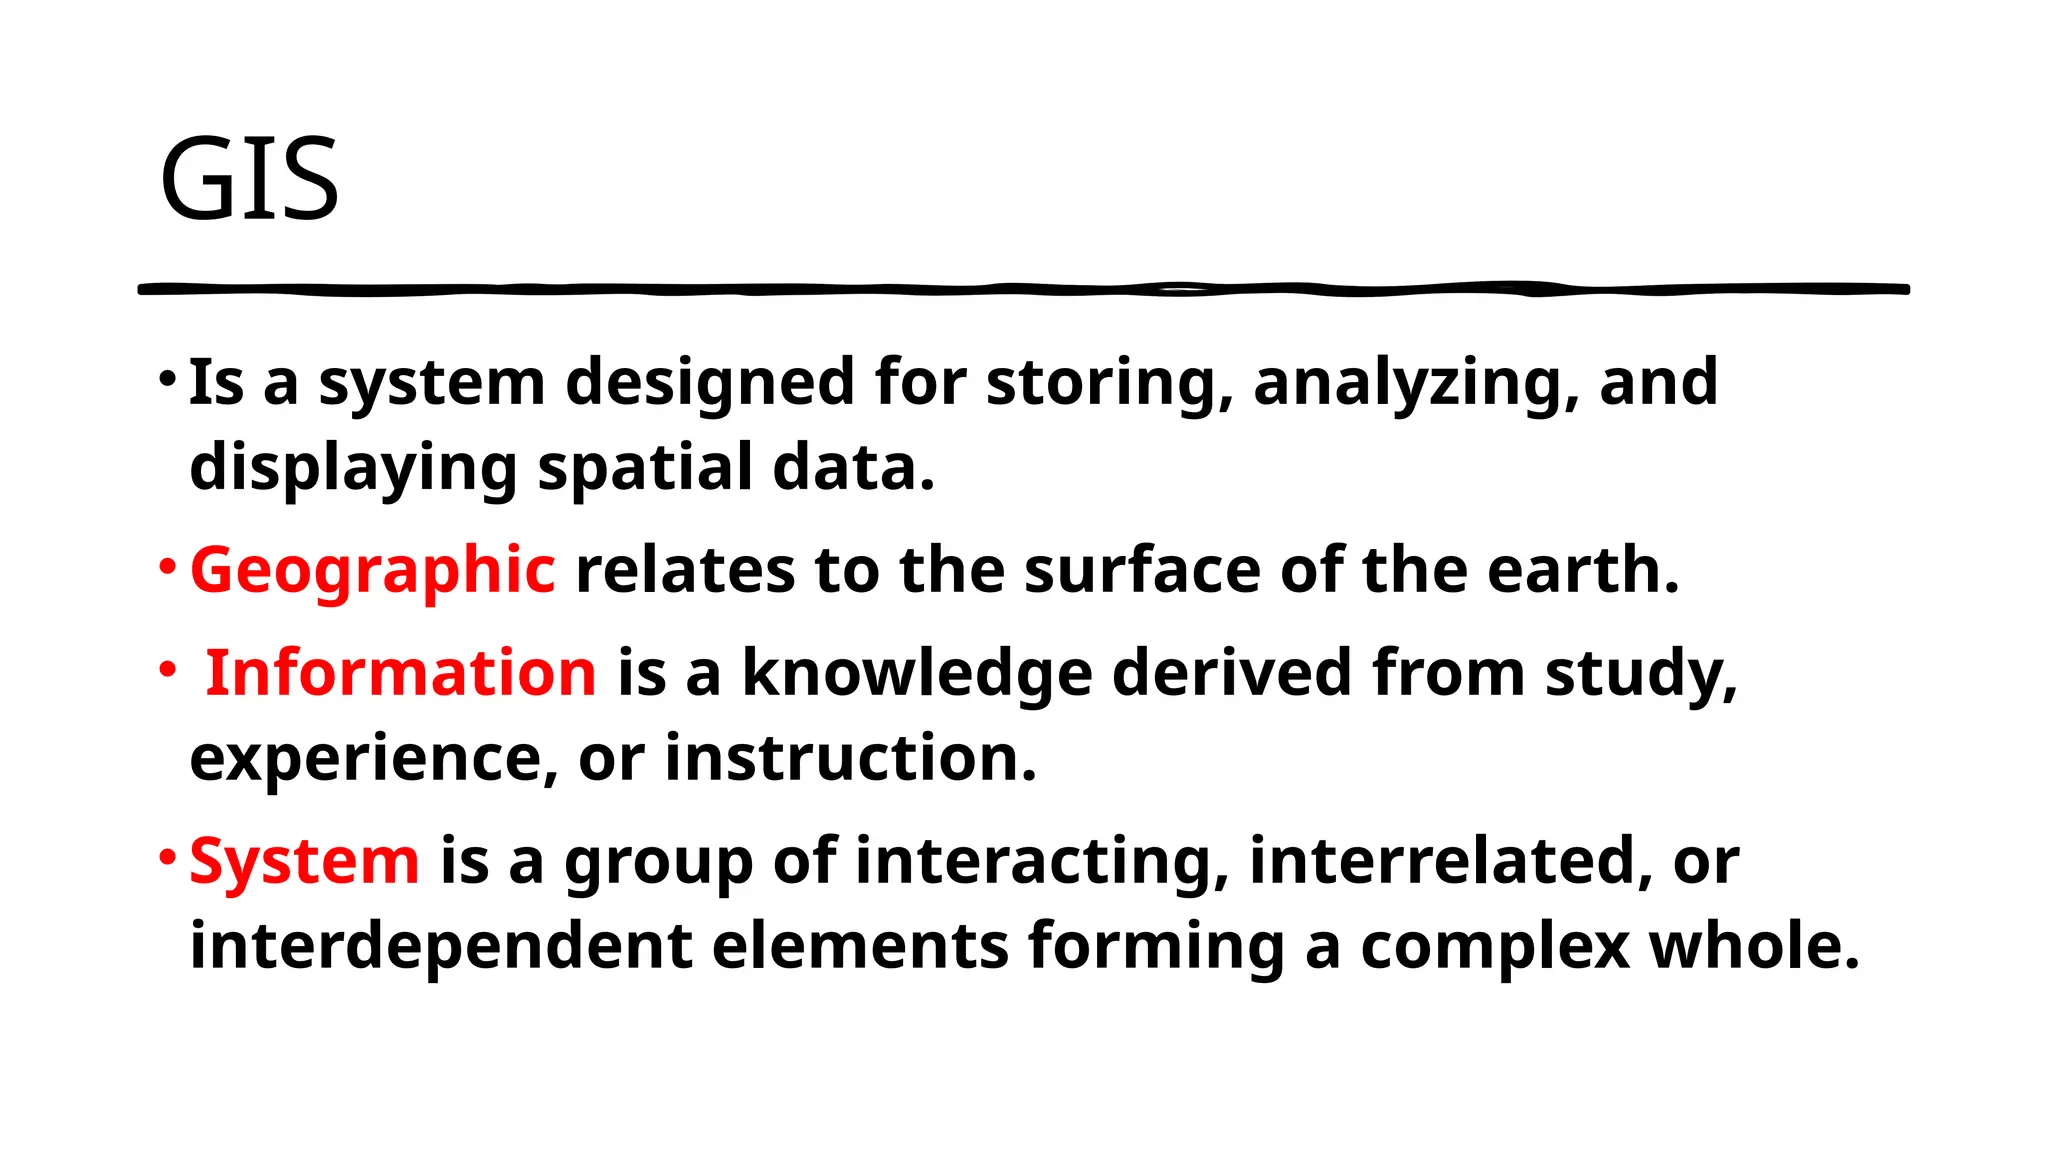
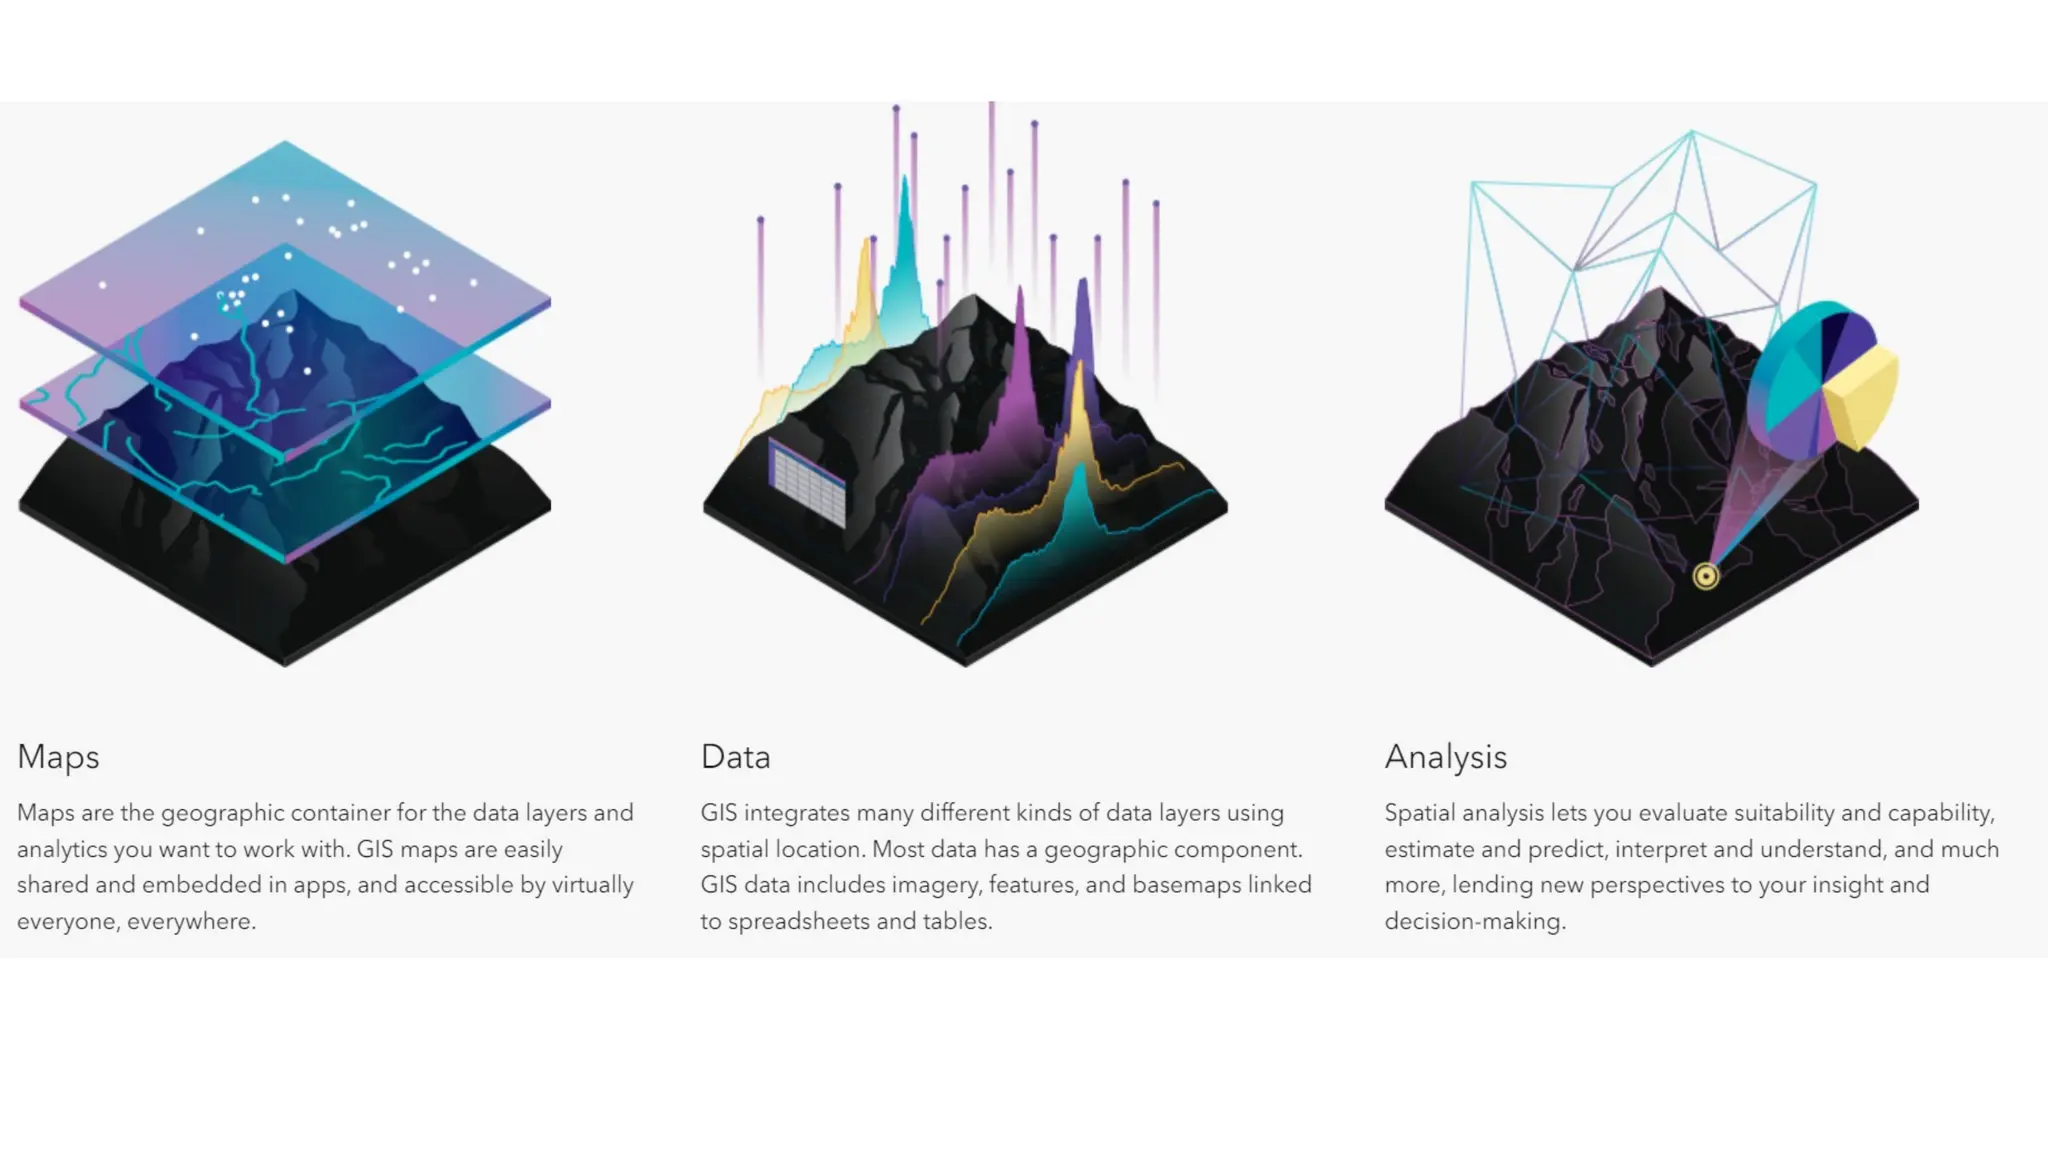
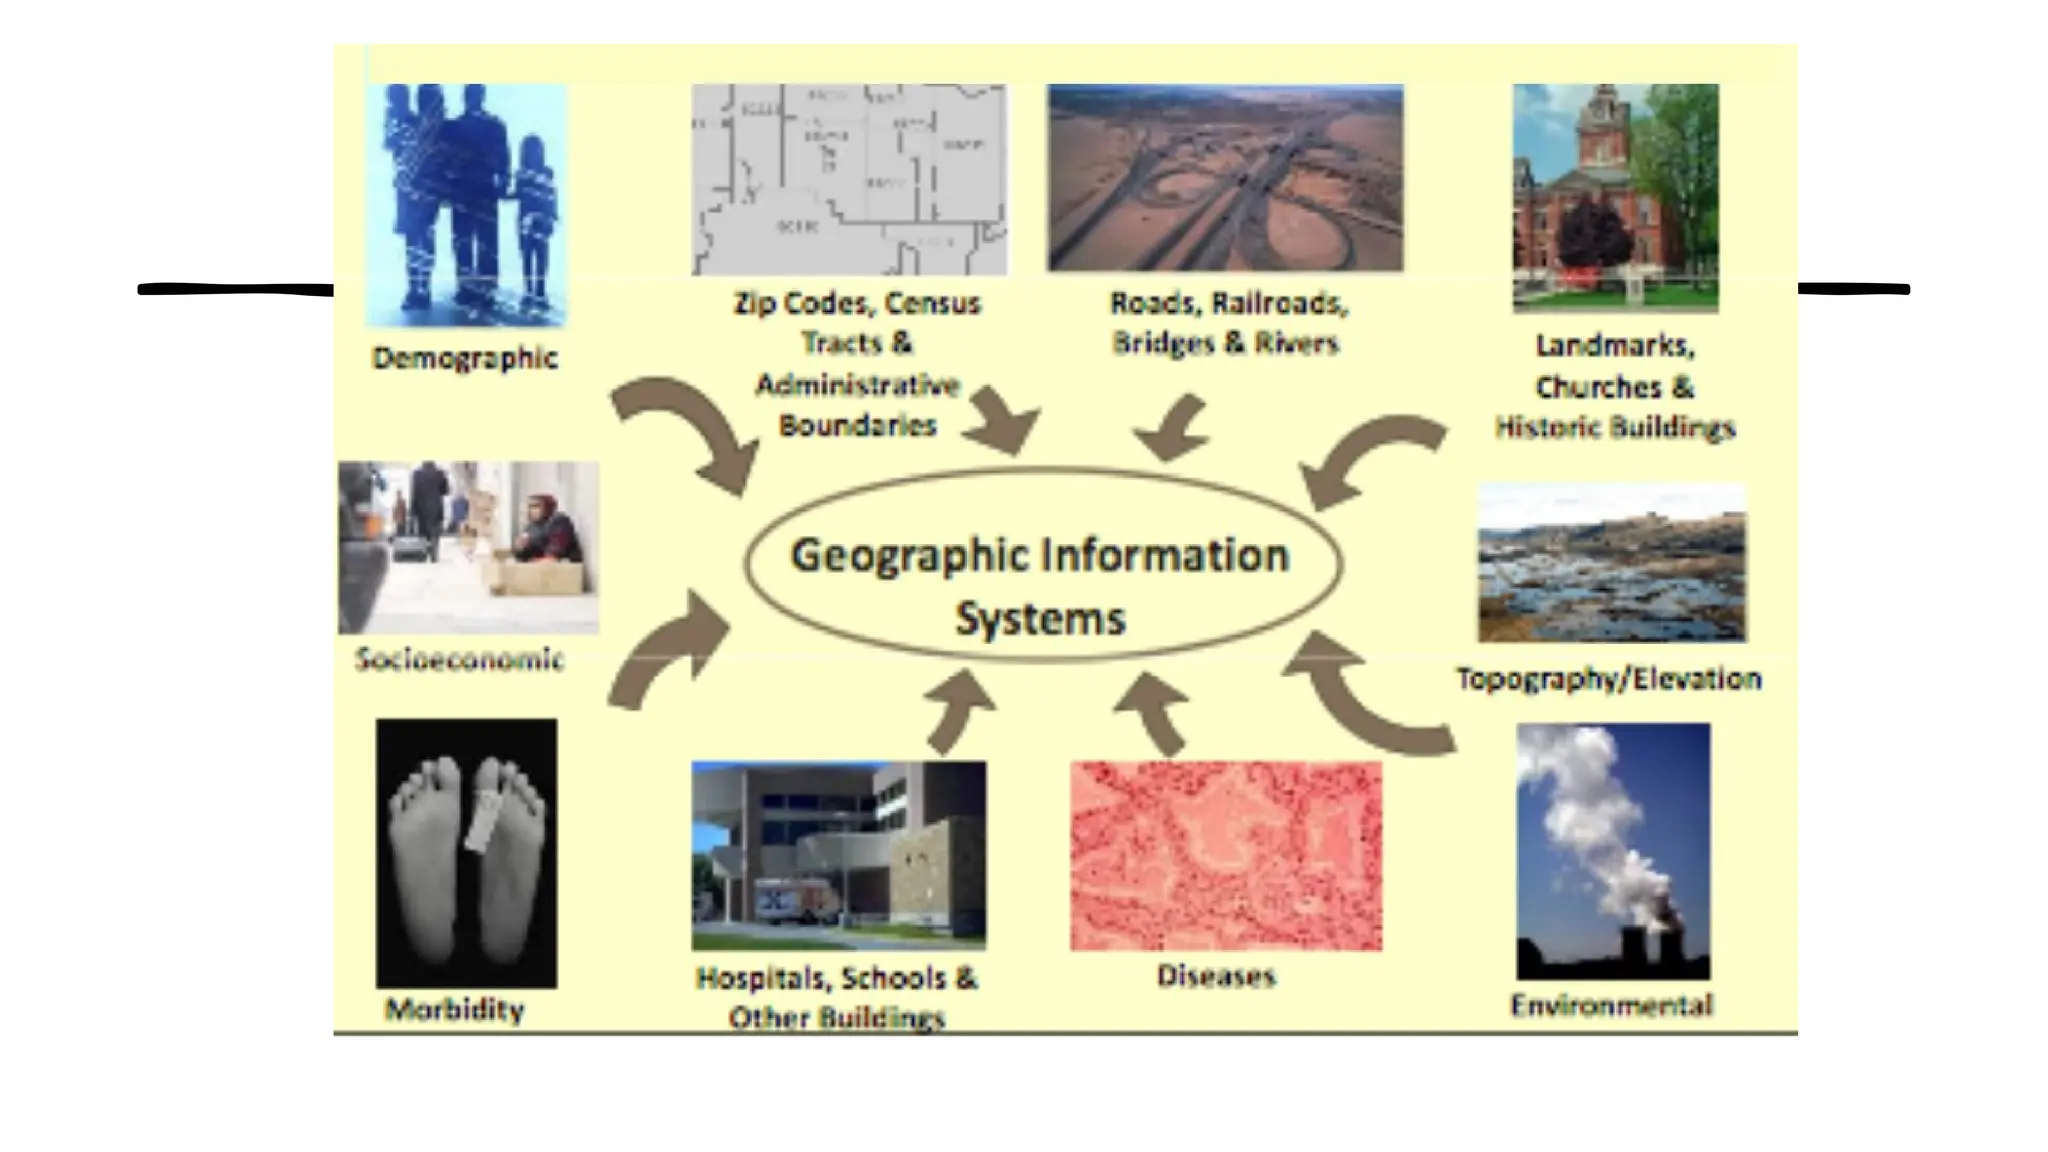
GIS
• Is asystem designed for storing, analyzing, and
displaying spatial data.
• Geographic relates to the surface of the earth.
• Information is a knowledge derived from study,
experience, or instruction.
• System is a group of interacting, interrelated, or
interdependent elements forming a complex whole.
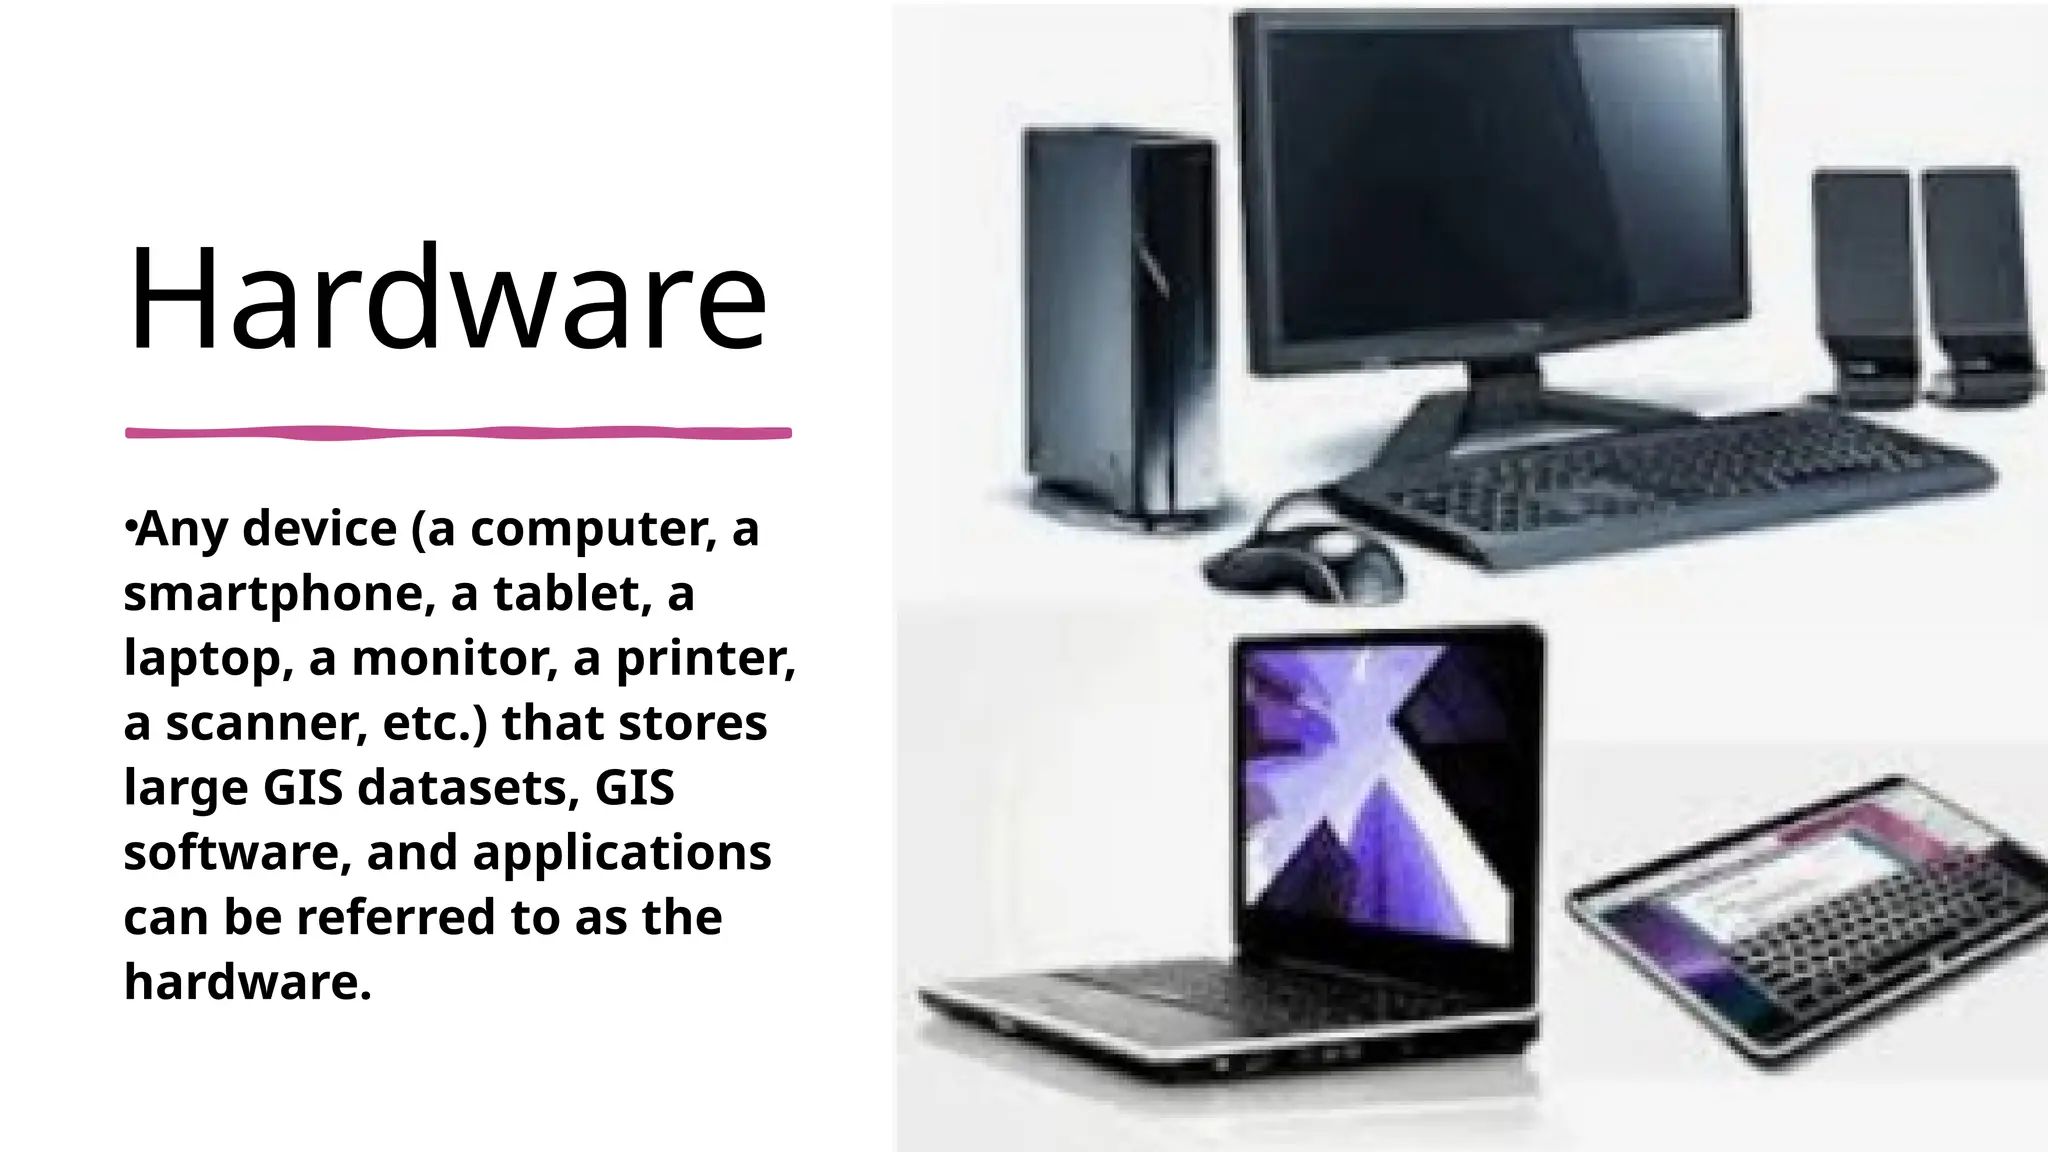
Hardware
•Any device (acomputer, a
smartphone, a tablet, a
laptop, a monitor, a printer,
a scanner, etc.) that stores
large GIS datasets, GIS
software, and applications
can be referred to as the
hardware.
43.
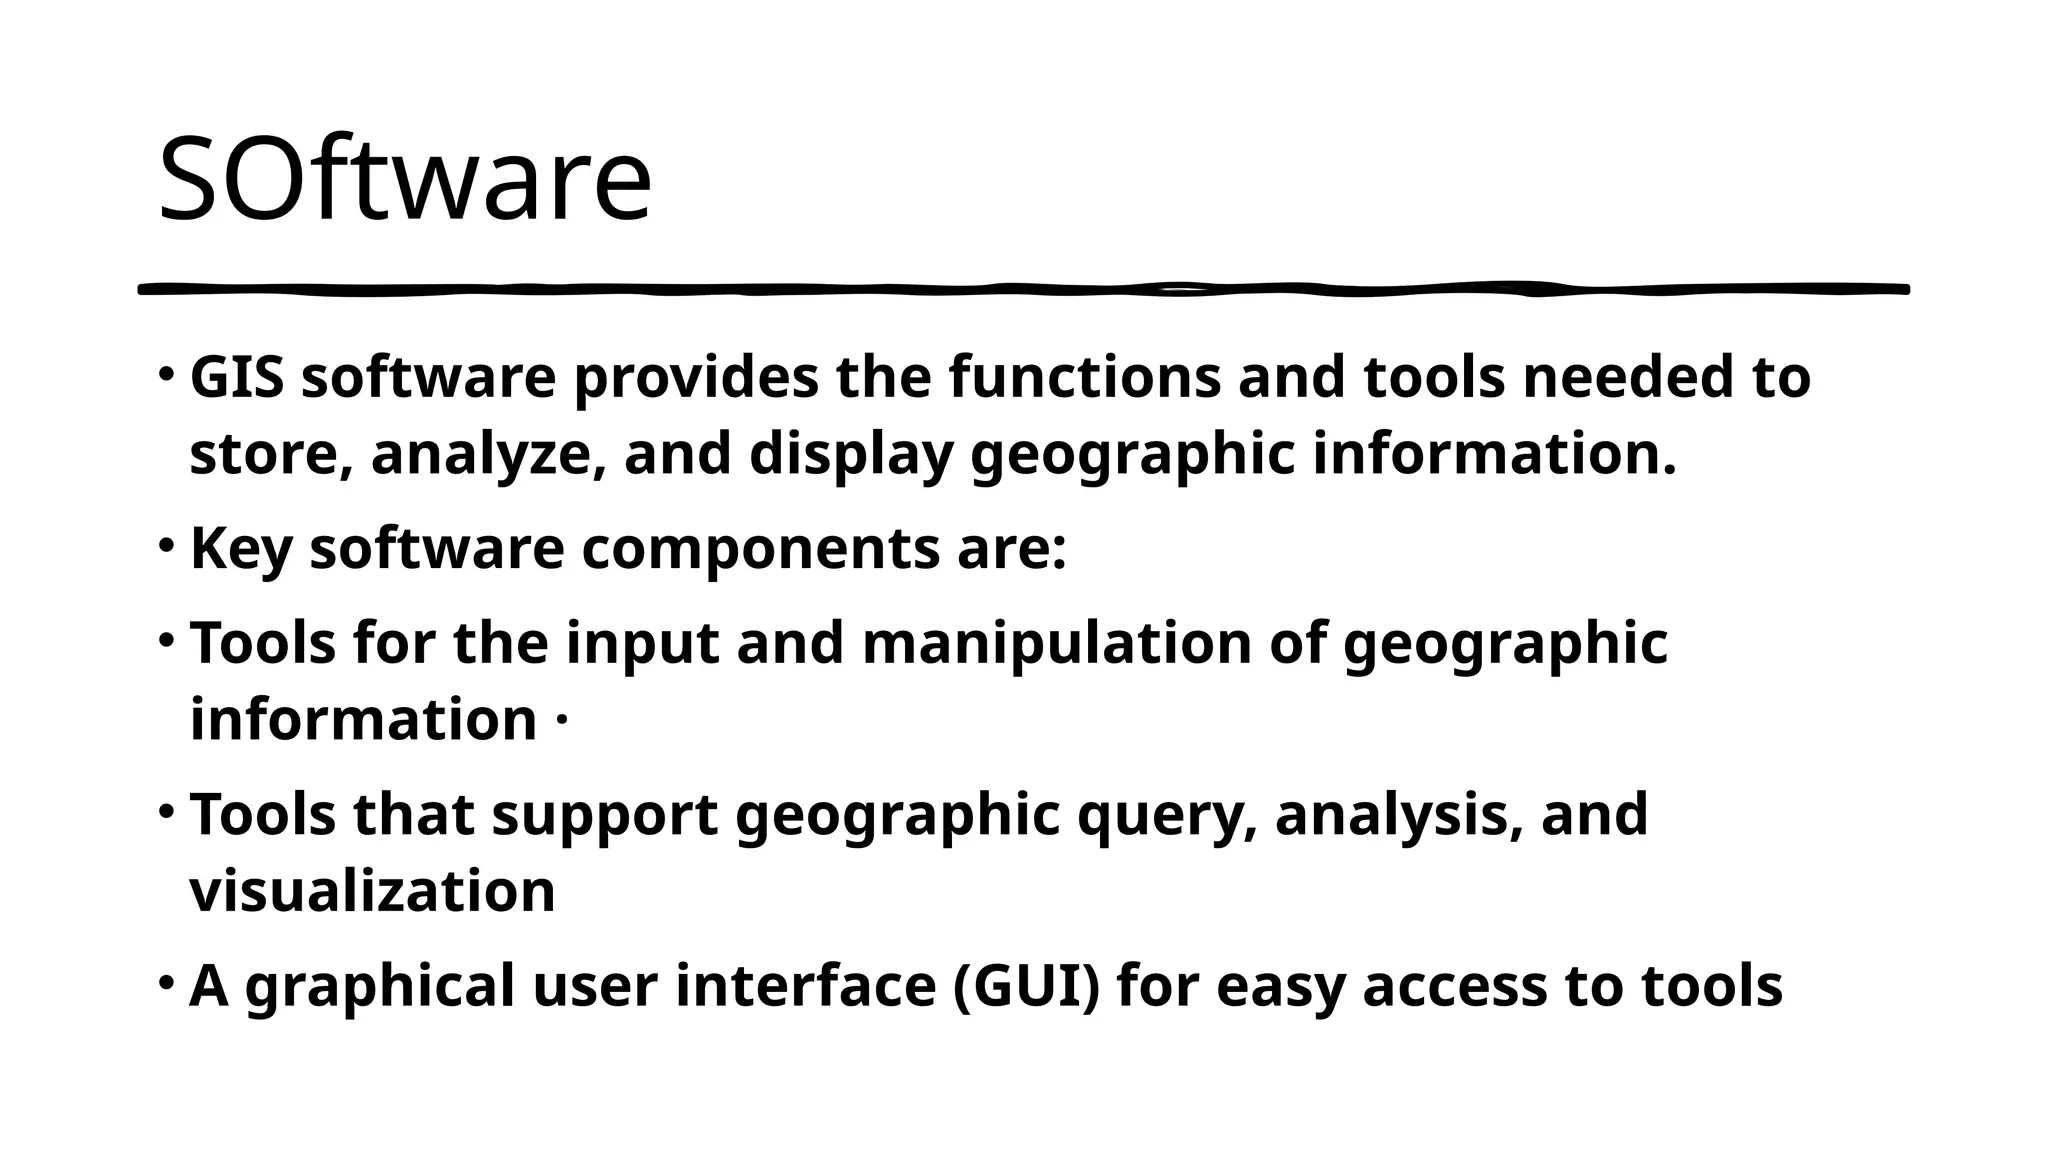
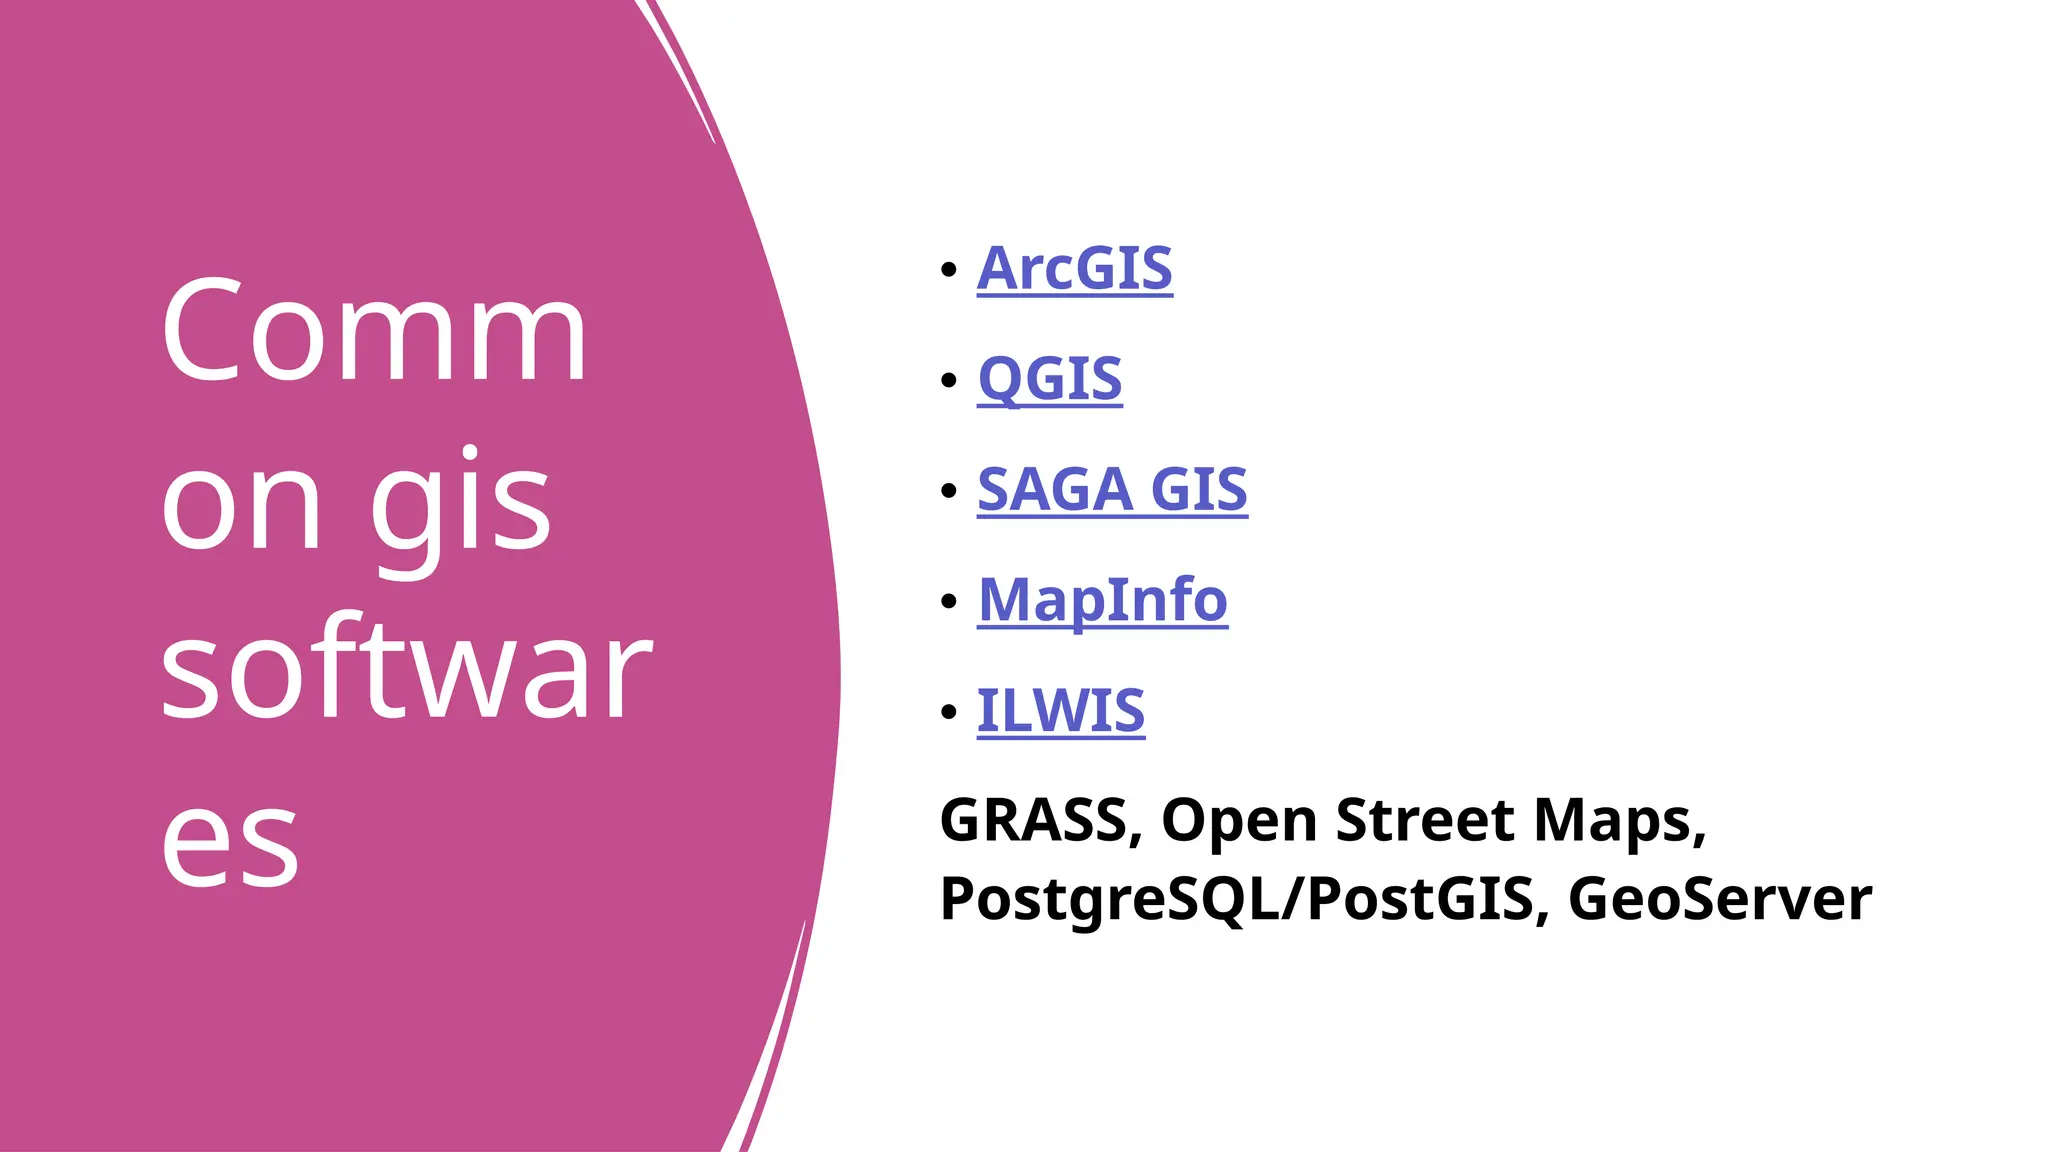
SOftware
• GIS softwareprovides the functions and tools needed to
store, analyze, and display geographic information.
• Key software components are:
• Tools for the input and manipulation of geographic
information ·
• Tools that support geographic query, analysis, and
visualization
• A graphical user interface (GUI) for easy access to tools
methods/procedures
• An integralpart of the GIS framework is the various
techniques used to turn data into digestible and
actionable information for easy interpretation.
• This may include algorithms, statistics, formulas,
and models that are predefined and unique to each
application.
46.
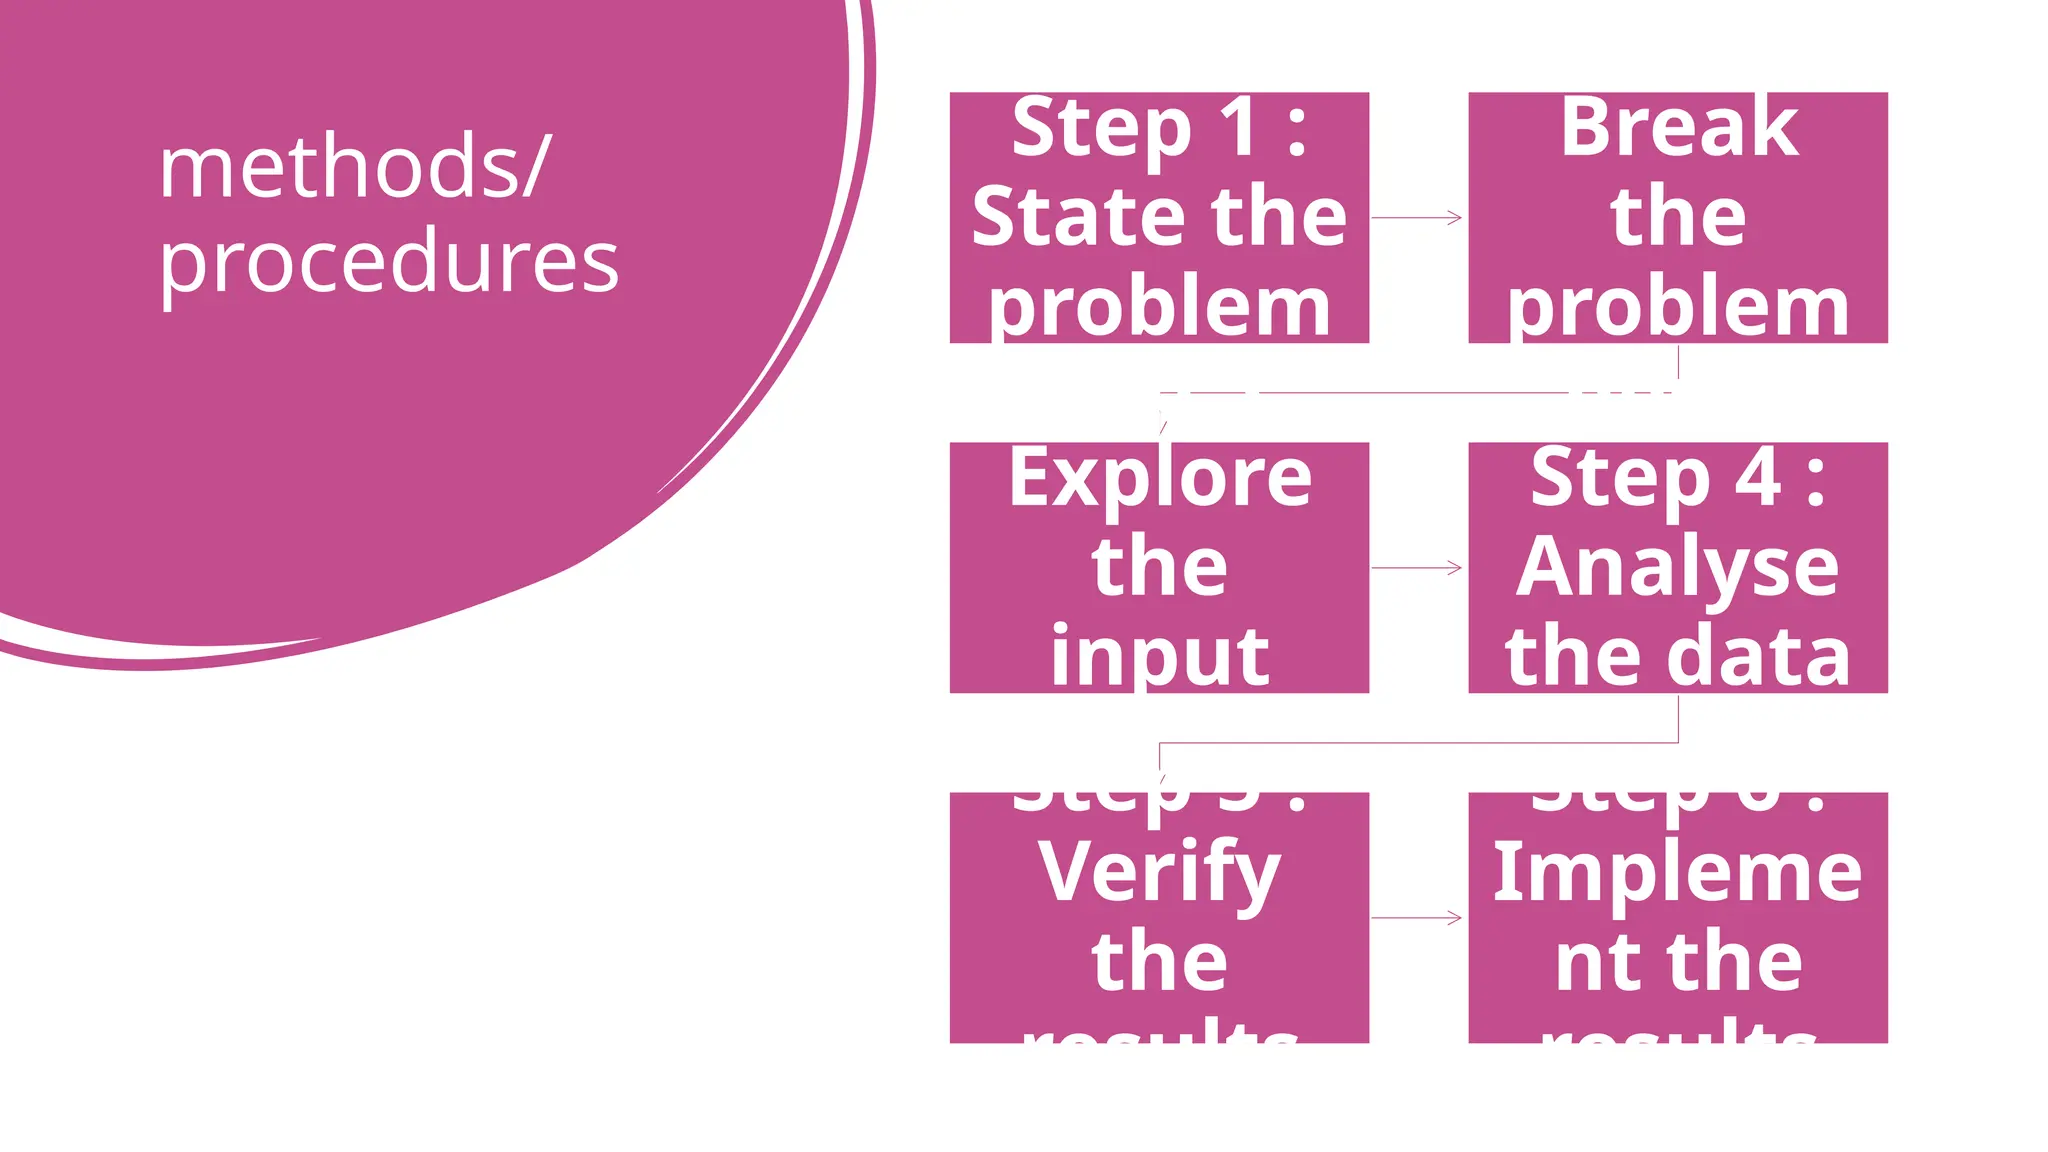
methods/
procedures
Step 1 :
Statethe
problem
Step 2:
Break
the
problem
down
Step 3 :
Explore
the
input
datasets
Step 4 :
Analyse
the data
Step 5 :
Verify
the
results
Step 6 :
Impleme
nt the
results
47.
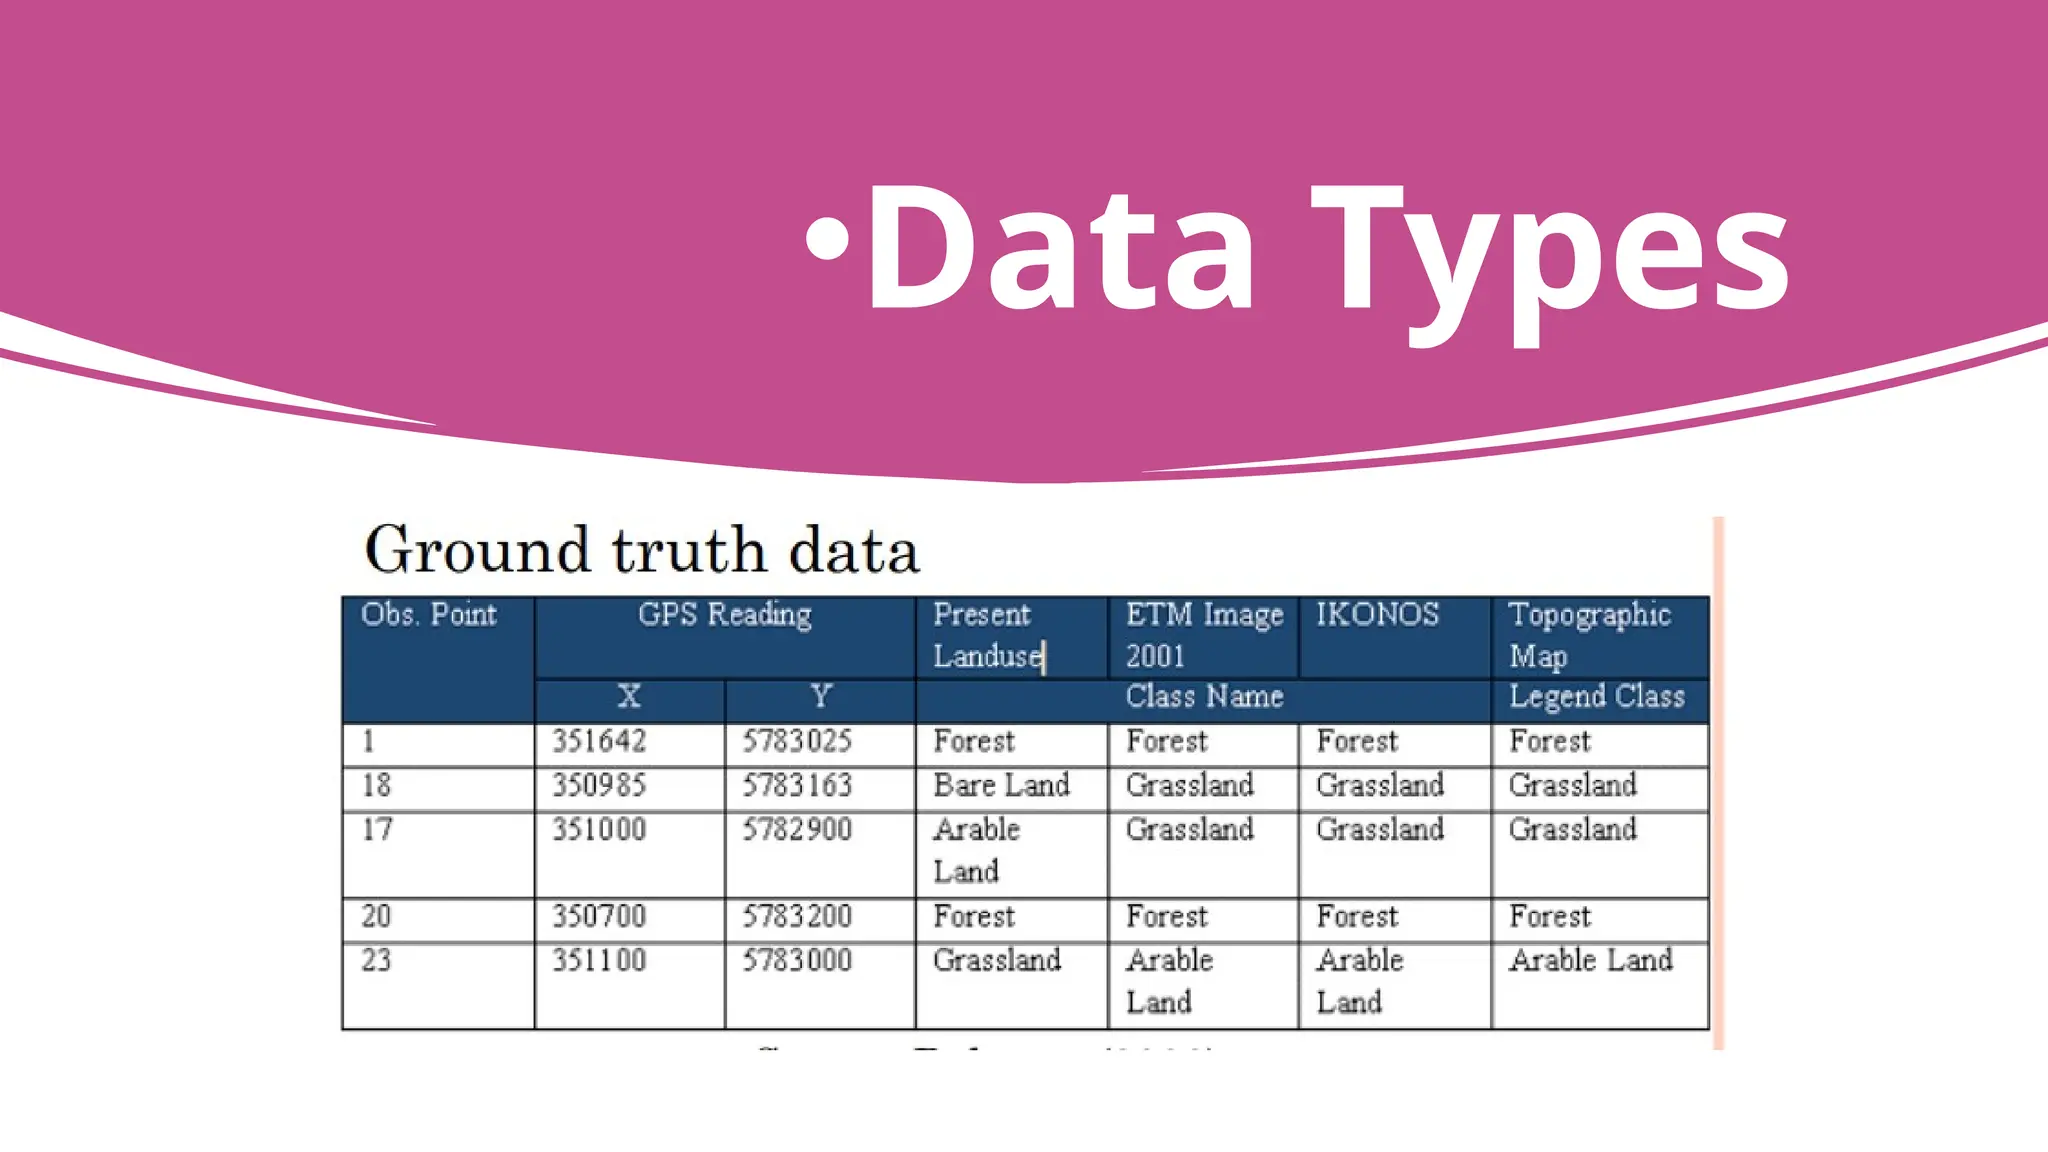
data
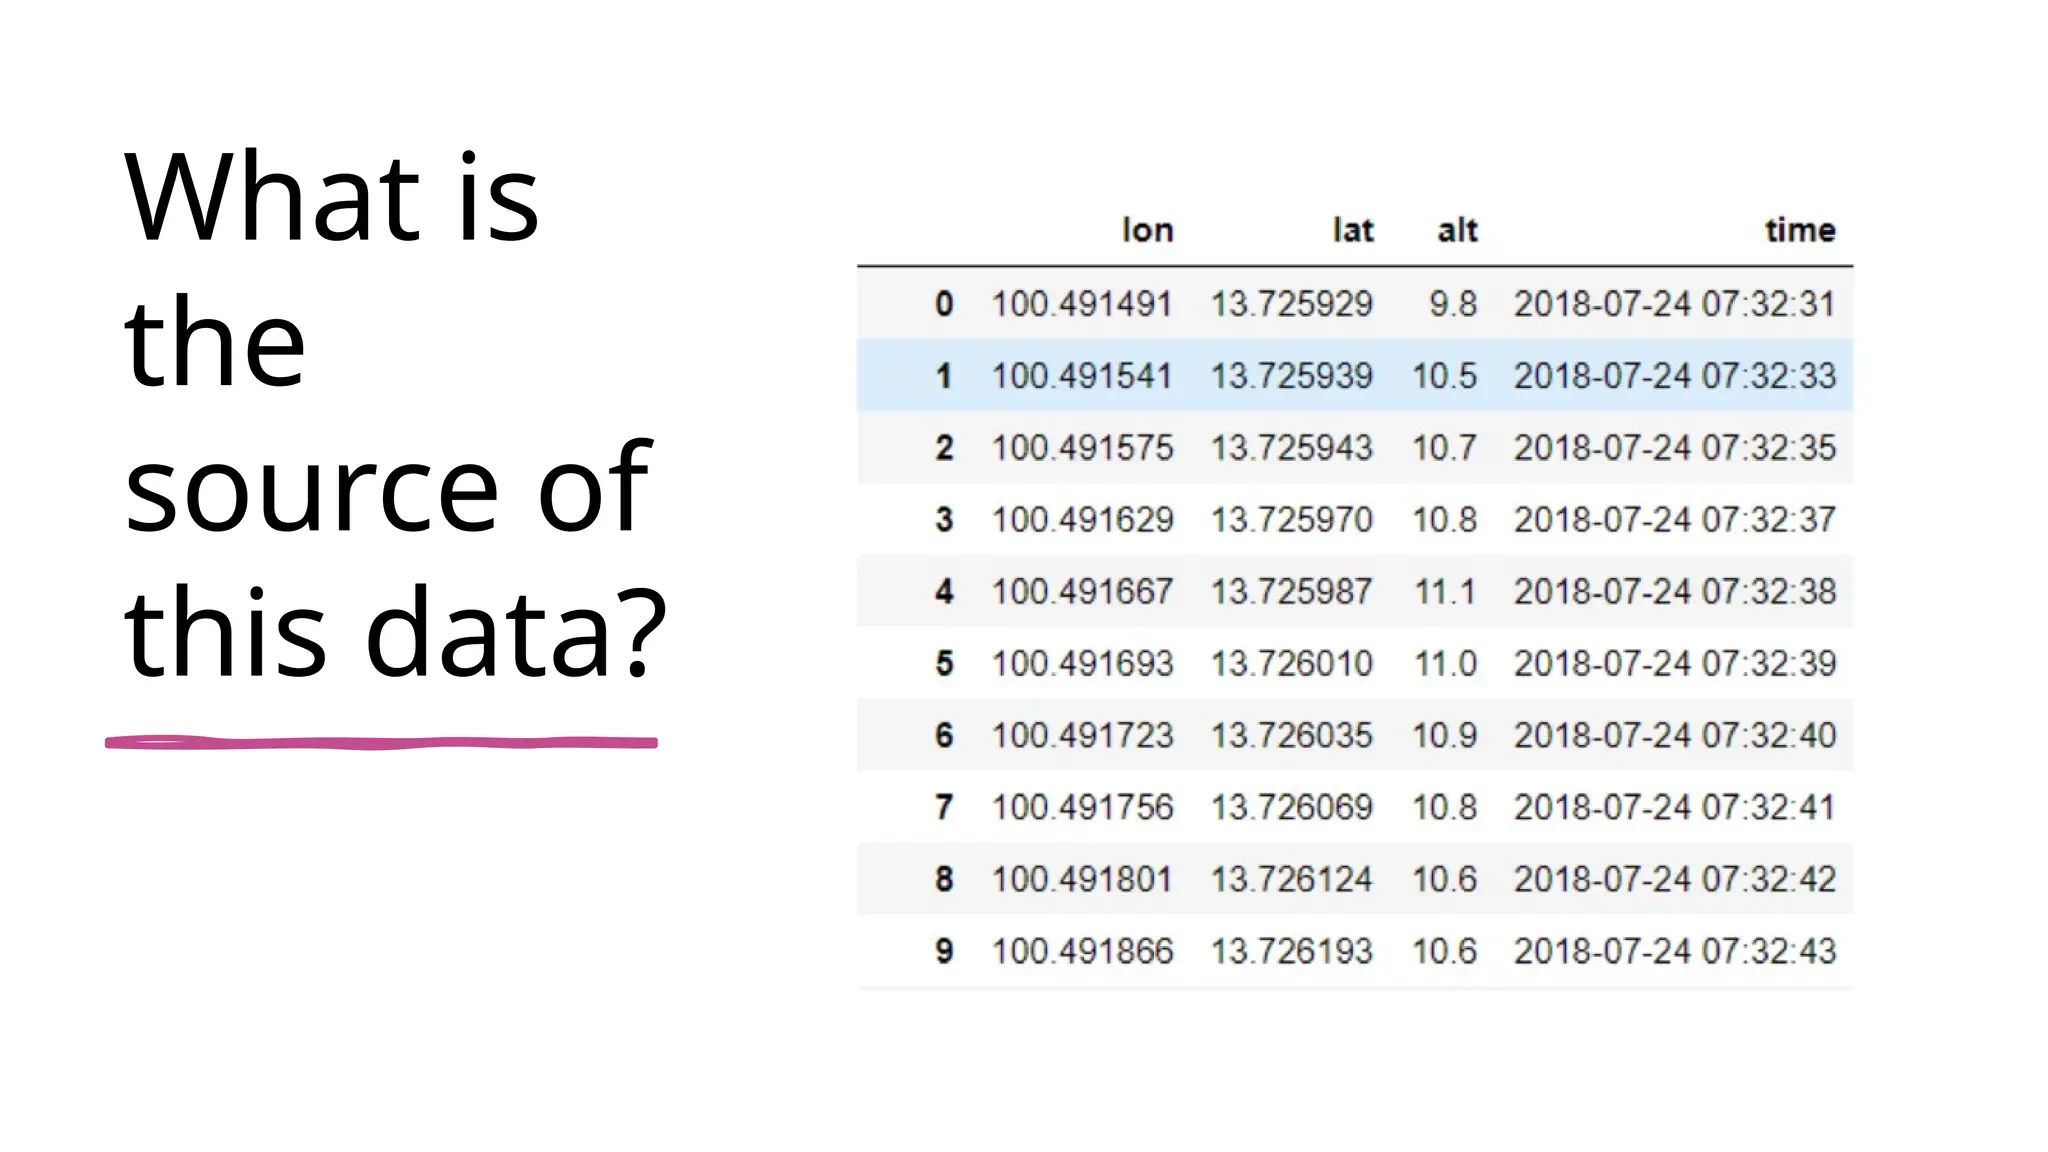
•Geographic data andrelated tabular data
(can be collected manually or purchased
from a commercial data provider)
• Since a GIS incorporates data from
multiple sources, its accuracy defines the
quality of the GIS.
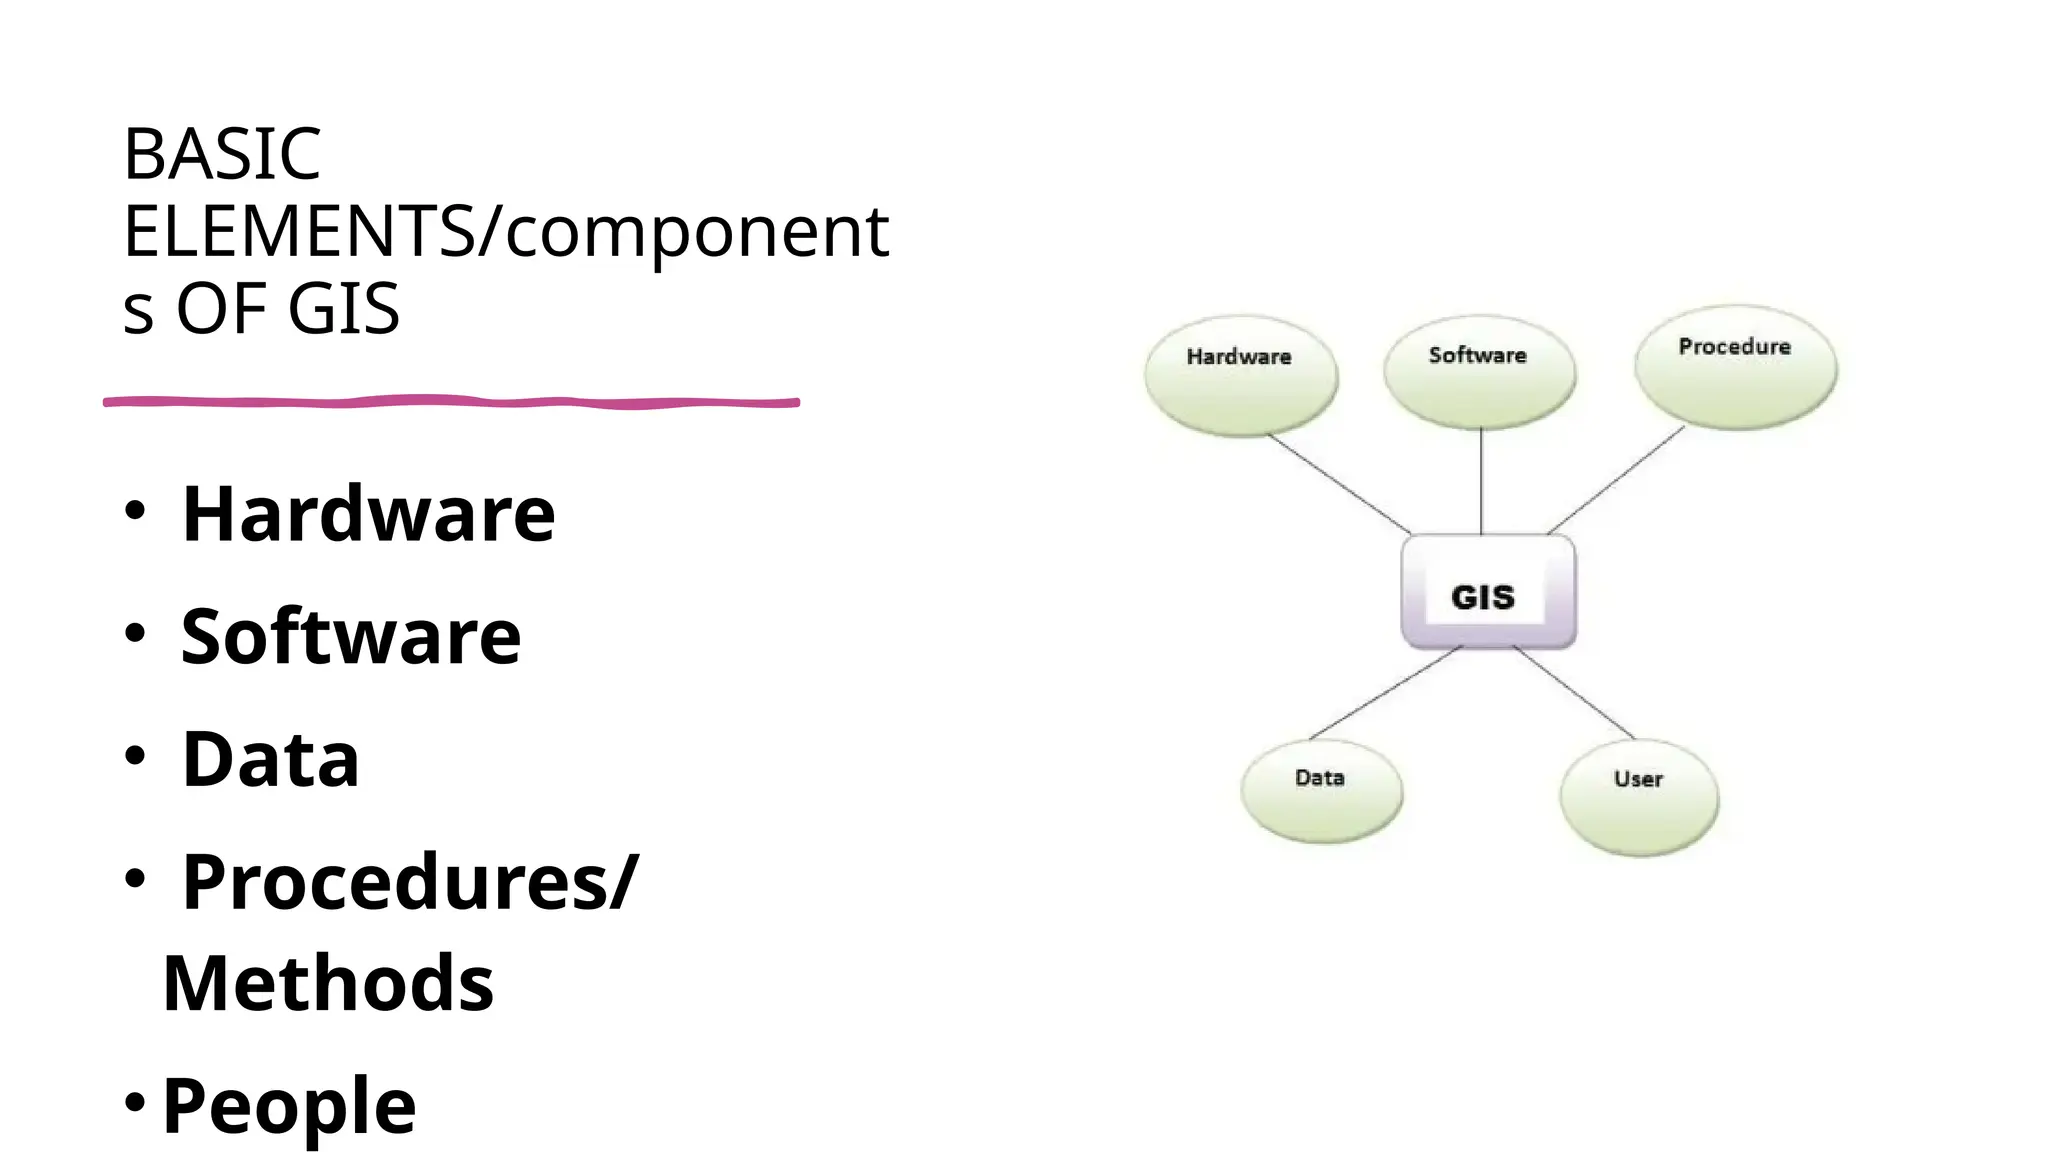
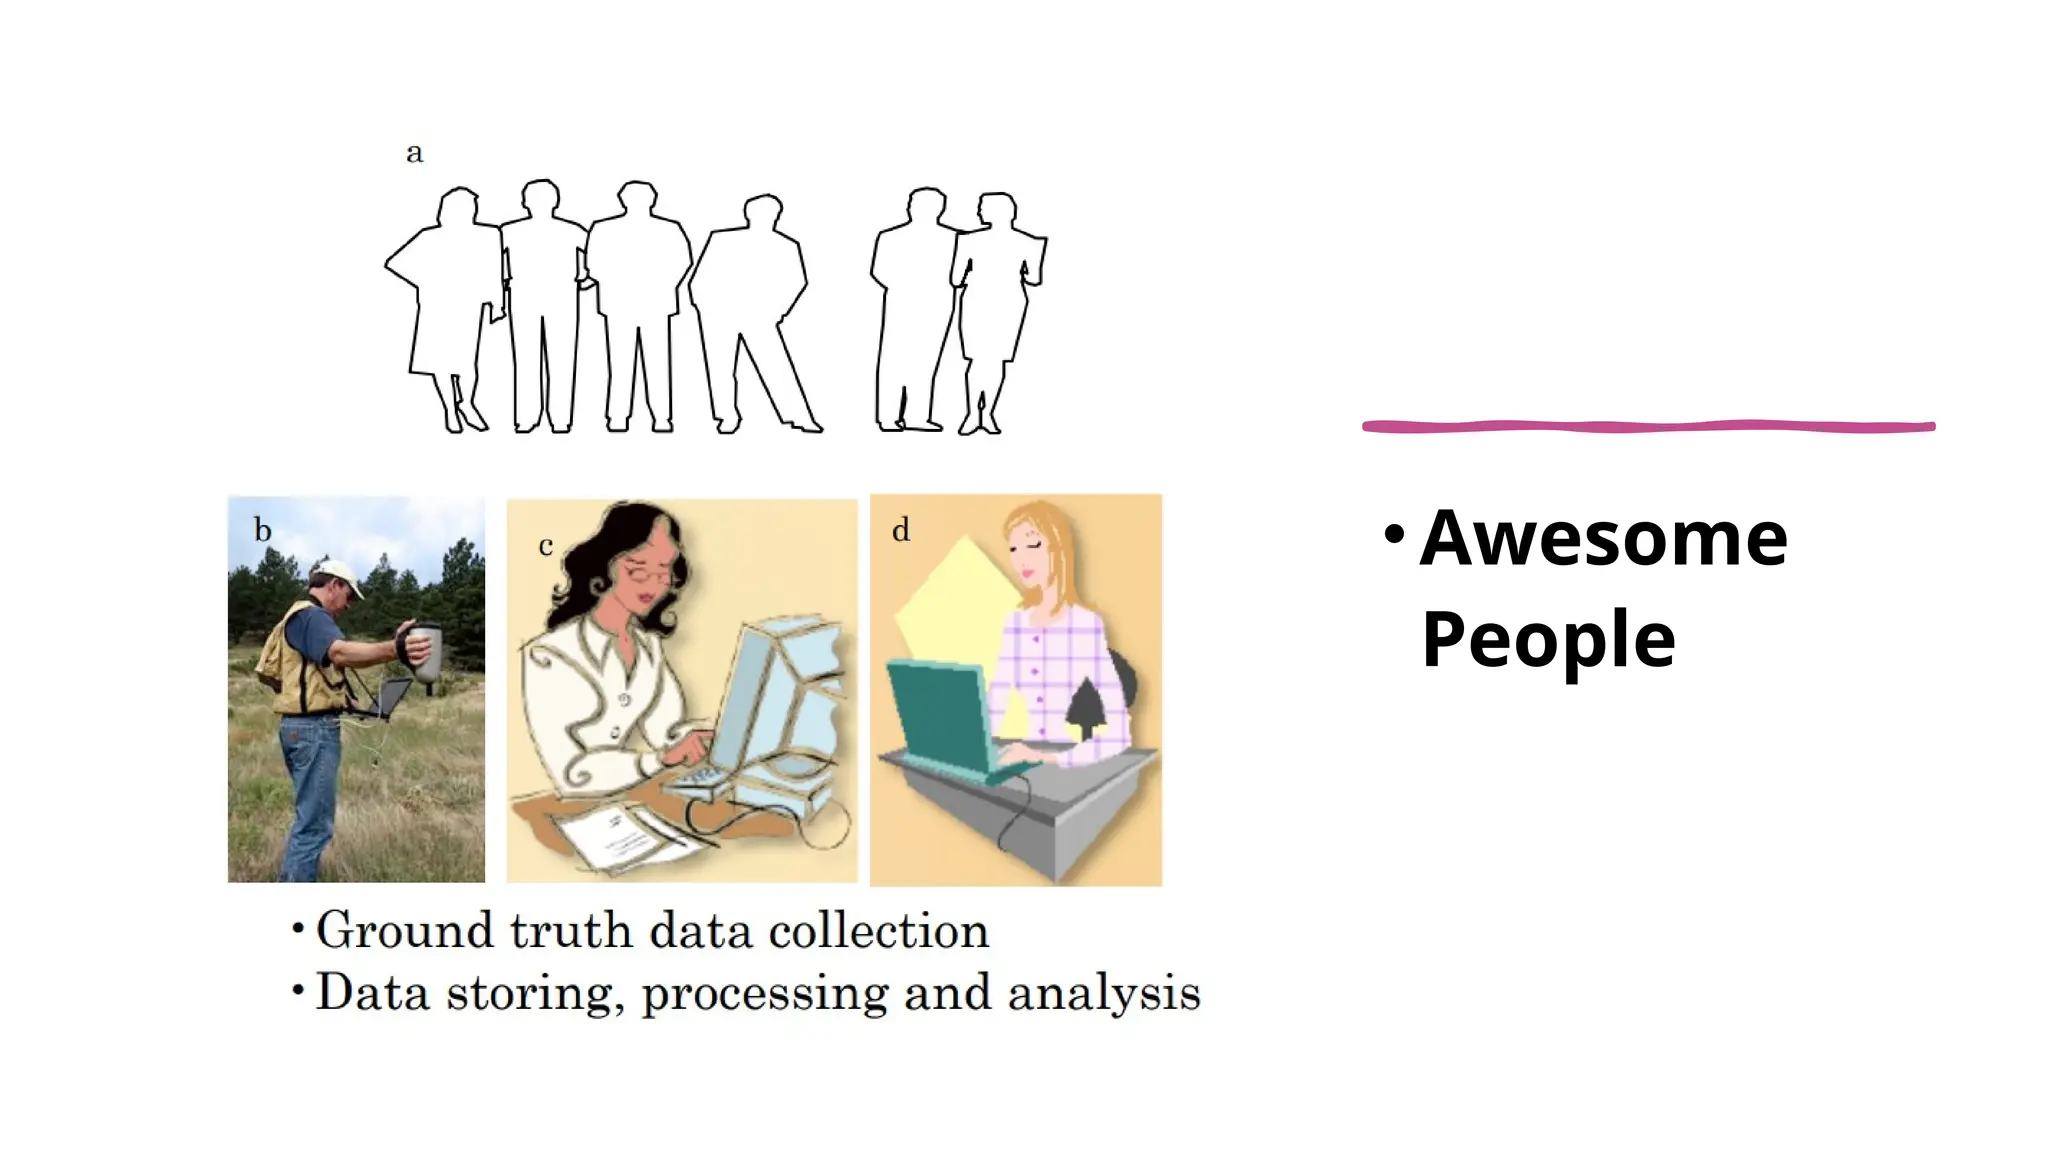
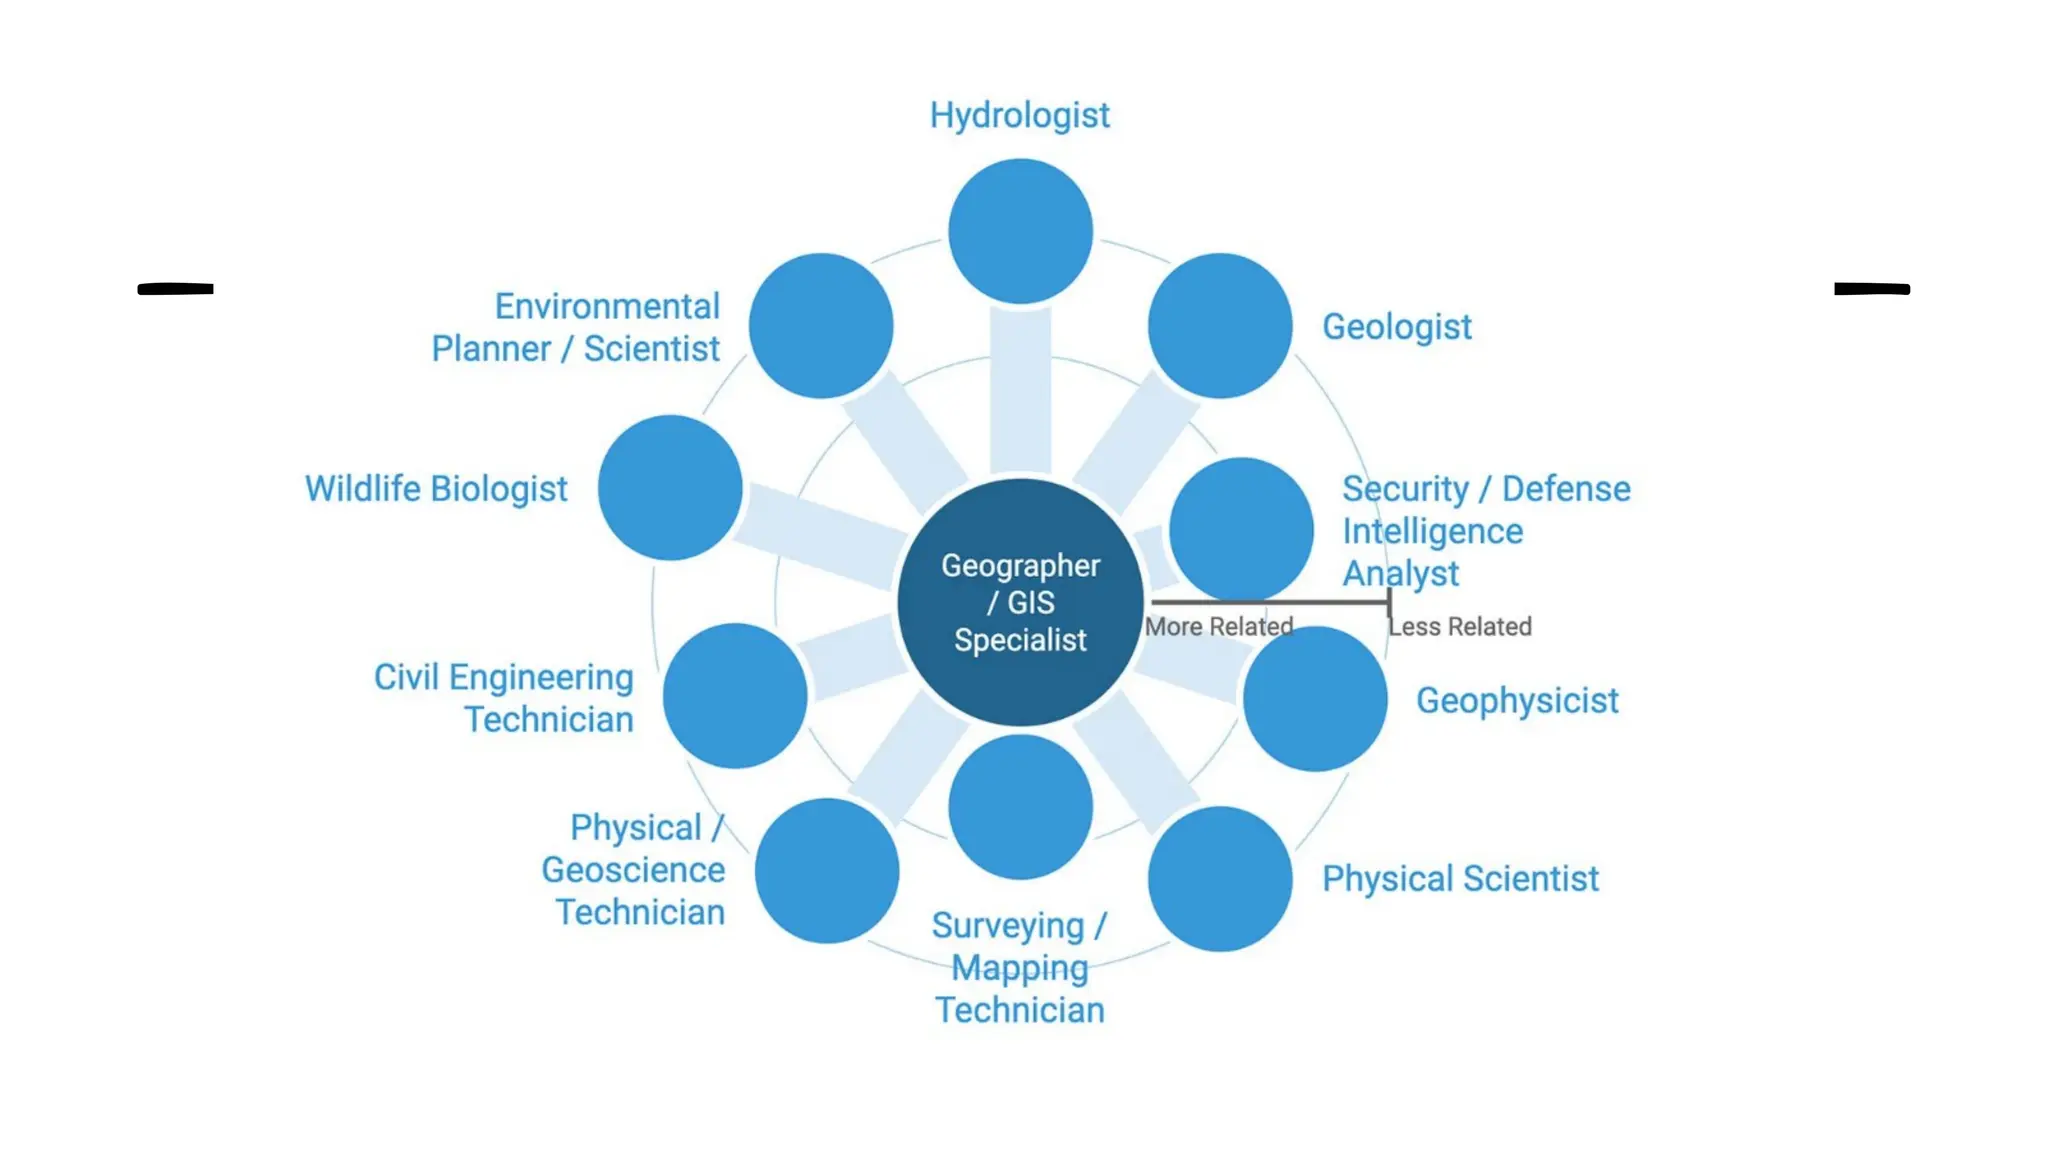
People
• Most importantpart of a GIS
• Includes decision makers, GIS software experts,
Ground data collection Teams
• Define and develop the procedures used by a GIS
Functions/OPERATIONS of GIS
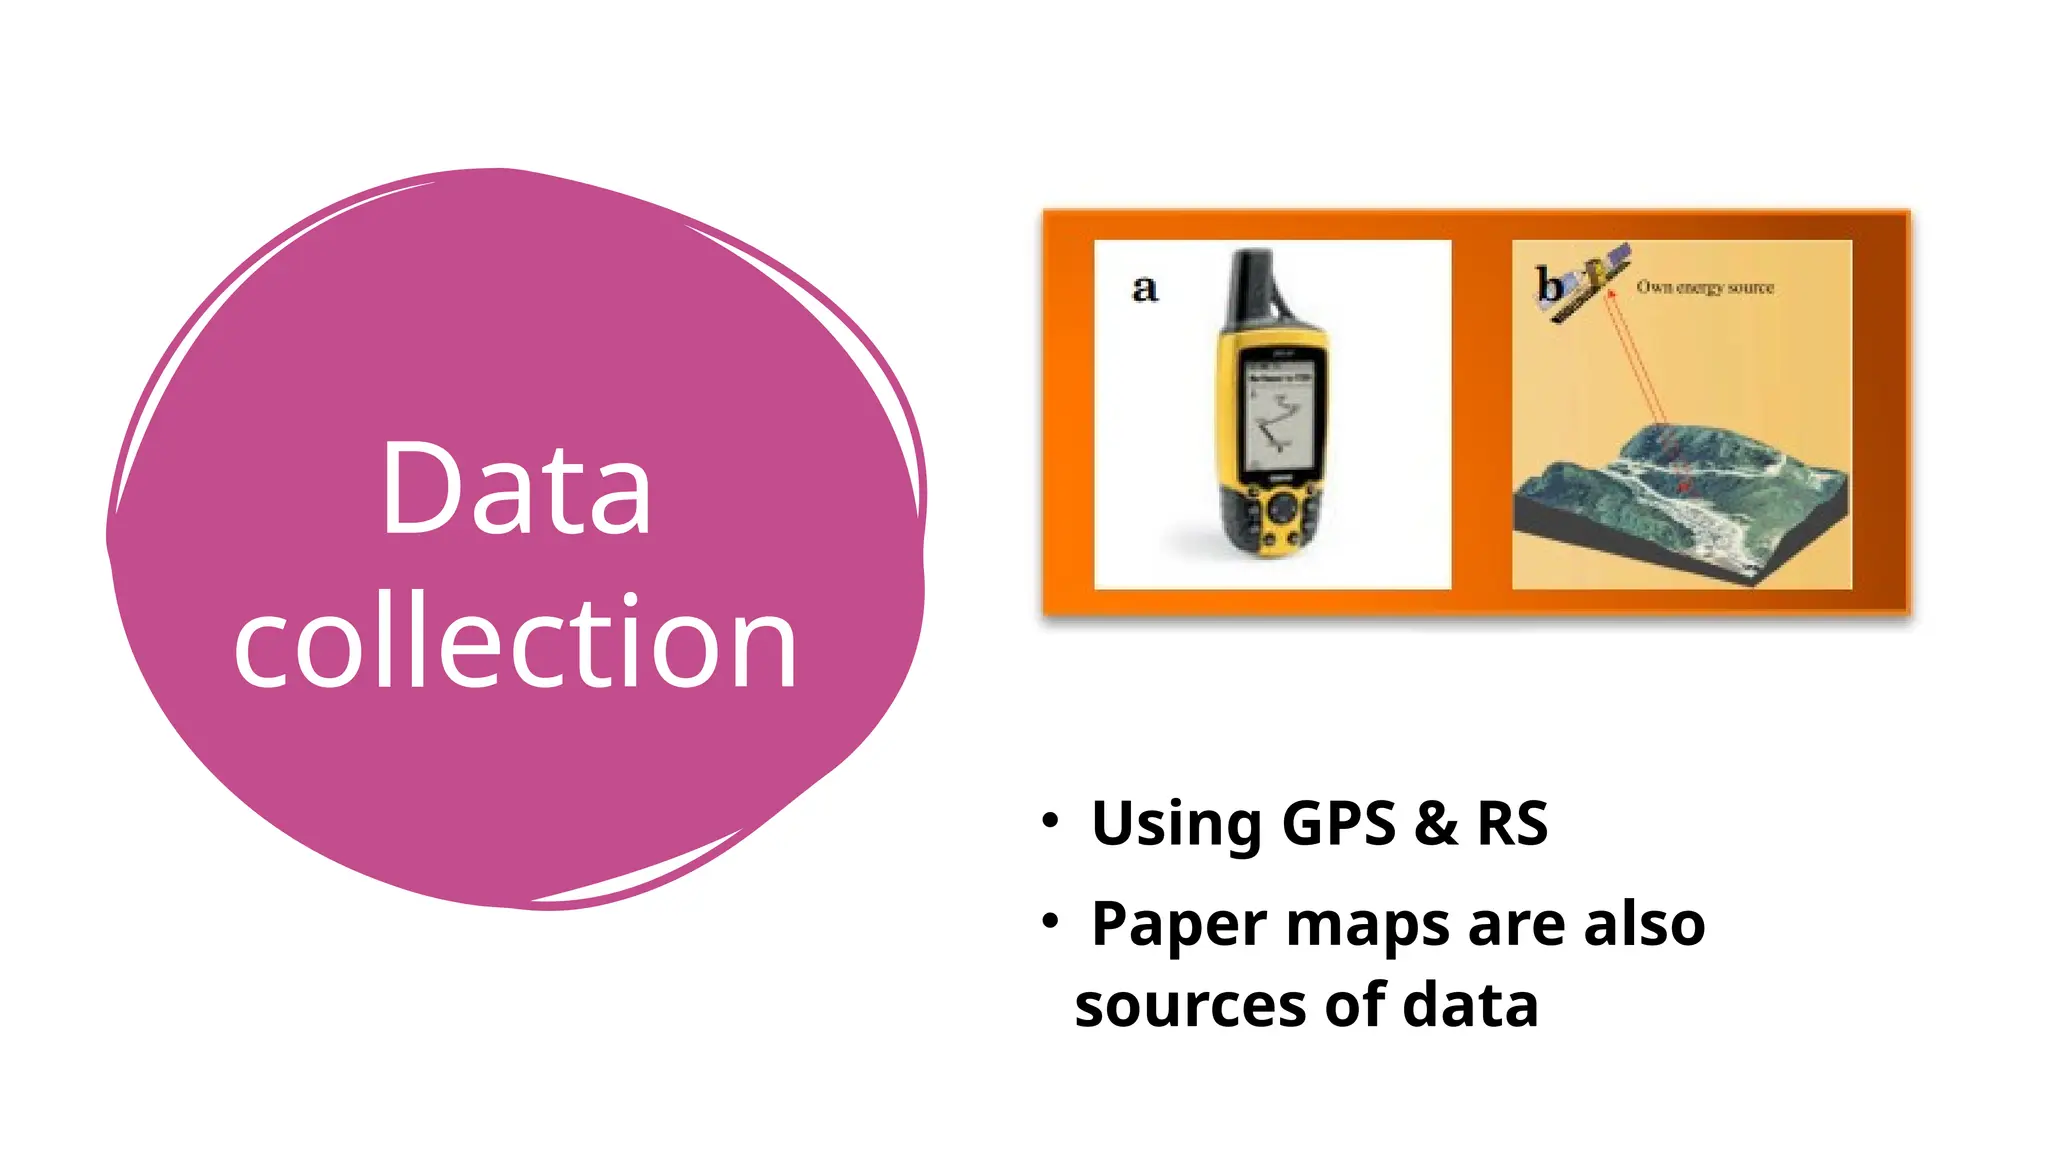
•Data collection
• Capture data
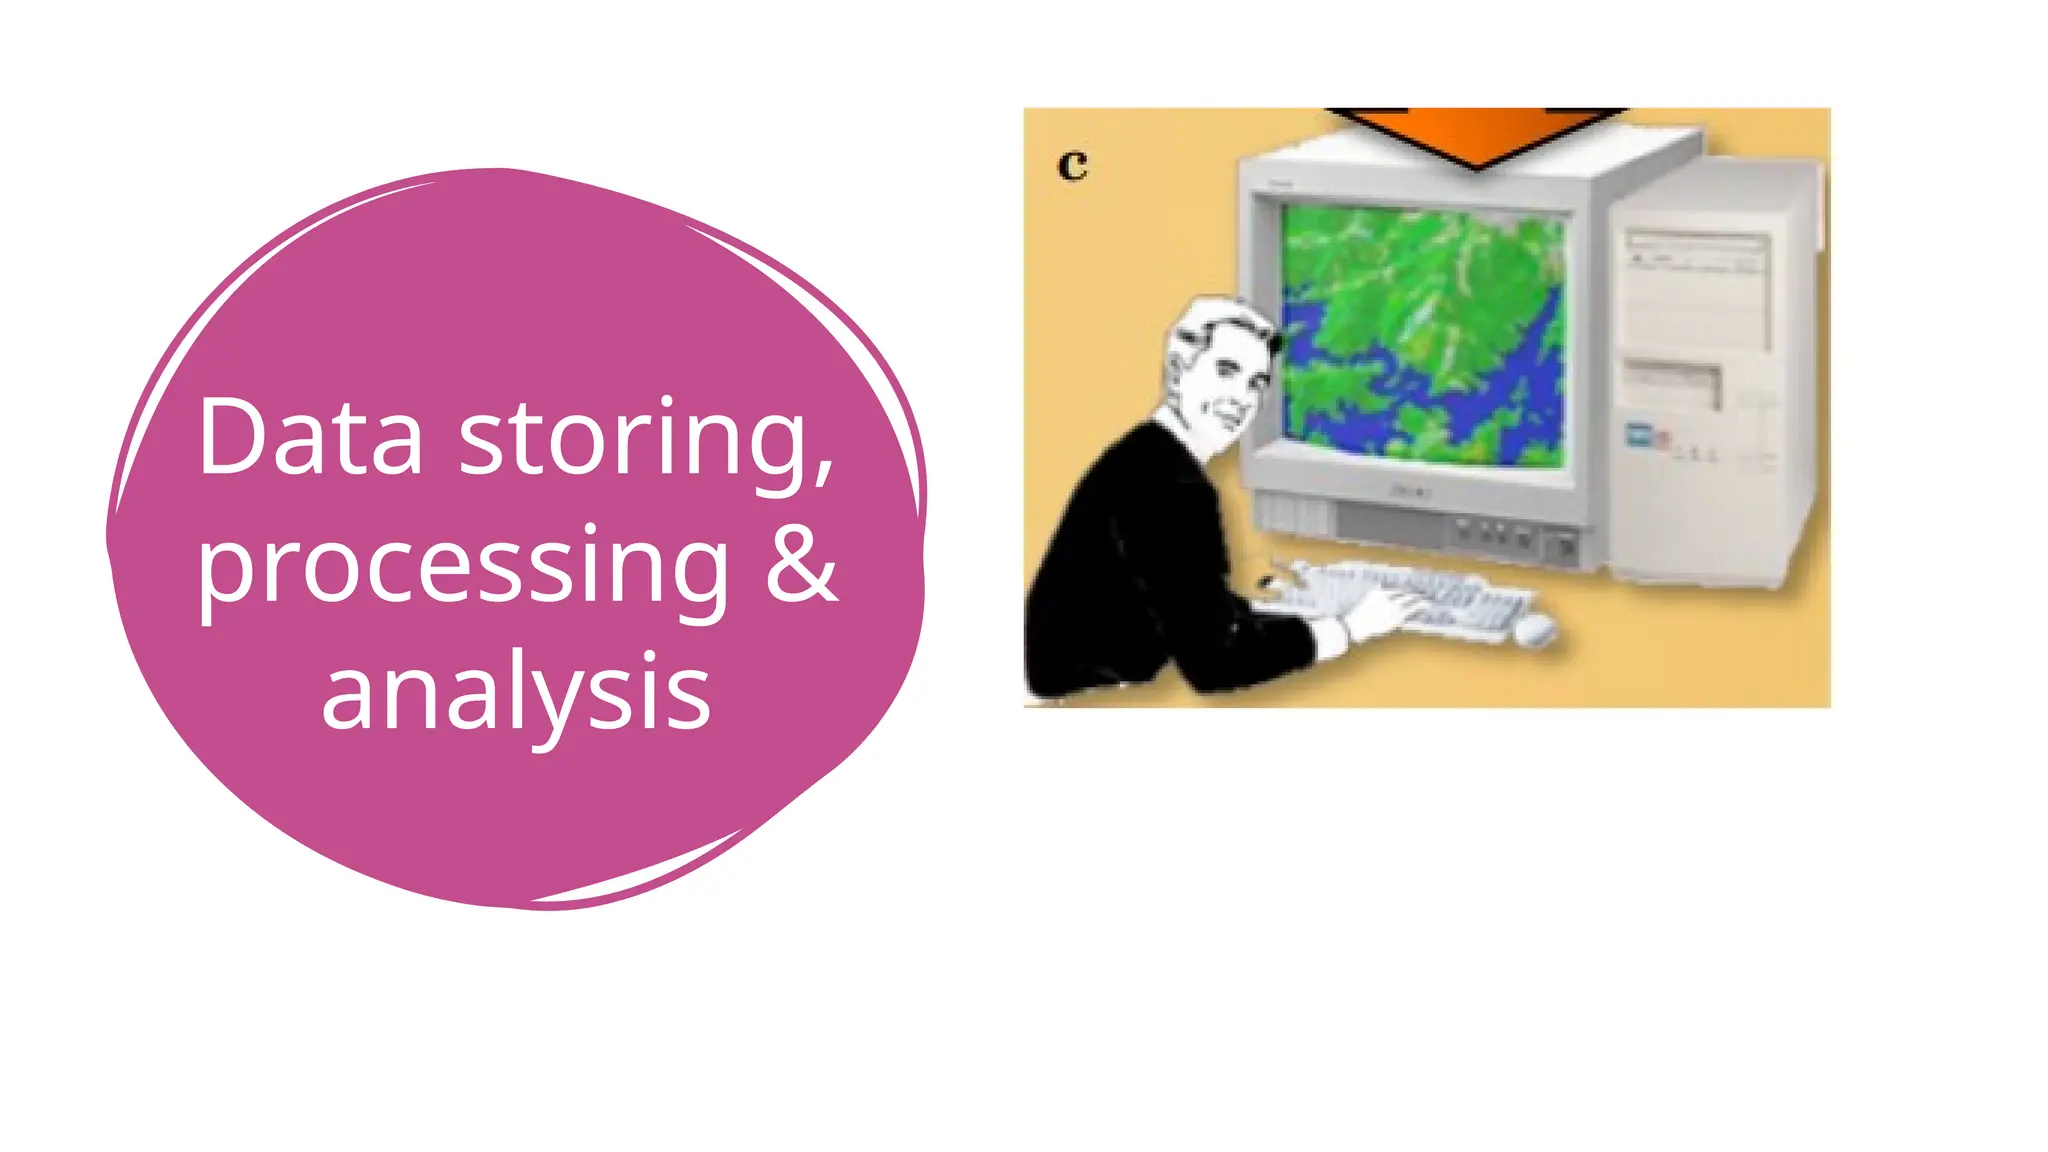
• Data storing, processing & analysis
• Store data ,Query data ,Analyze data
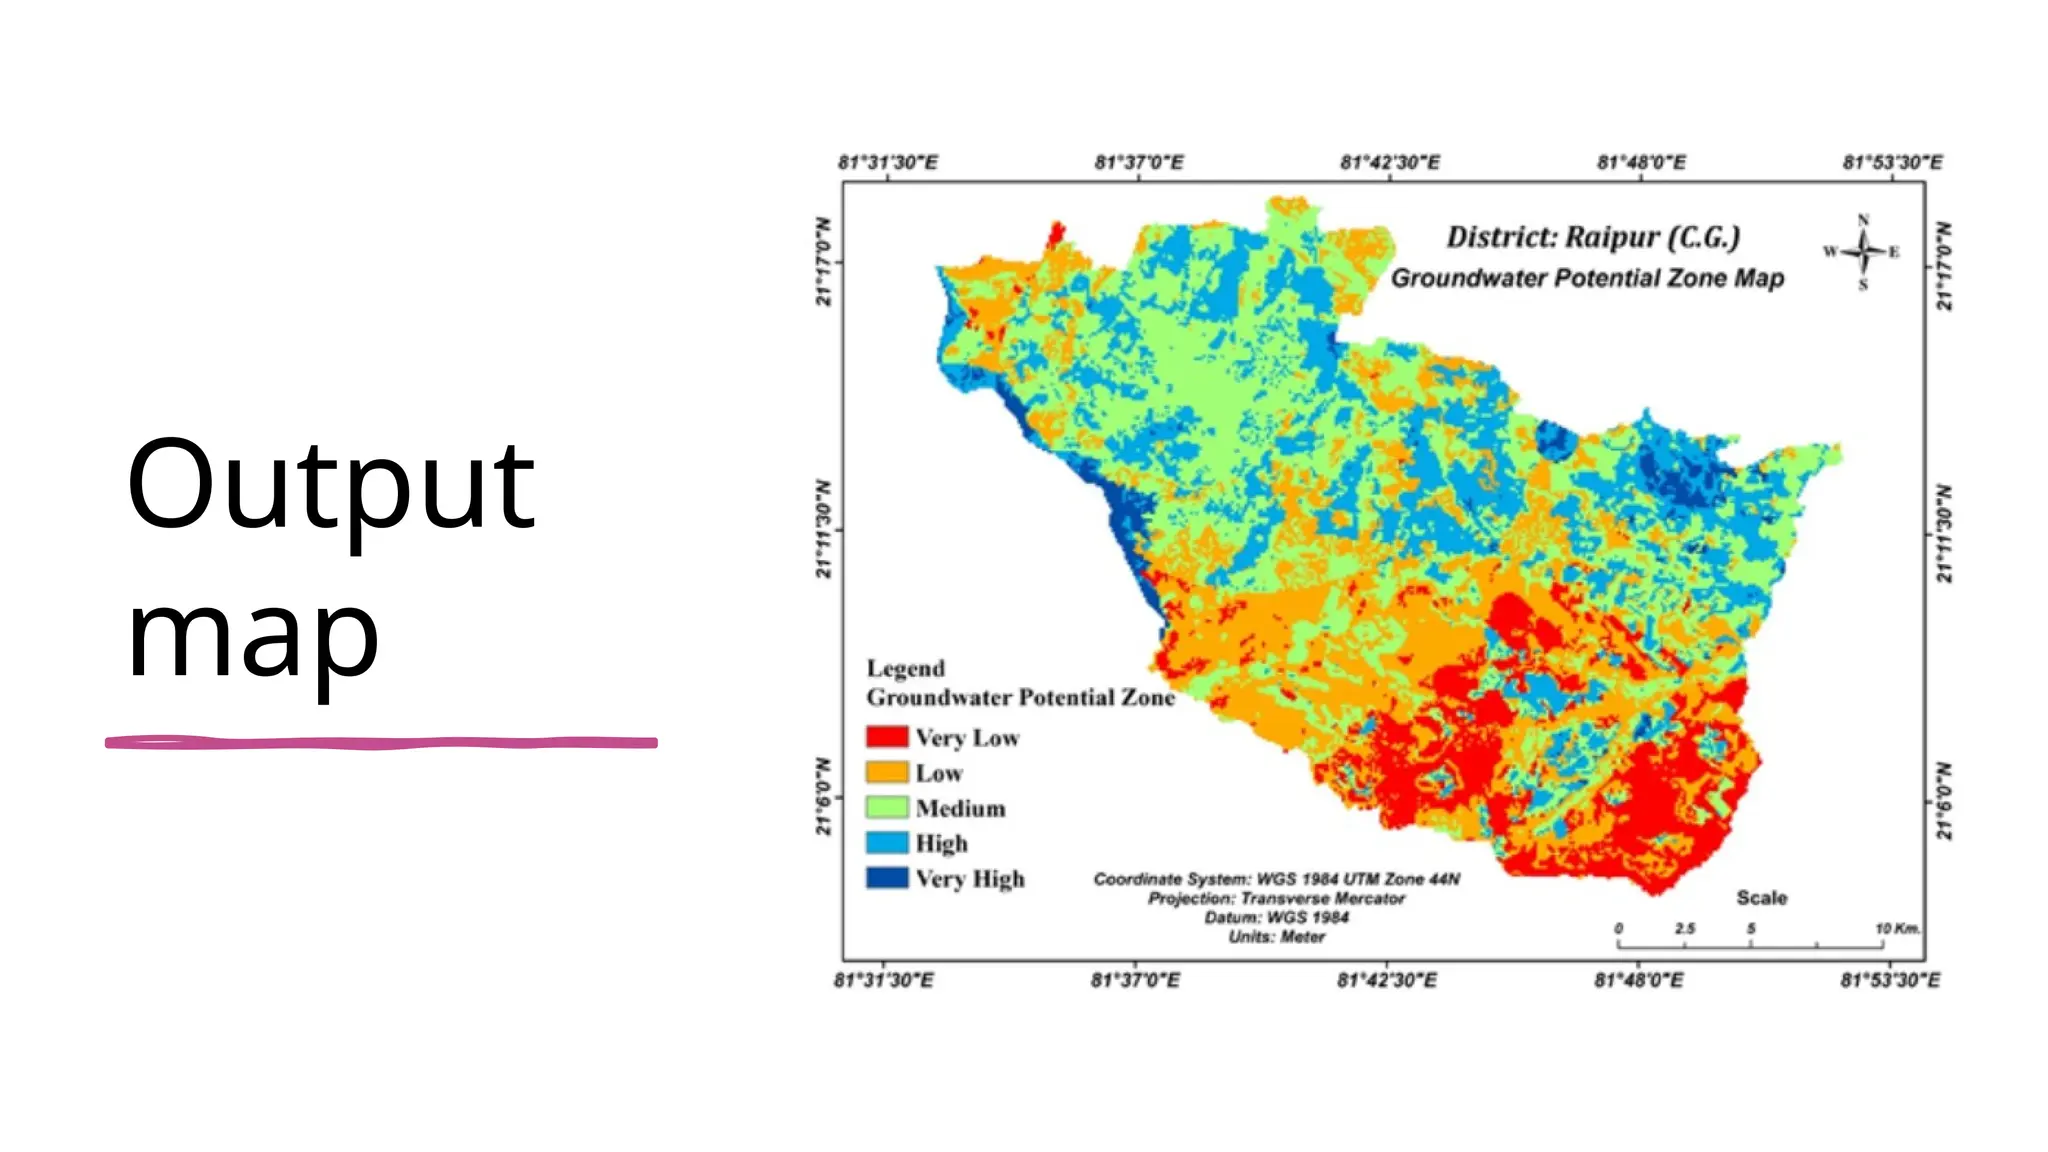
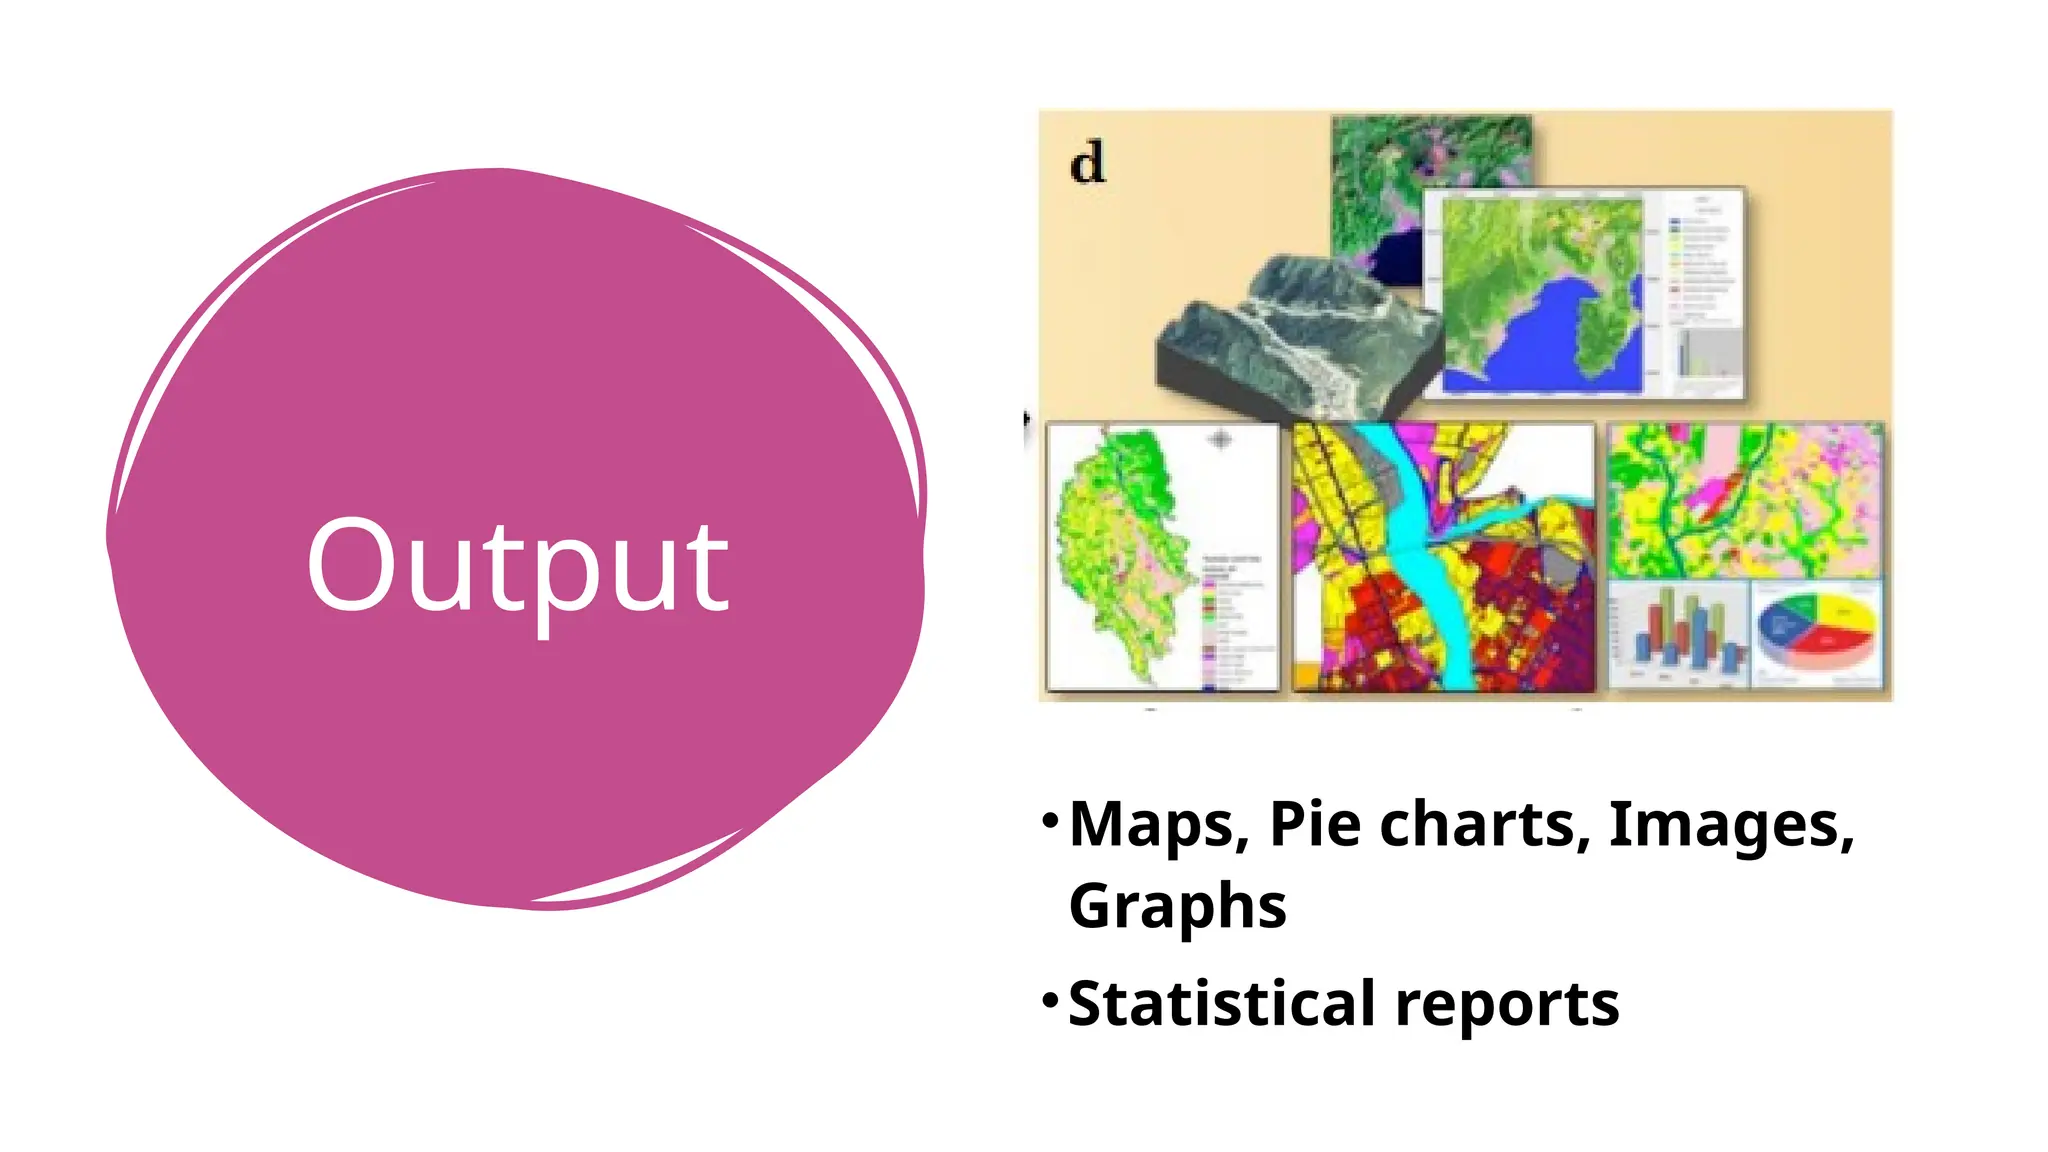
• Output production
• Display data
• Produce output
DEFINITIONS
AND
TERMINOLOG
Y USED INGIS
• Geographical Entity
• Entities are the things in the real
world
• Objects are the things in digital
world
•How do we
represent real world
entities in GIS?
61.
Geogra
phic
Entity
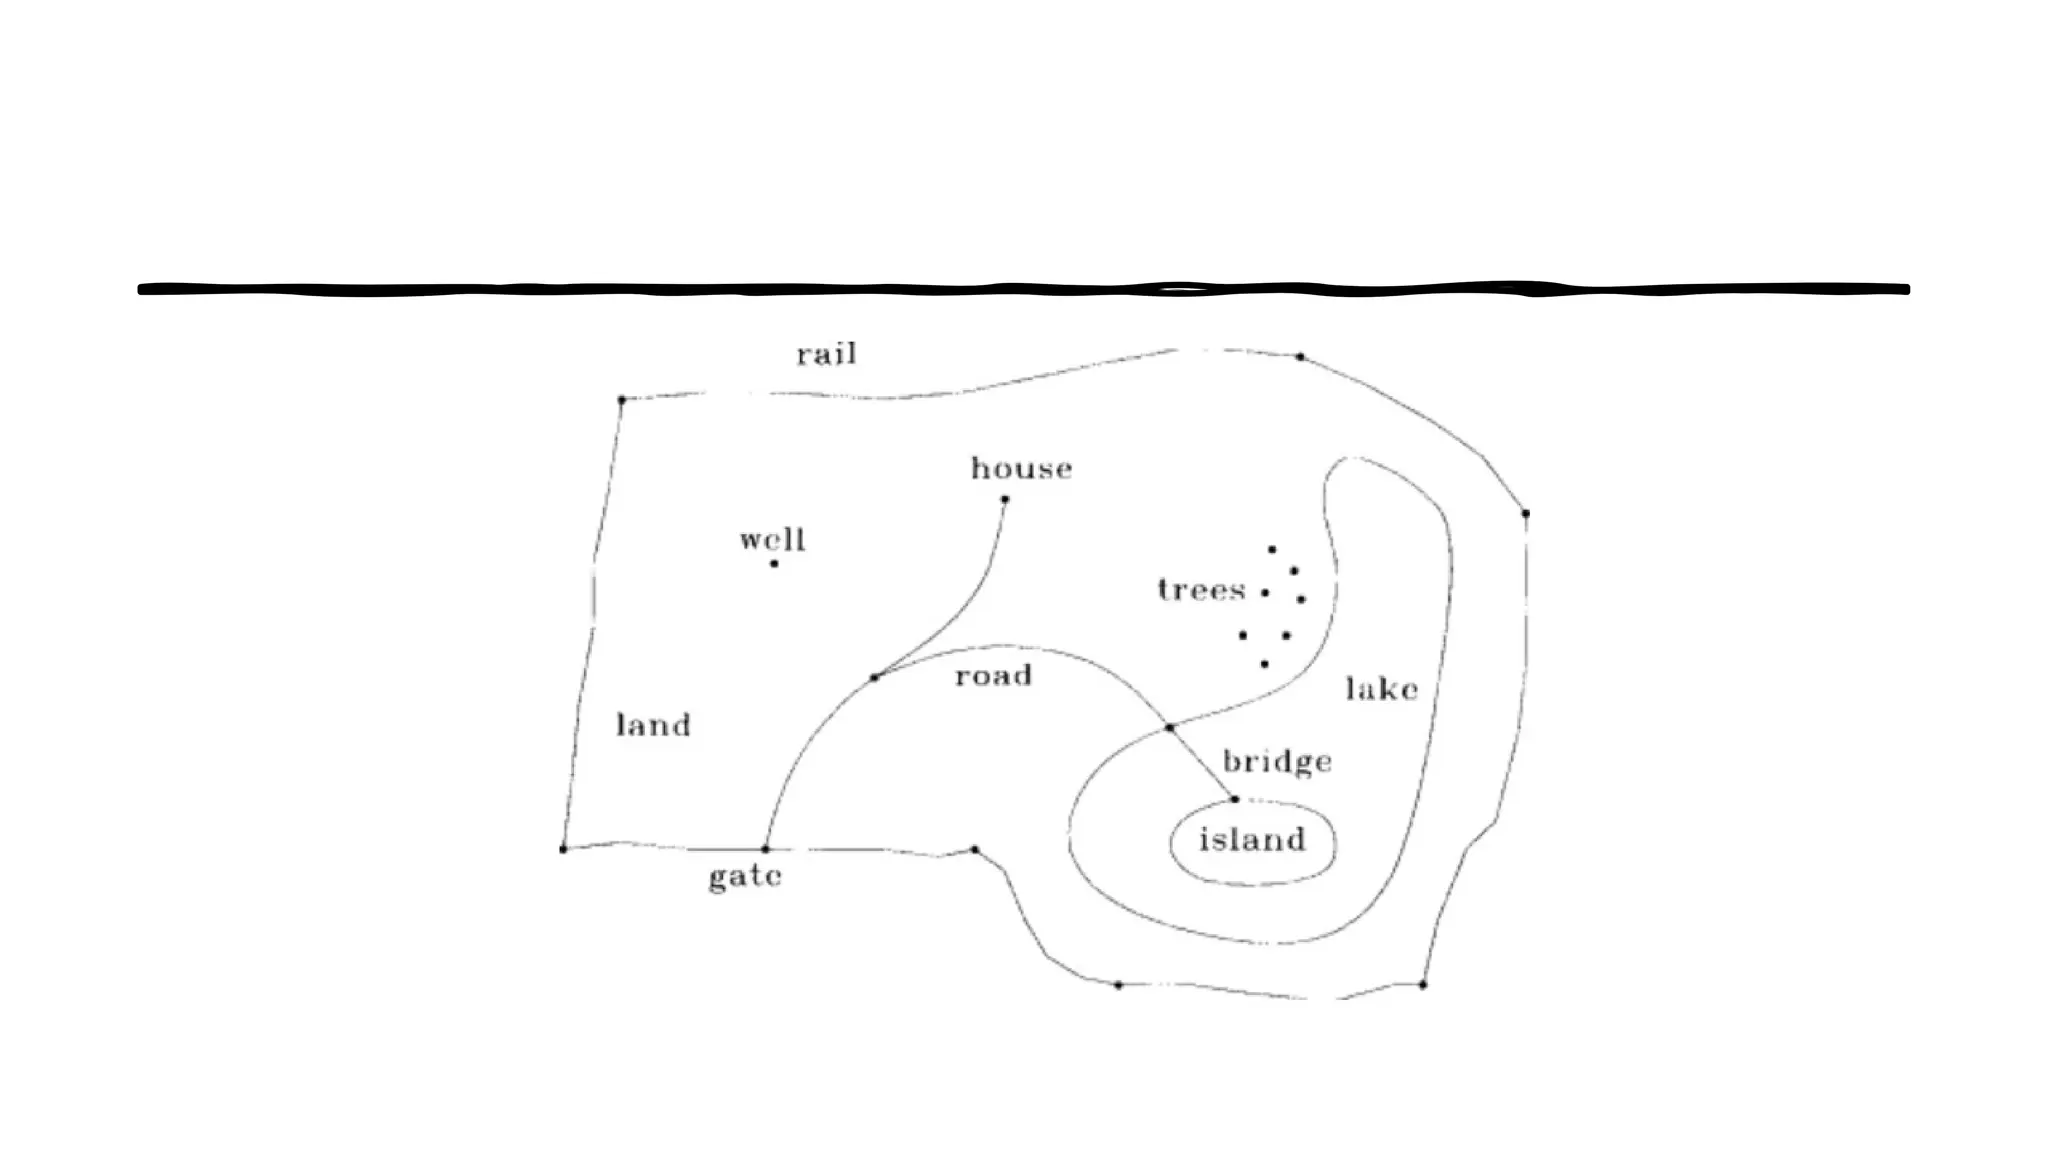
• Real worldgeographic entities are
represented in the form of objects
(point/ line/polygon) having
spatial data and attribute data.
• Spatial data means representing
the location of the
object(Lattitude, longitude,
Elevation)
• Attribute data is the additional
data associated with the object
other than location. It may be a
text, numerical value etc.
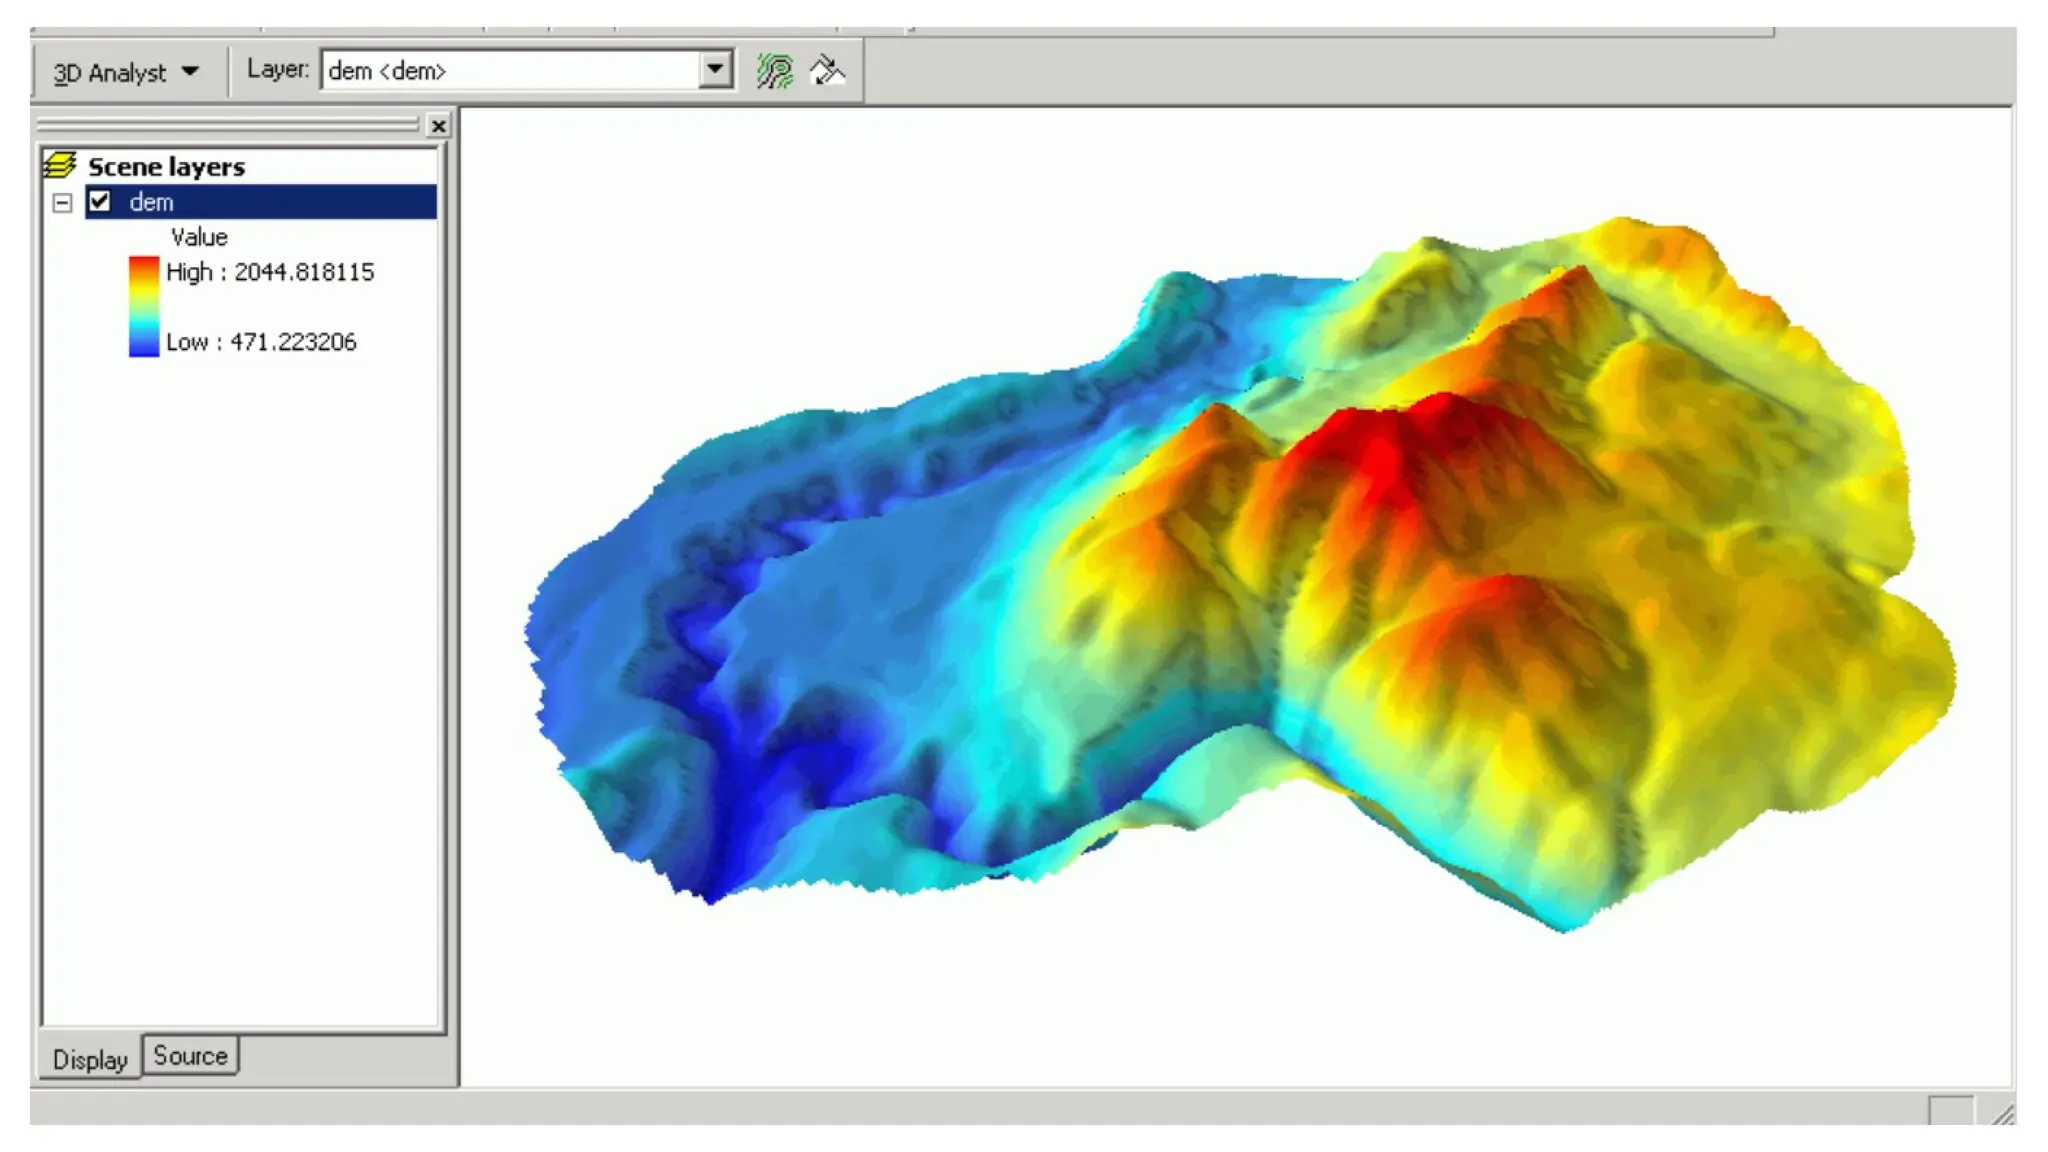
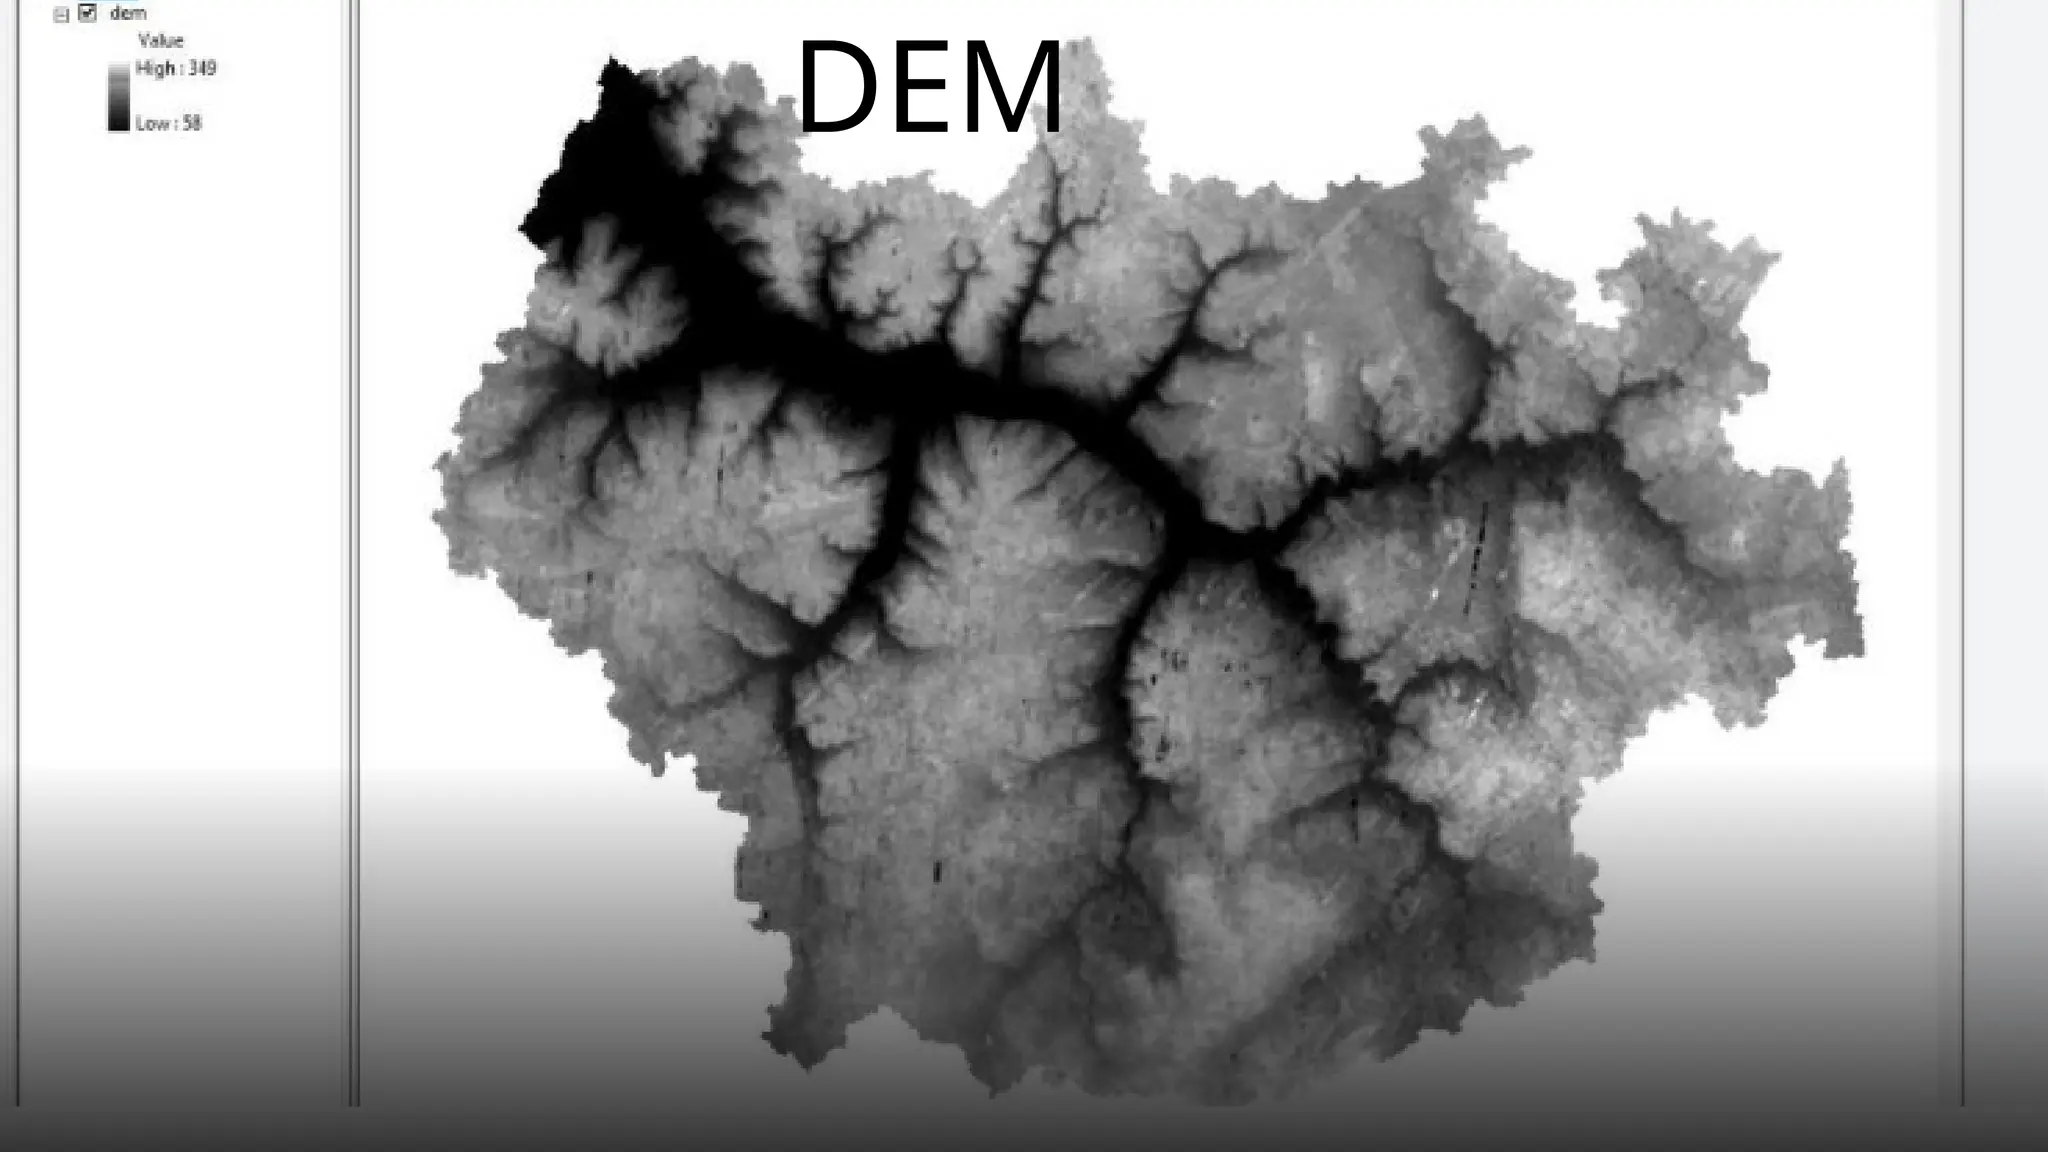
Digital Elevation Model(DEM)
• Simplest form of digital elevation of topography.
• Digital representation of elevation of earth.
• It gives elevation, slope , aspect.
• Where would be use DEM????
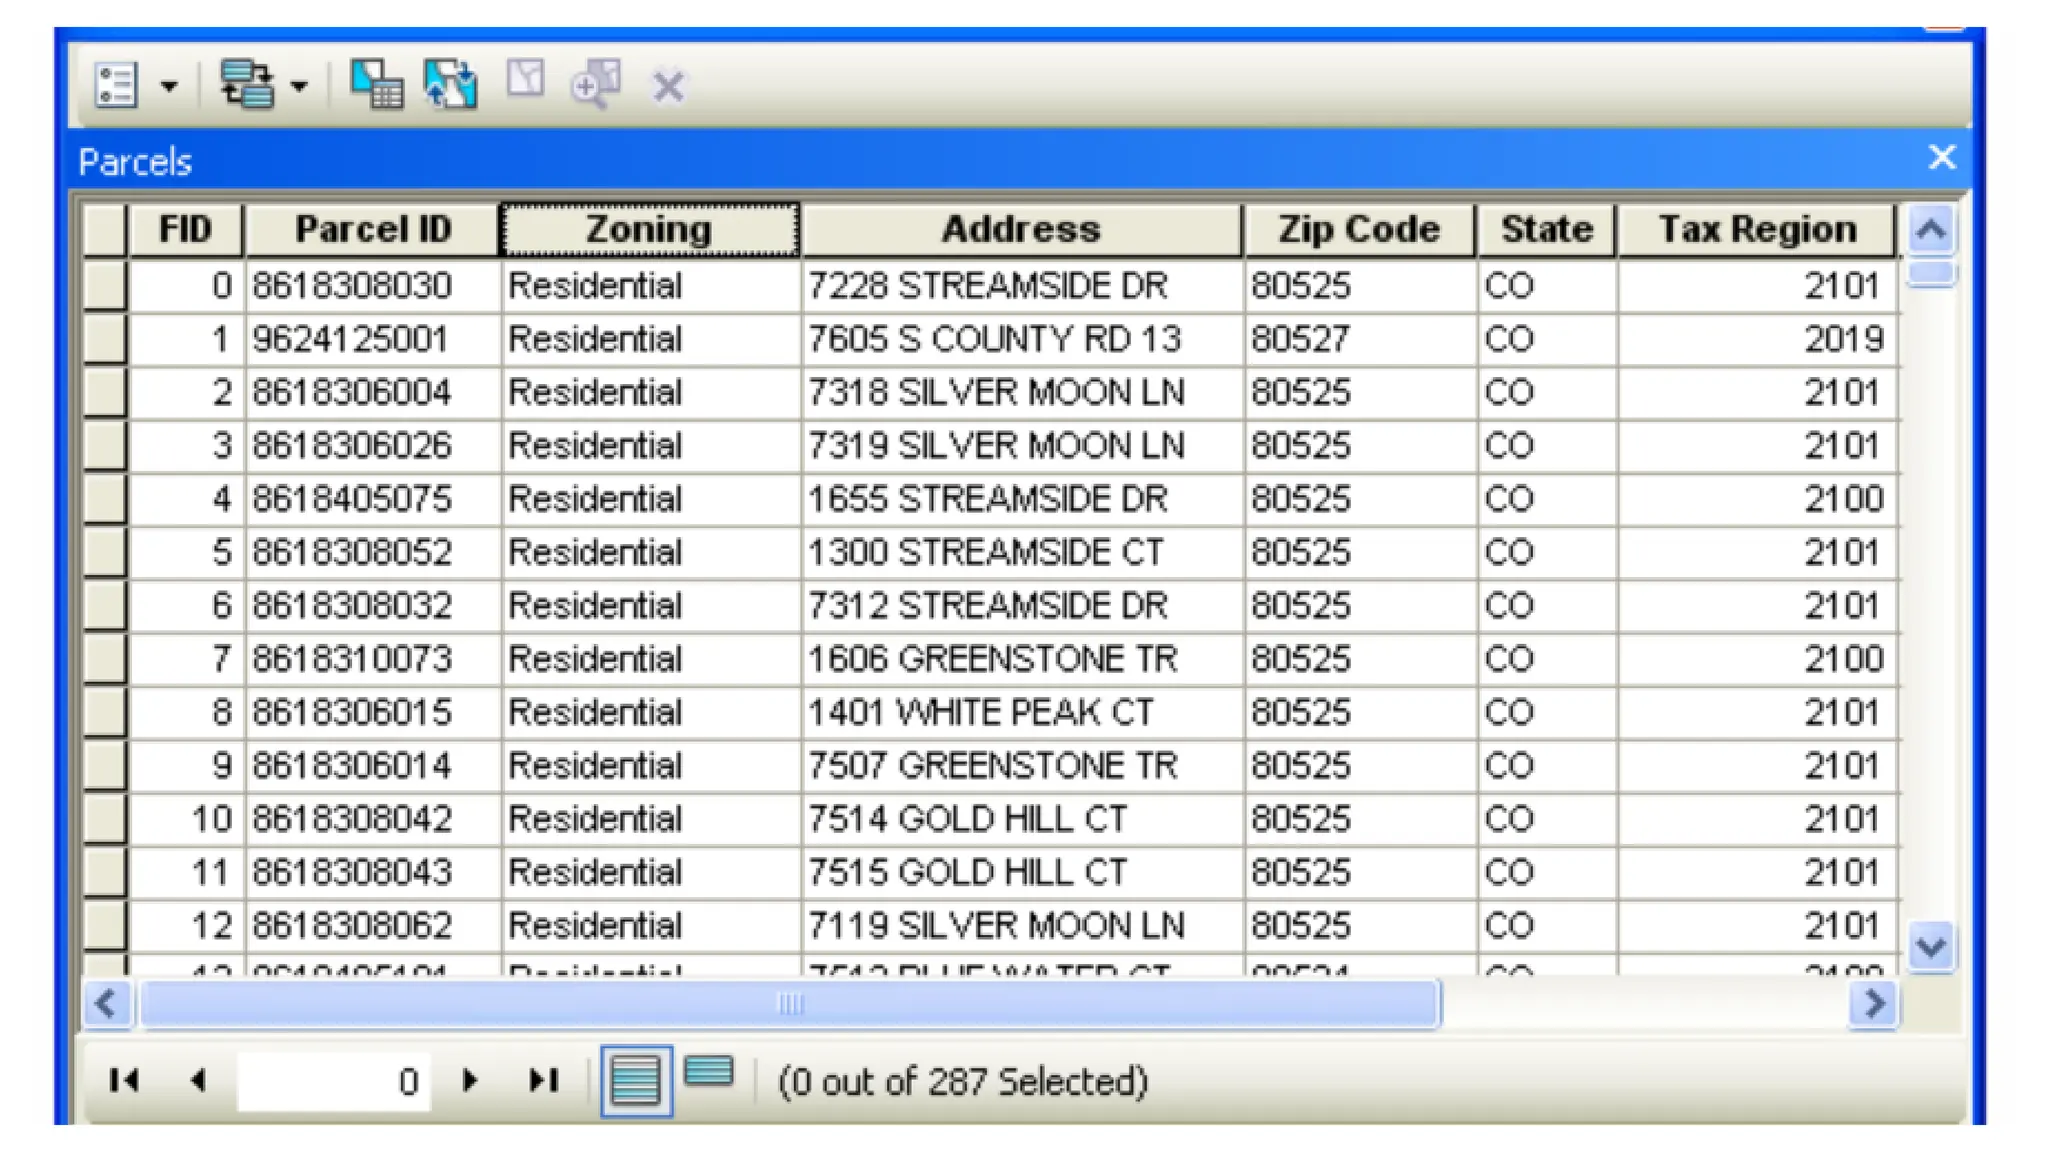
Attributes
• Attributes arethe characteristics of the map features.
• Hold the descriptive information about the geographic
features.
• Attributes are the non-spatial data(location is not
attched to them direcly) .They are considered
characteristics of entity ..
• Also feed the information in the tabular form in GIS
72.
Attributes
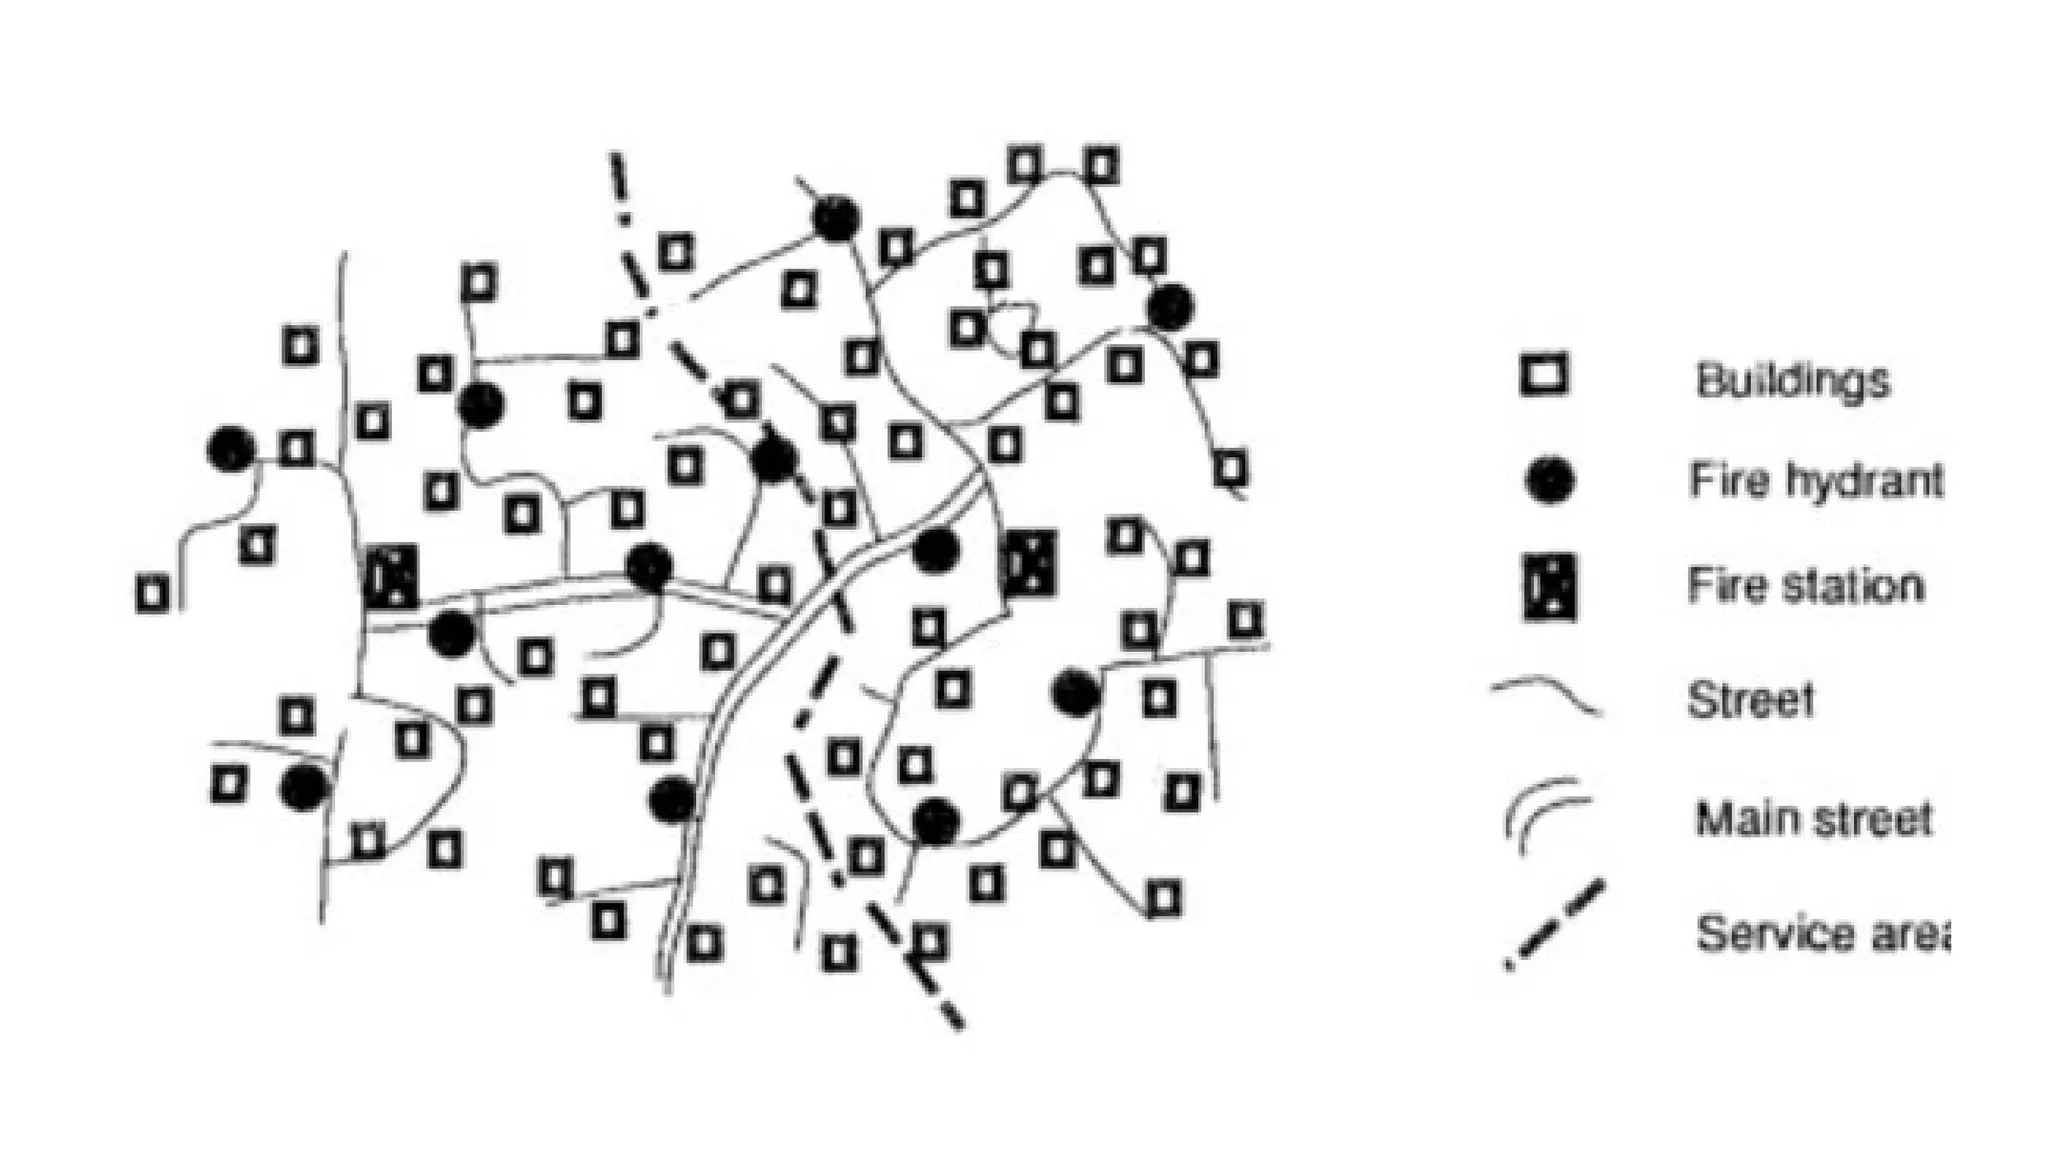
• A pointrepresents a hotel, a line represents the road
and area represents the boundaries of the lake.
• Each spatial entity may have more than one
attribute associated with it , that is, a point
representing the hotel may have a number of rooms,
standard of accommodation and other related info.
75.
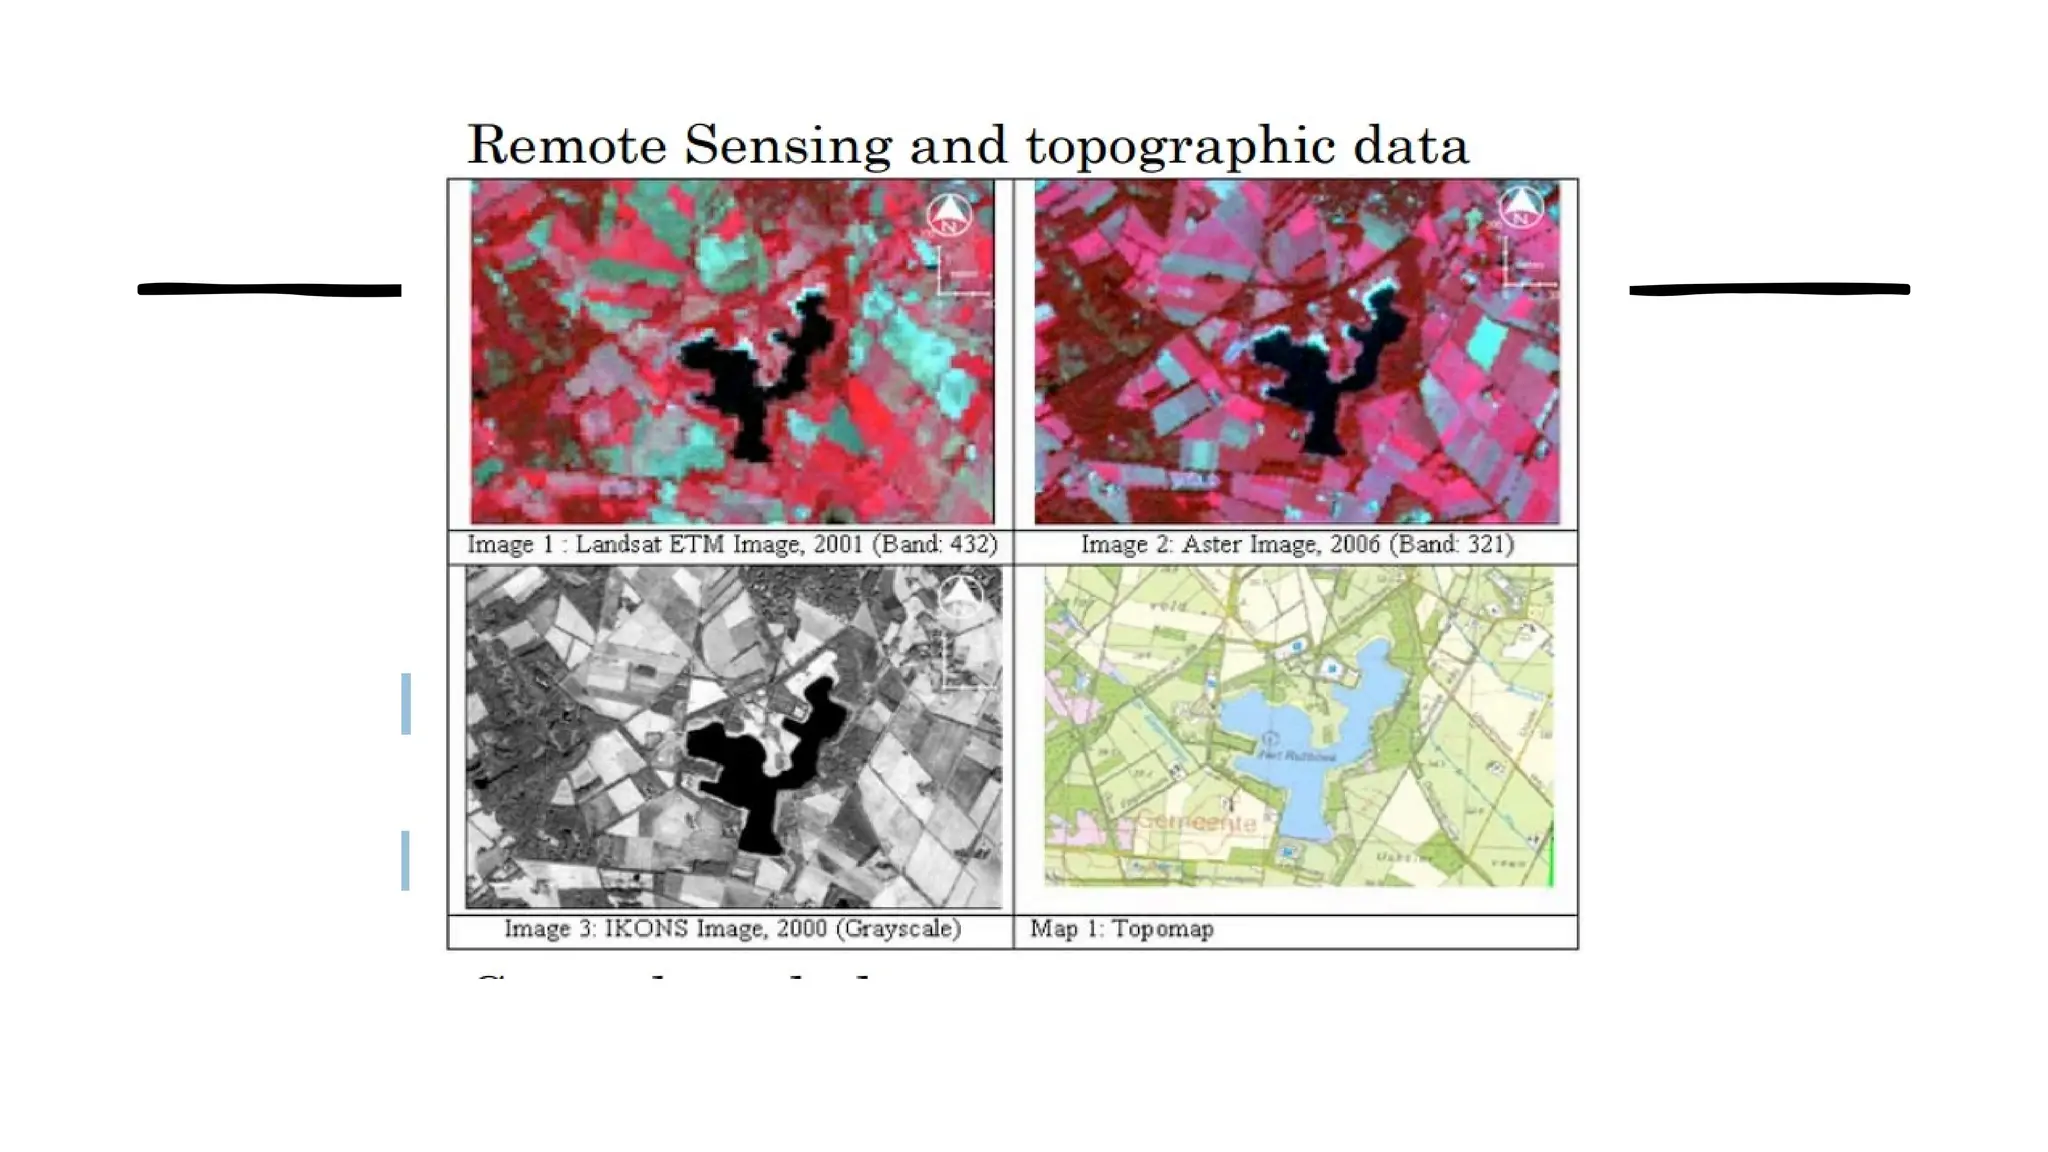
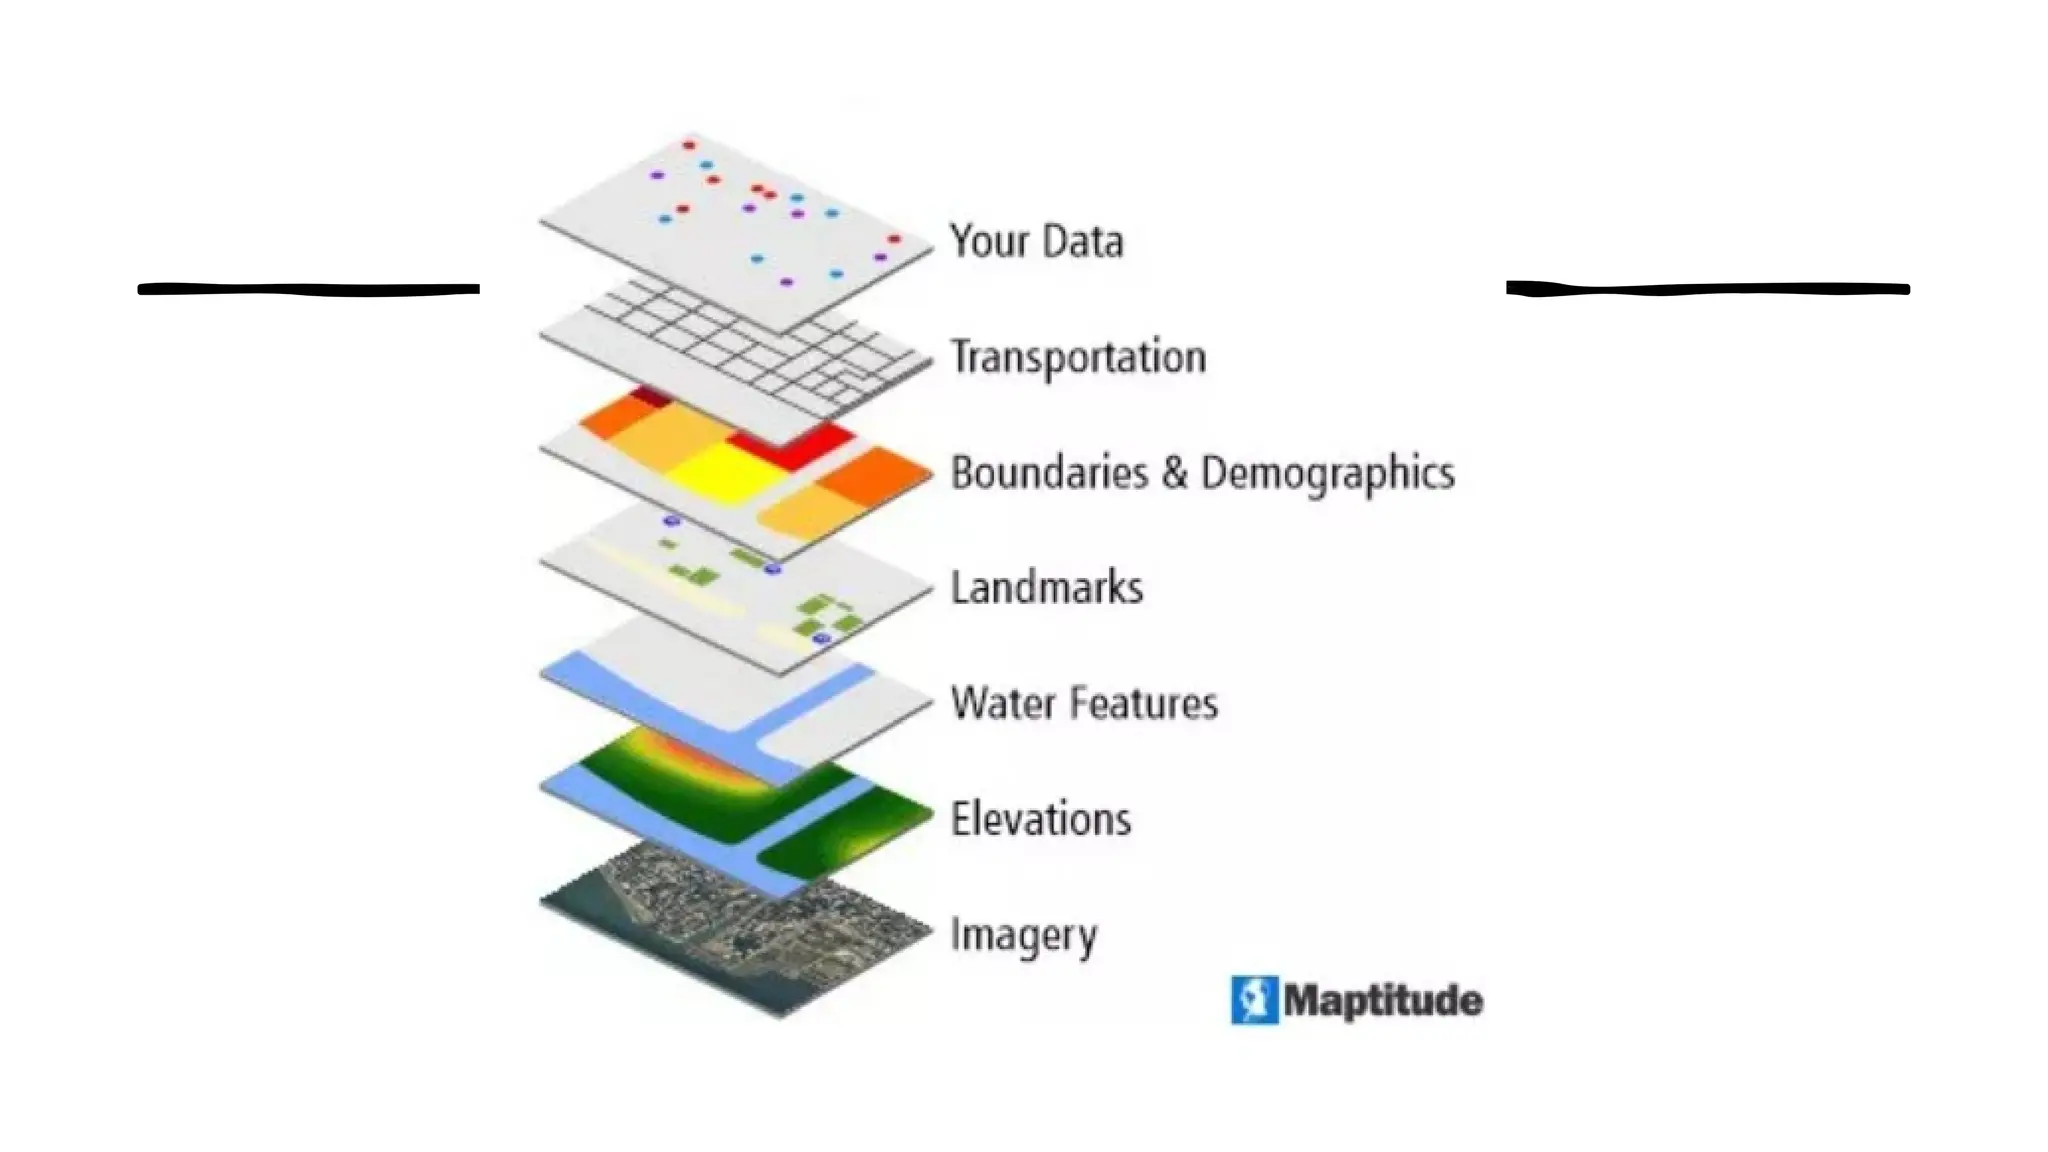
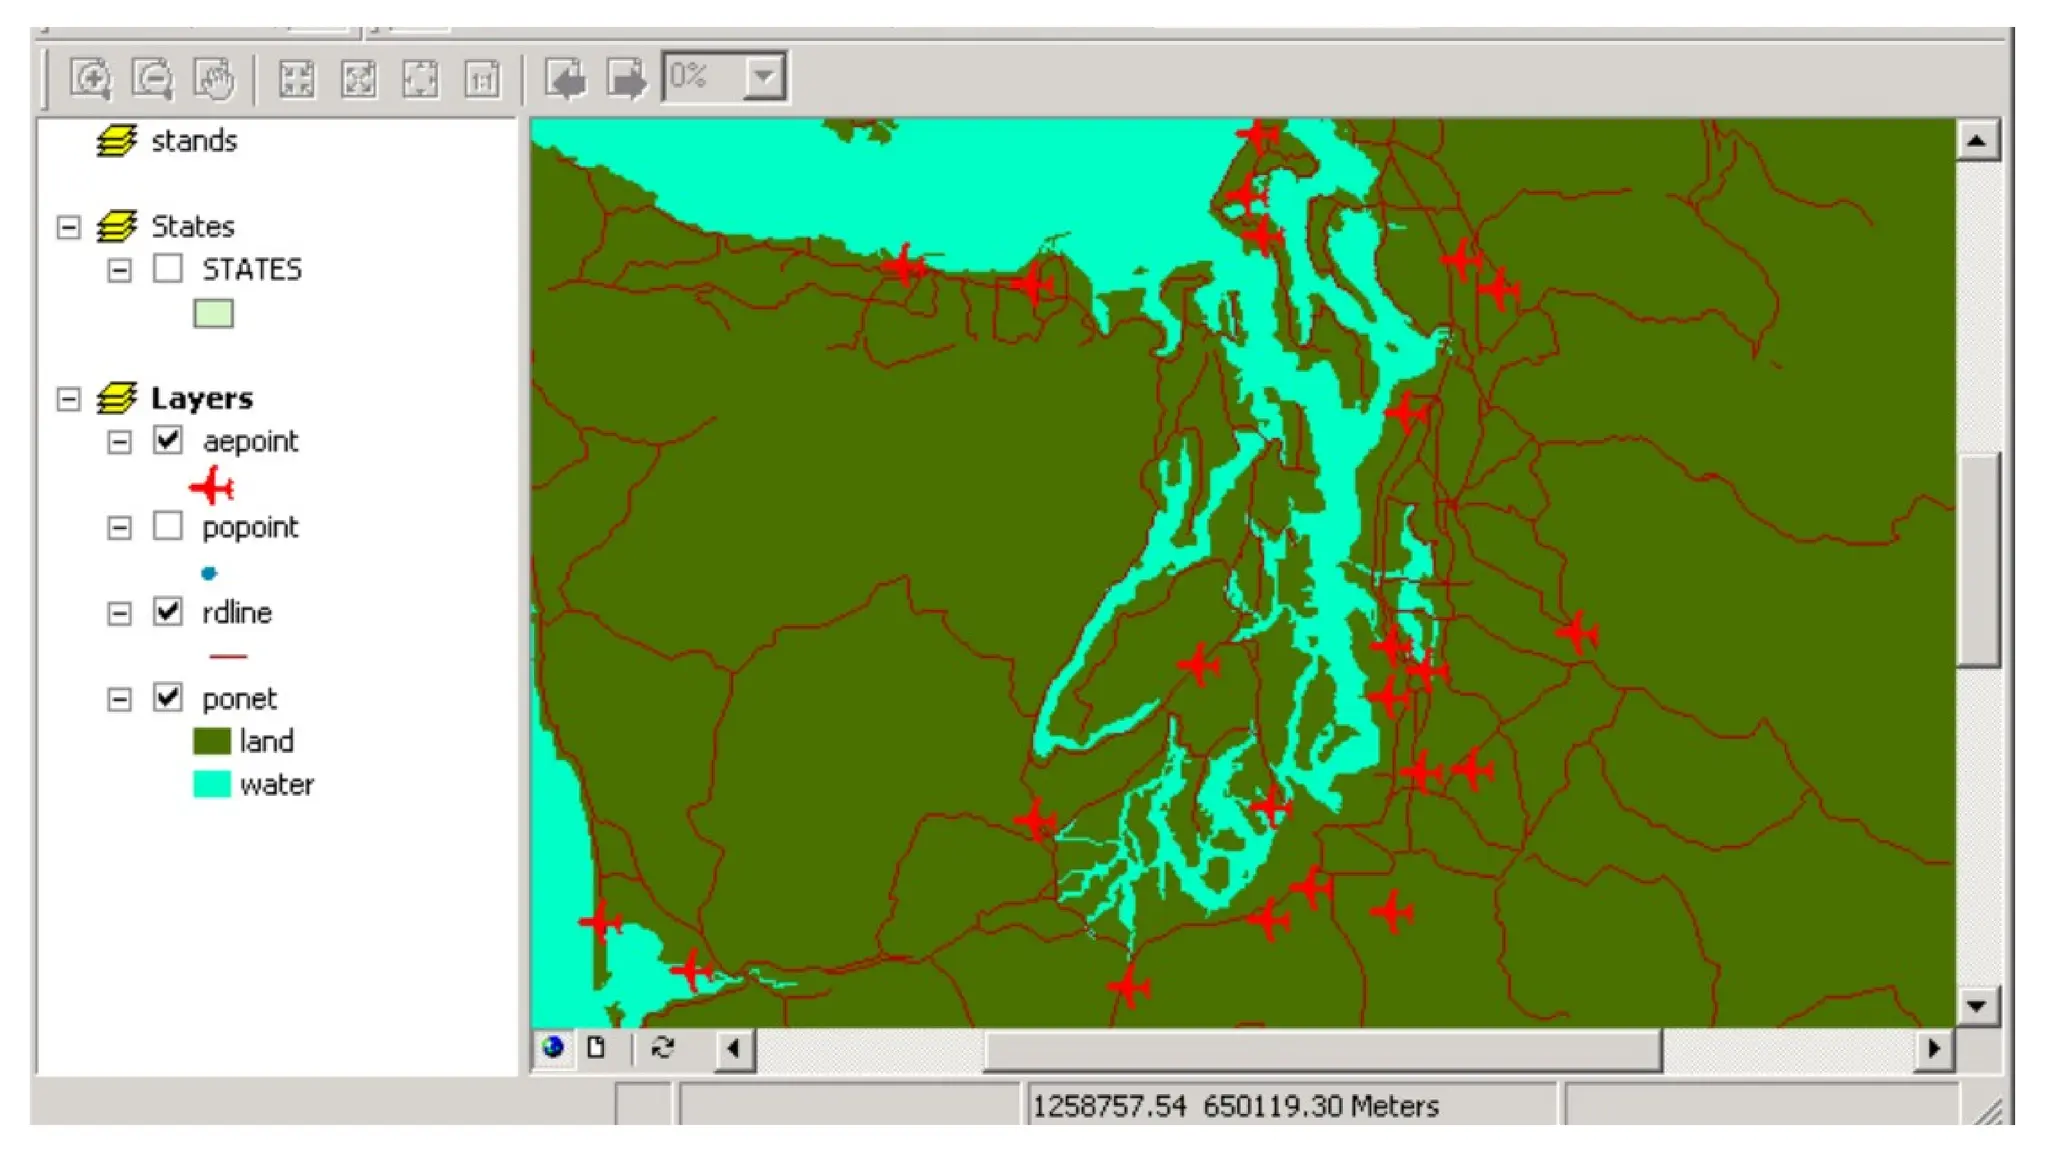
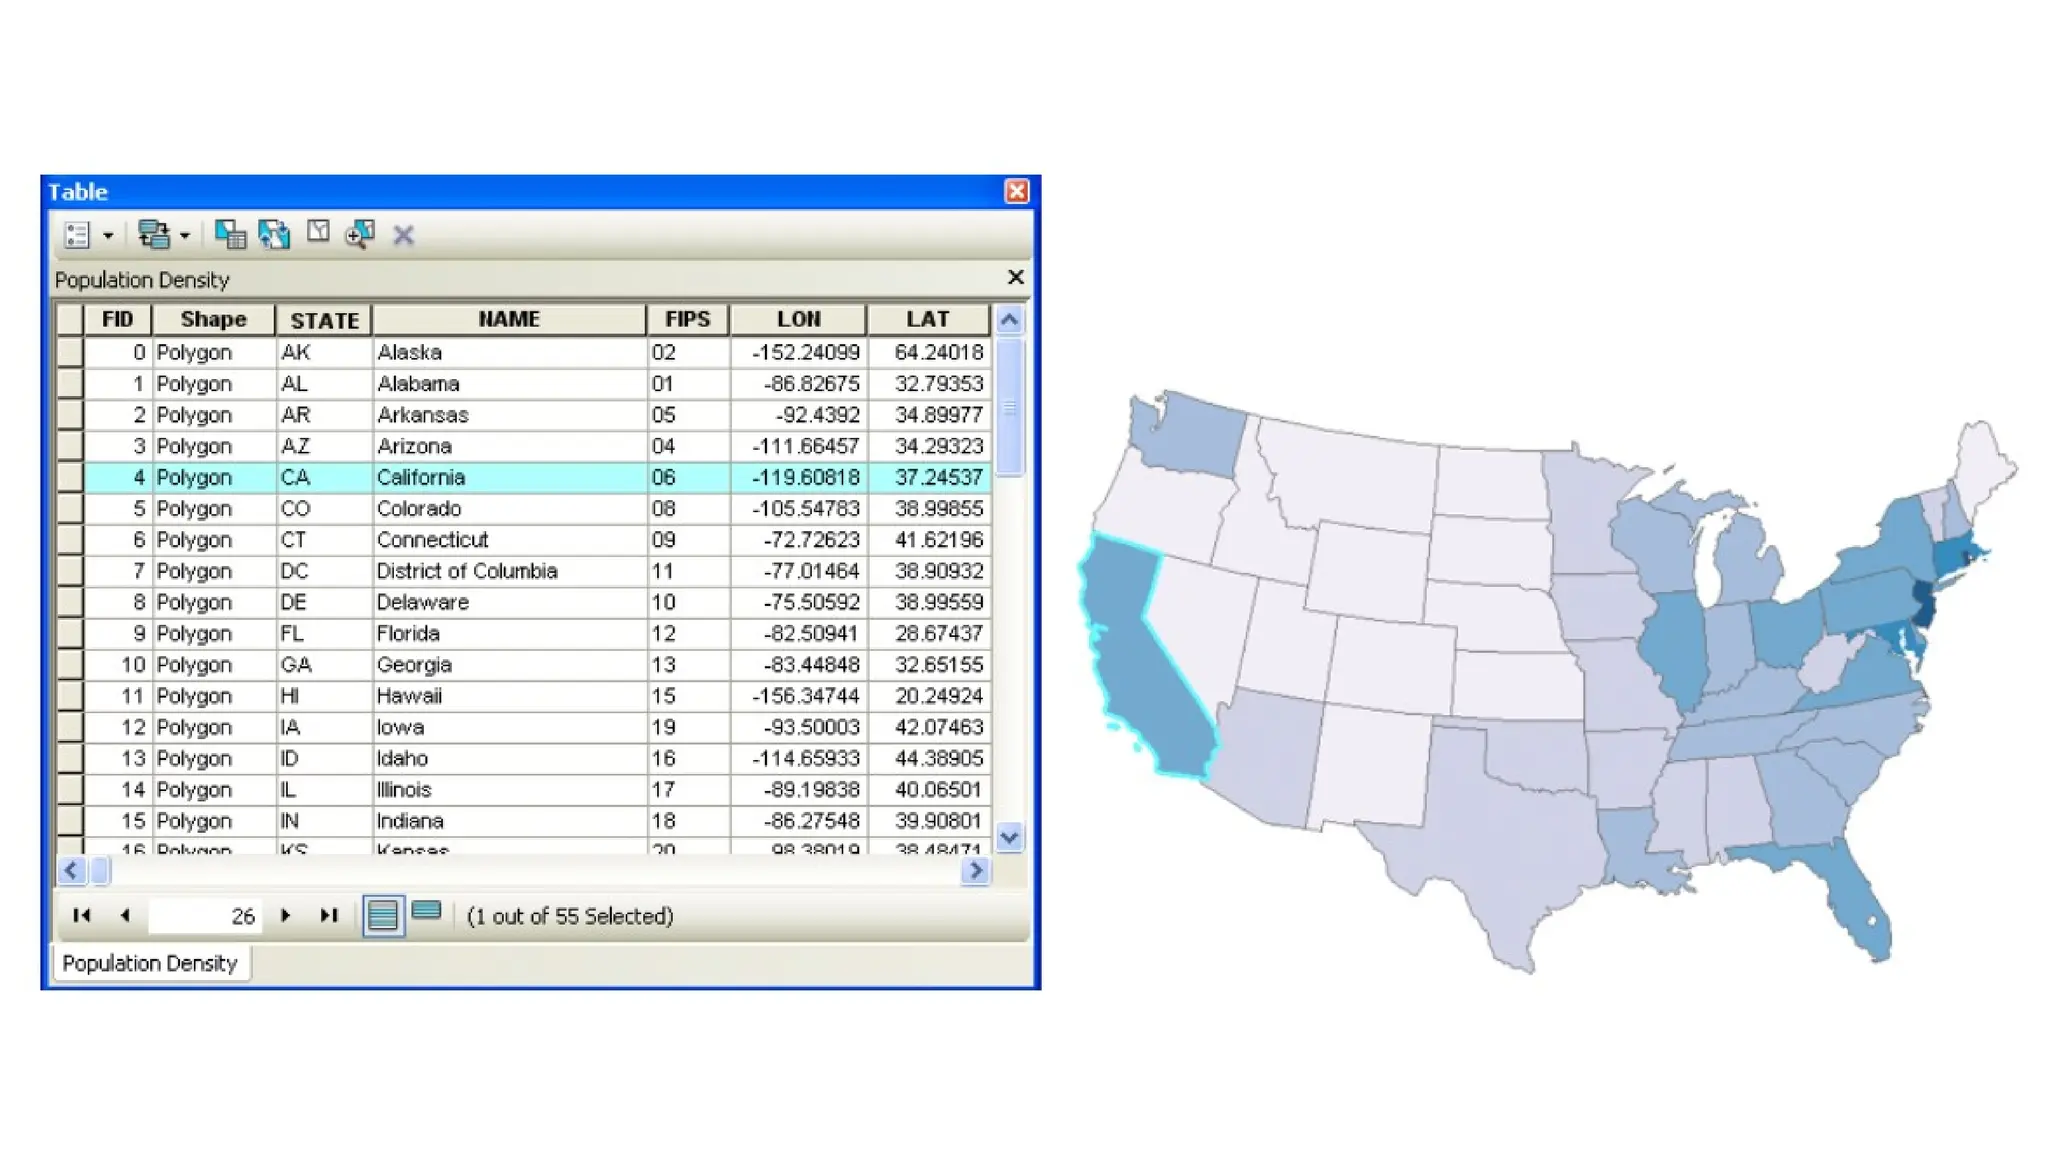
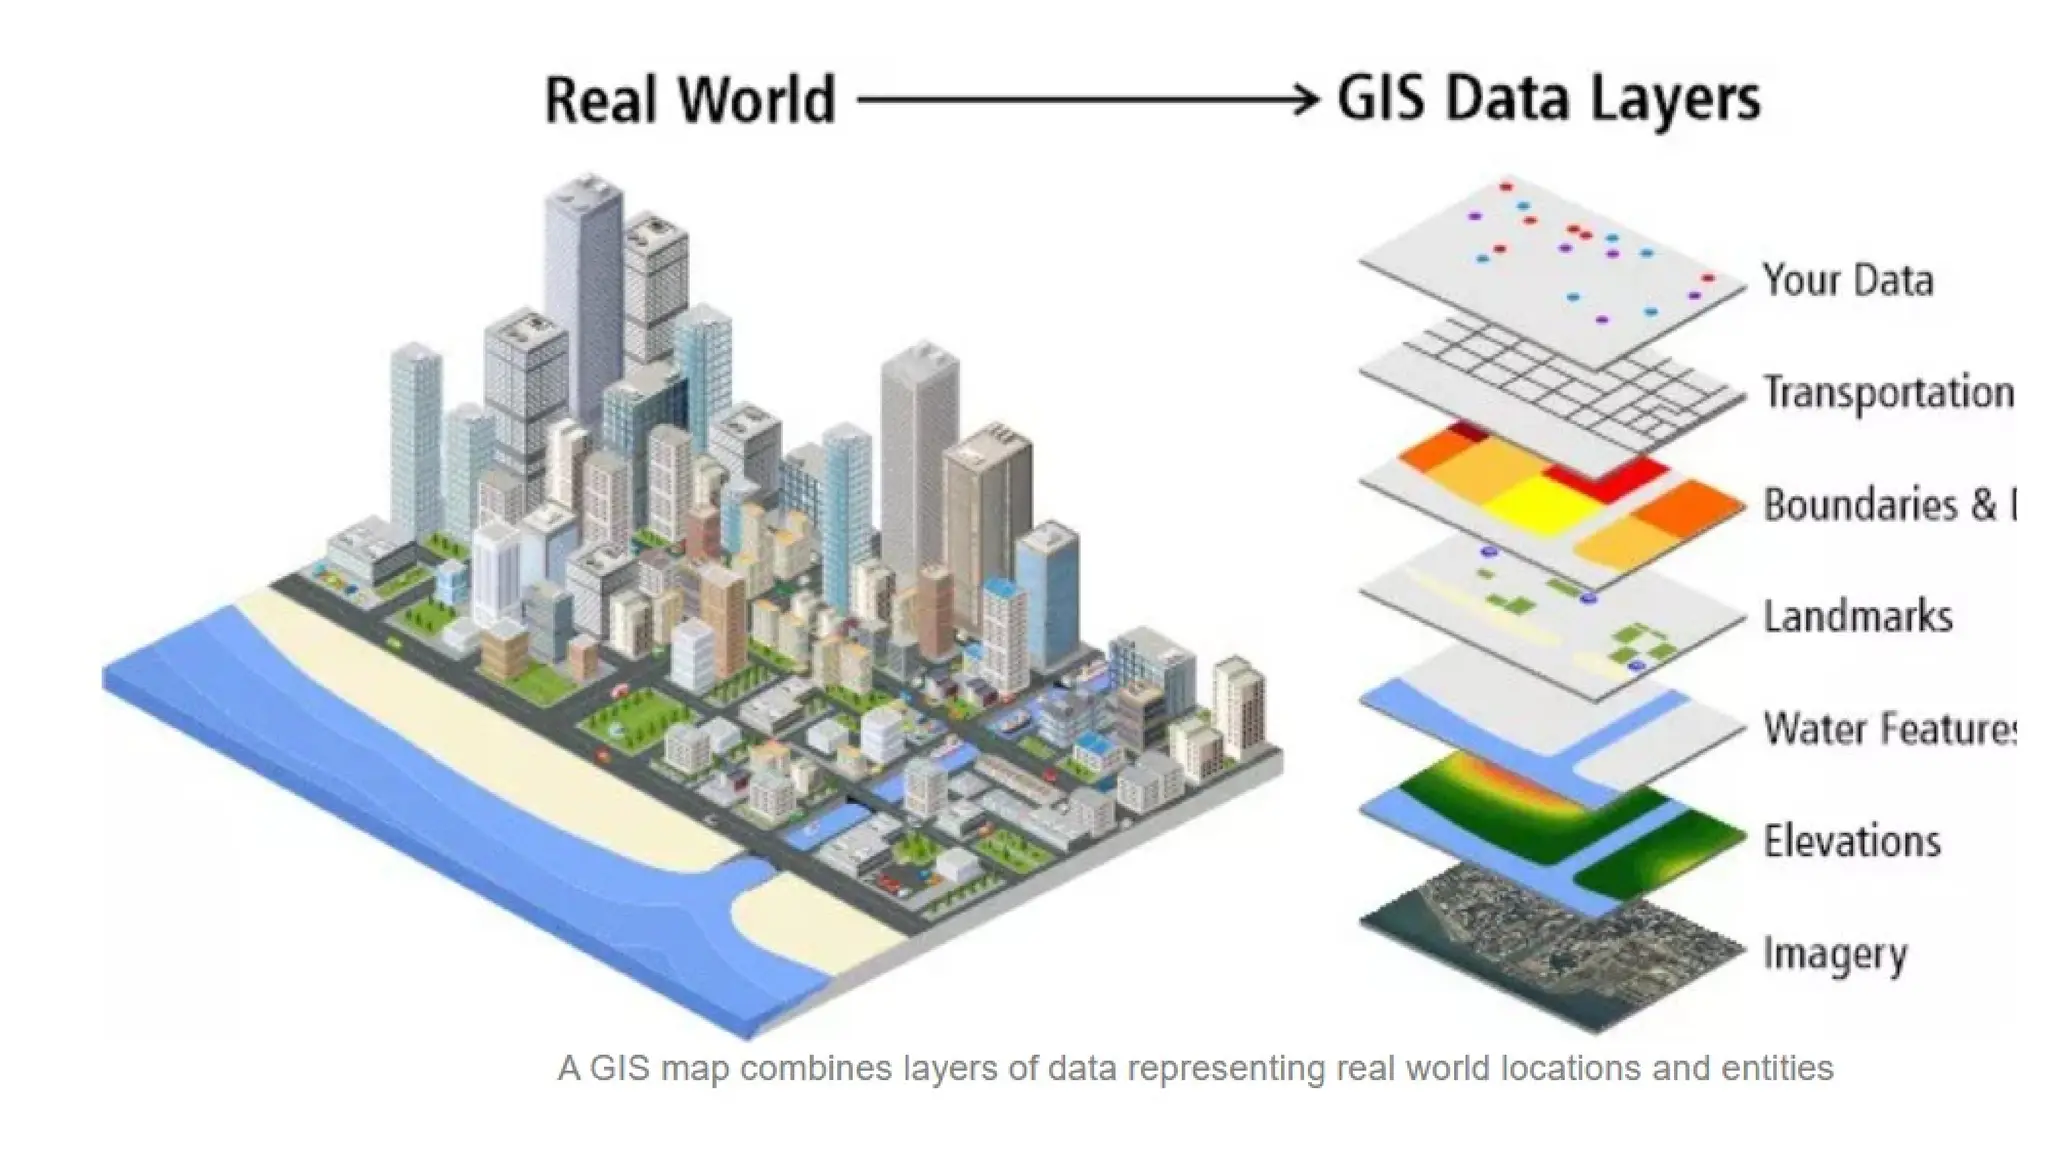
Layer
• The visualrepresentation of a geographic dataset
in any digital map.
• Data in a layer is represented with points, lines,
shapes (polygons), or surfaces.
•Layer can be a satellite image as well.
• Maps in a Geographic Information System are
made by combining multiple layers
77.
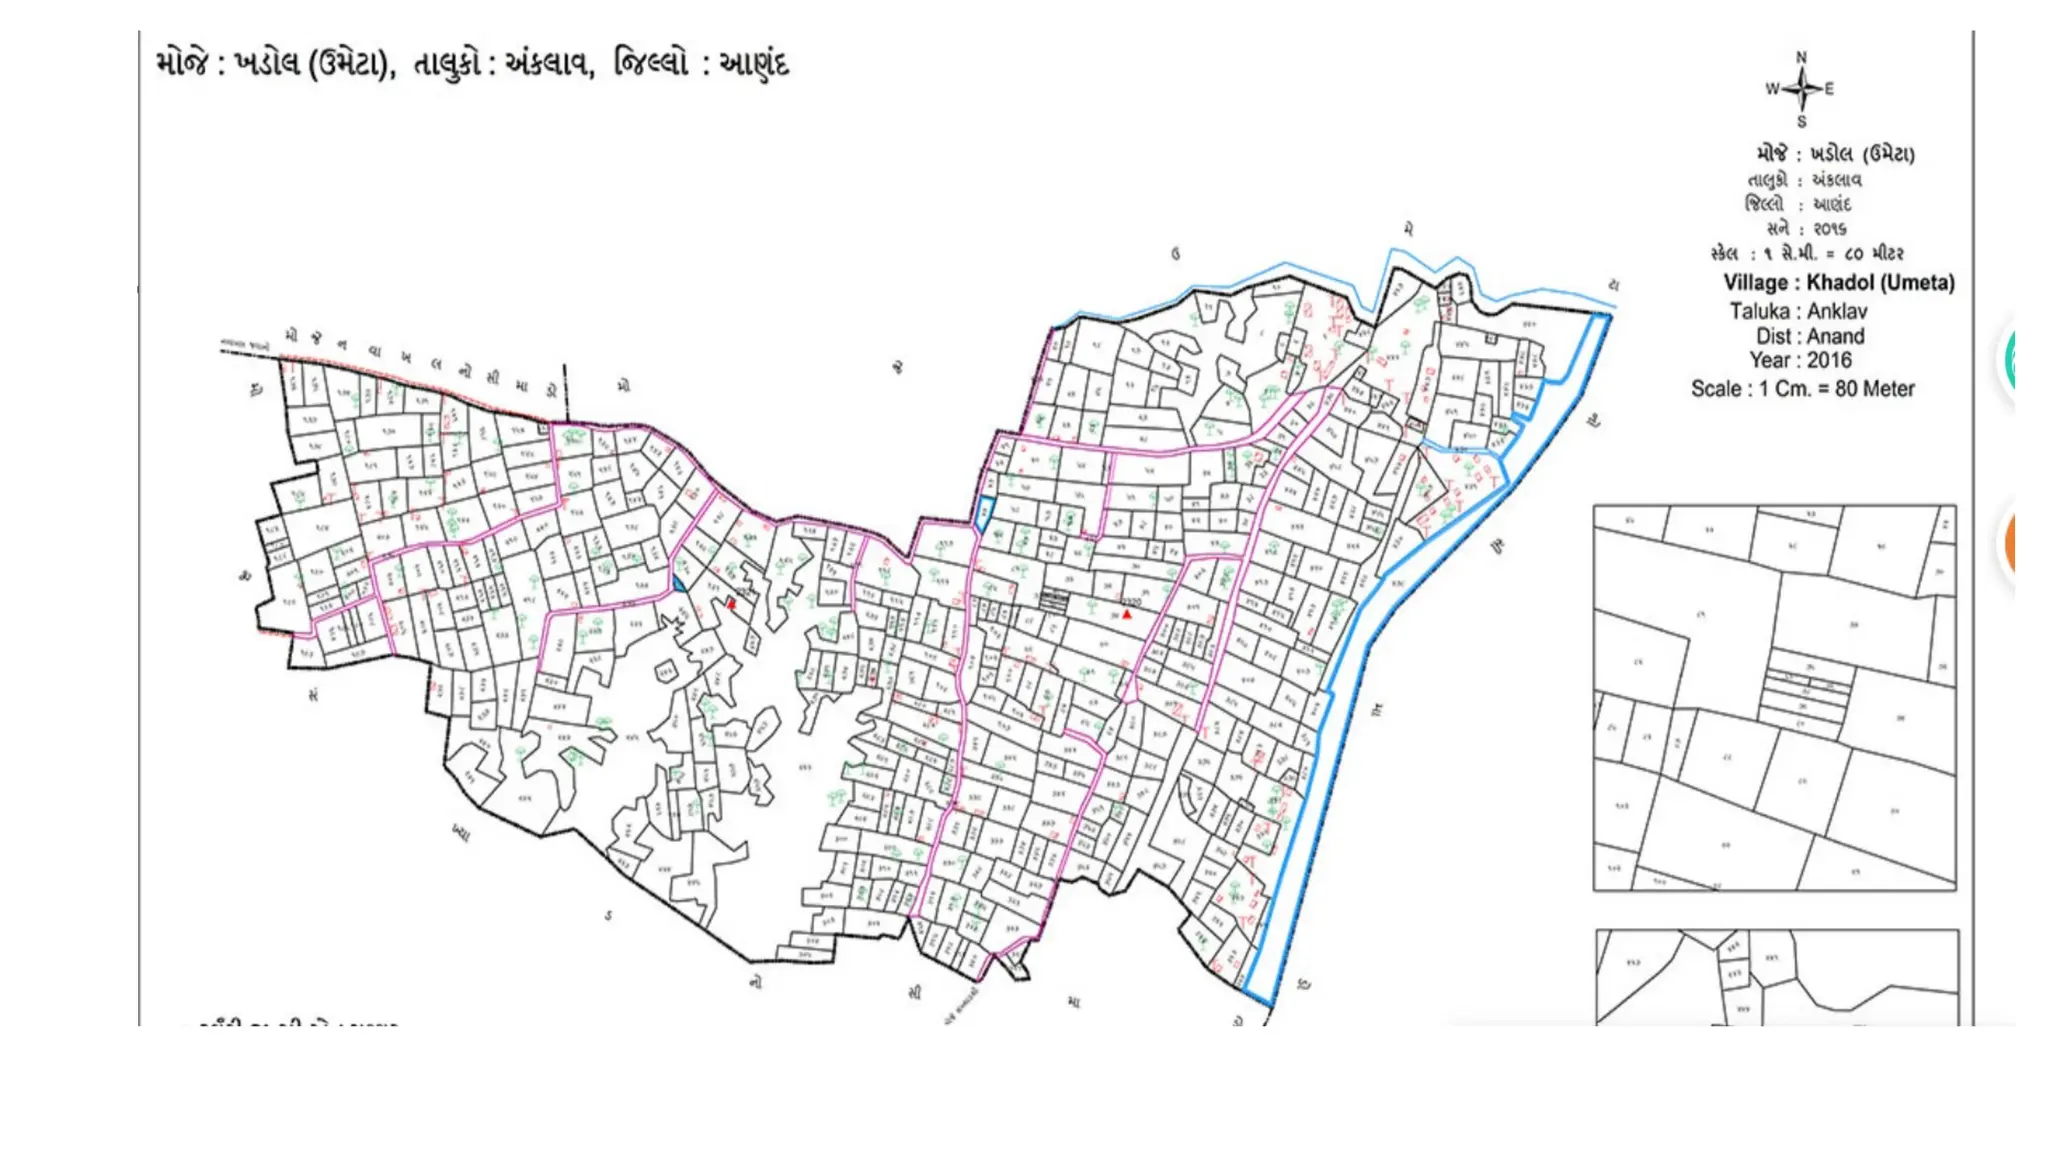
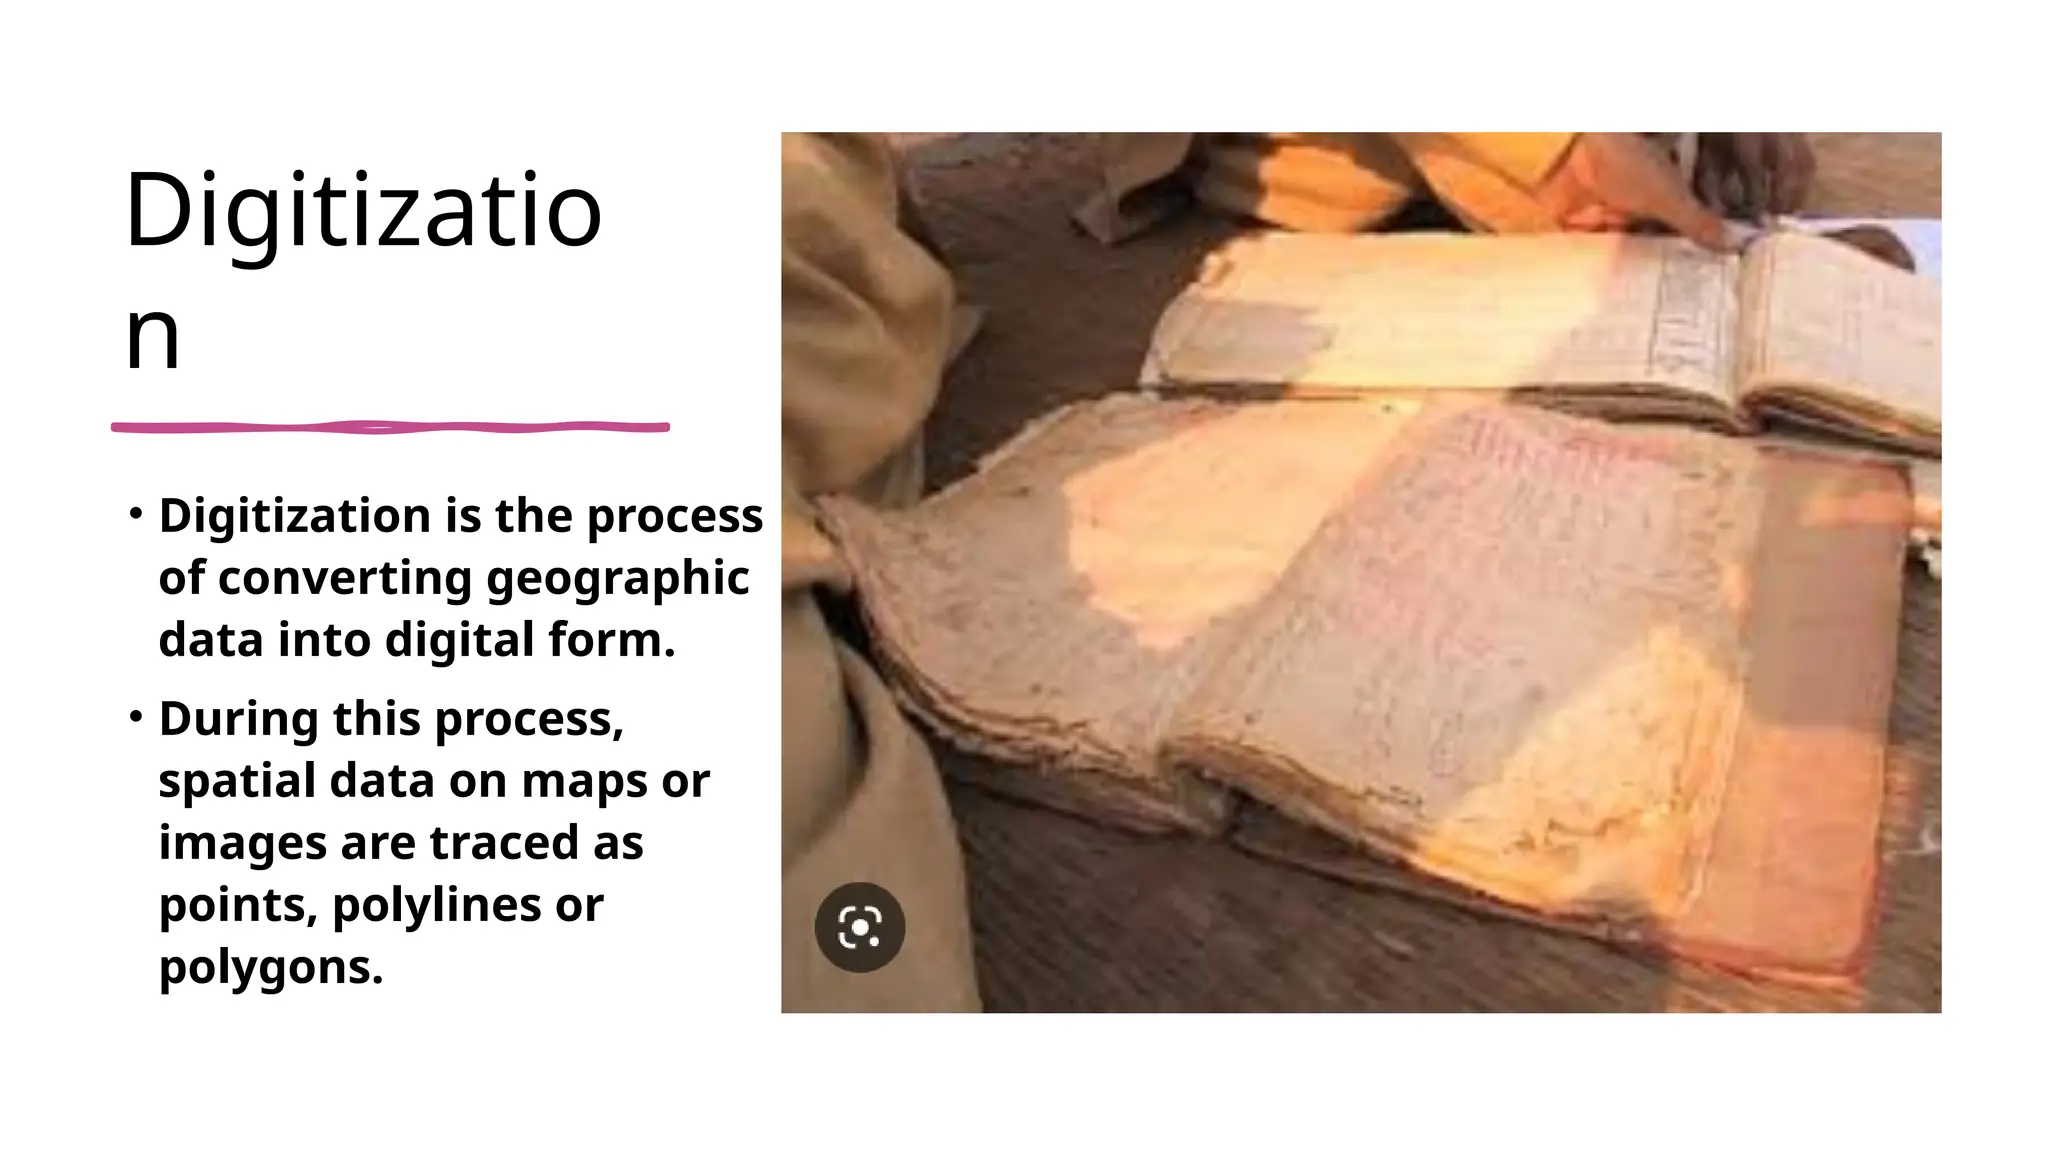
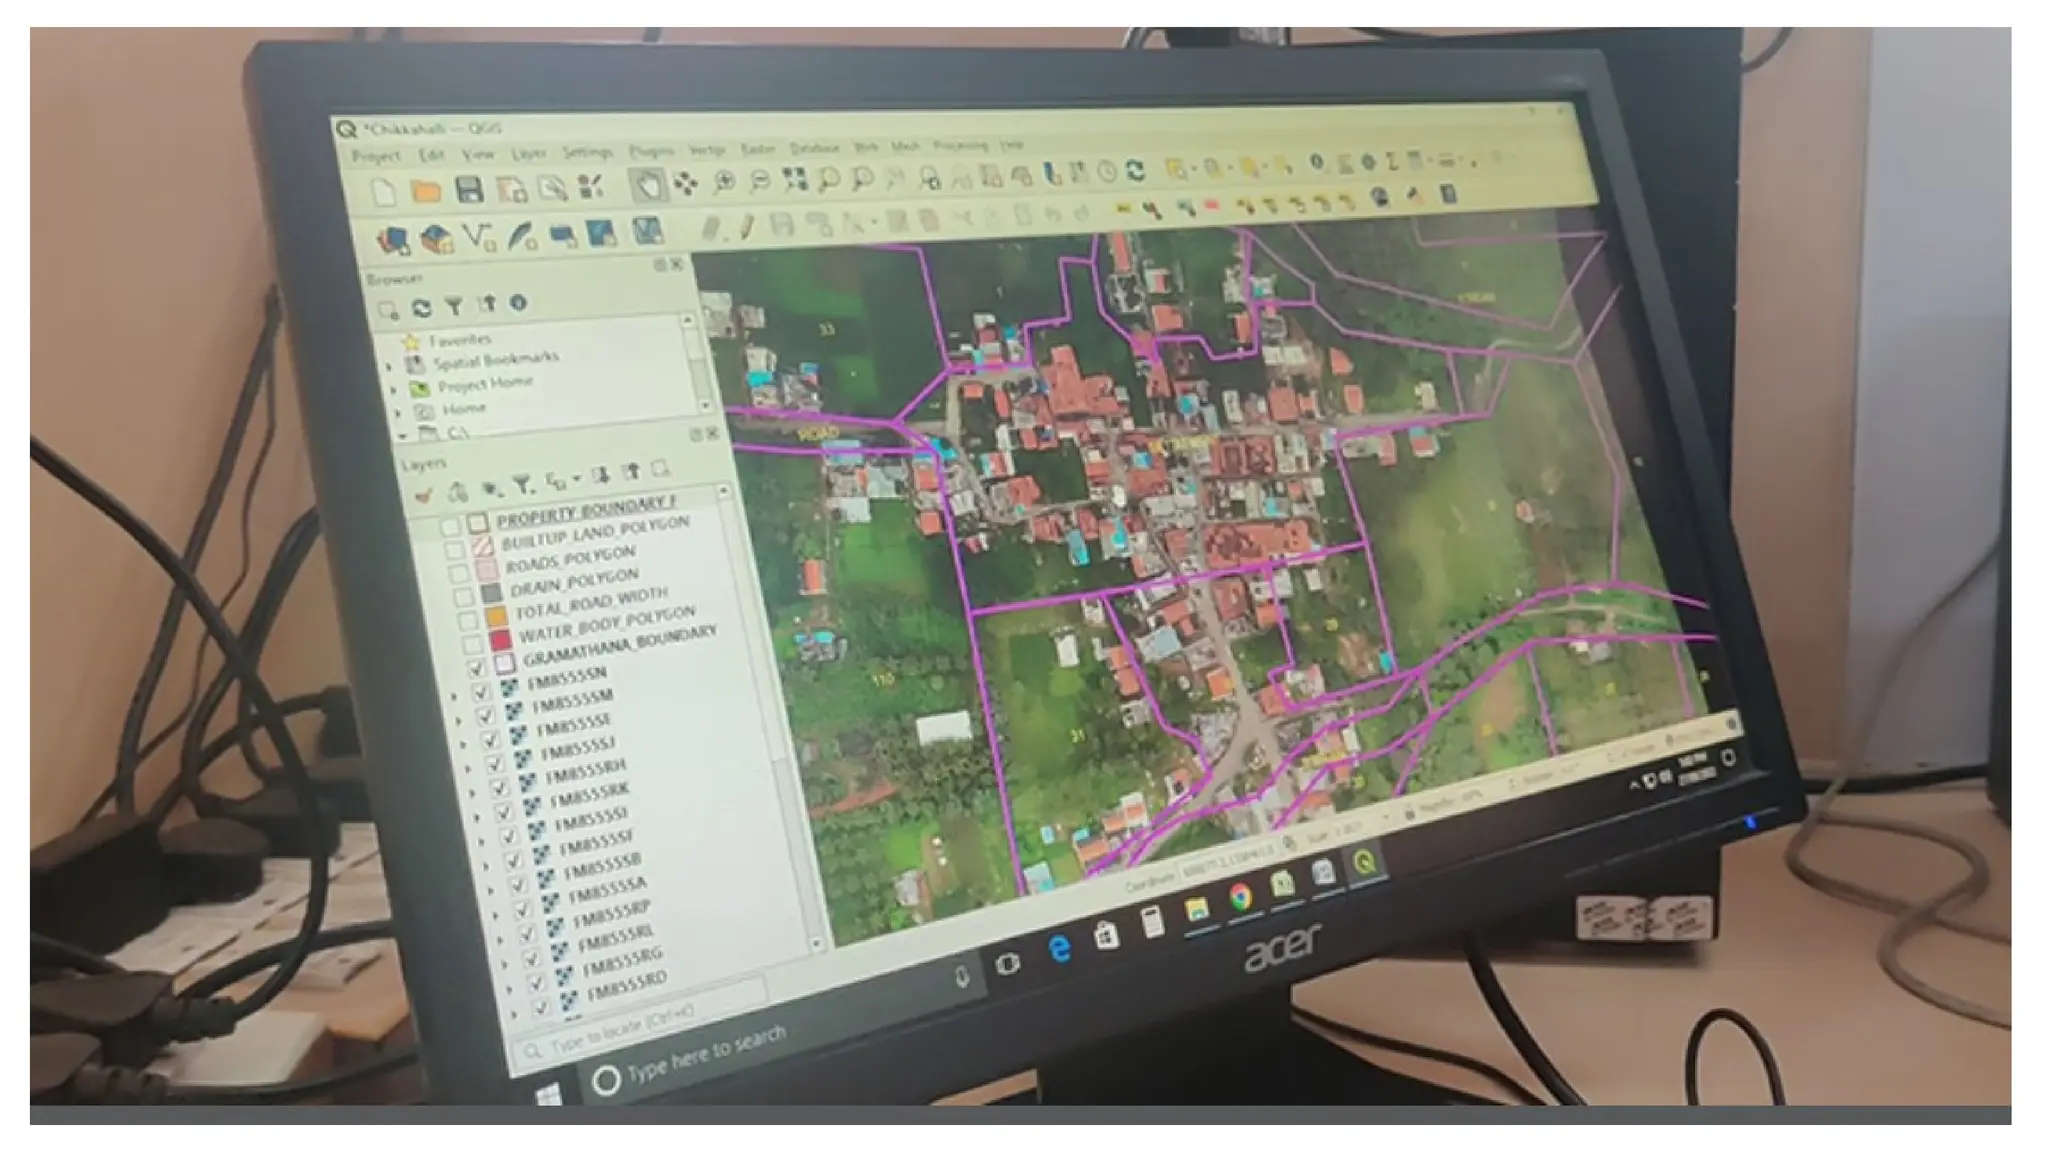
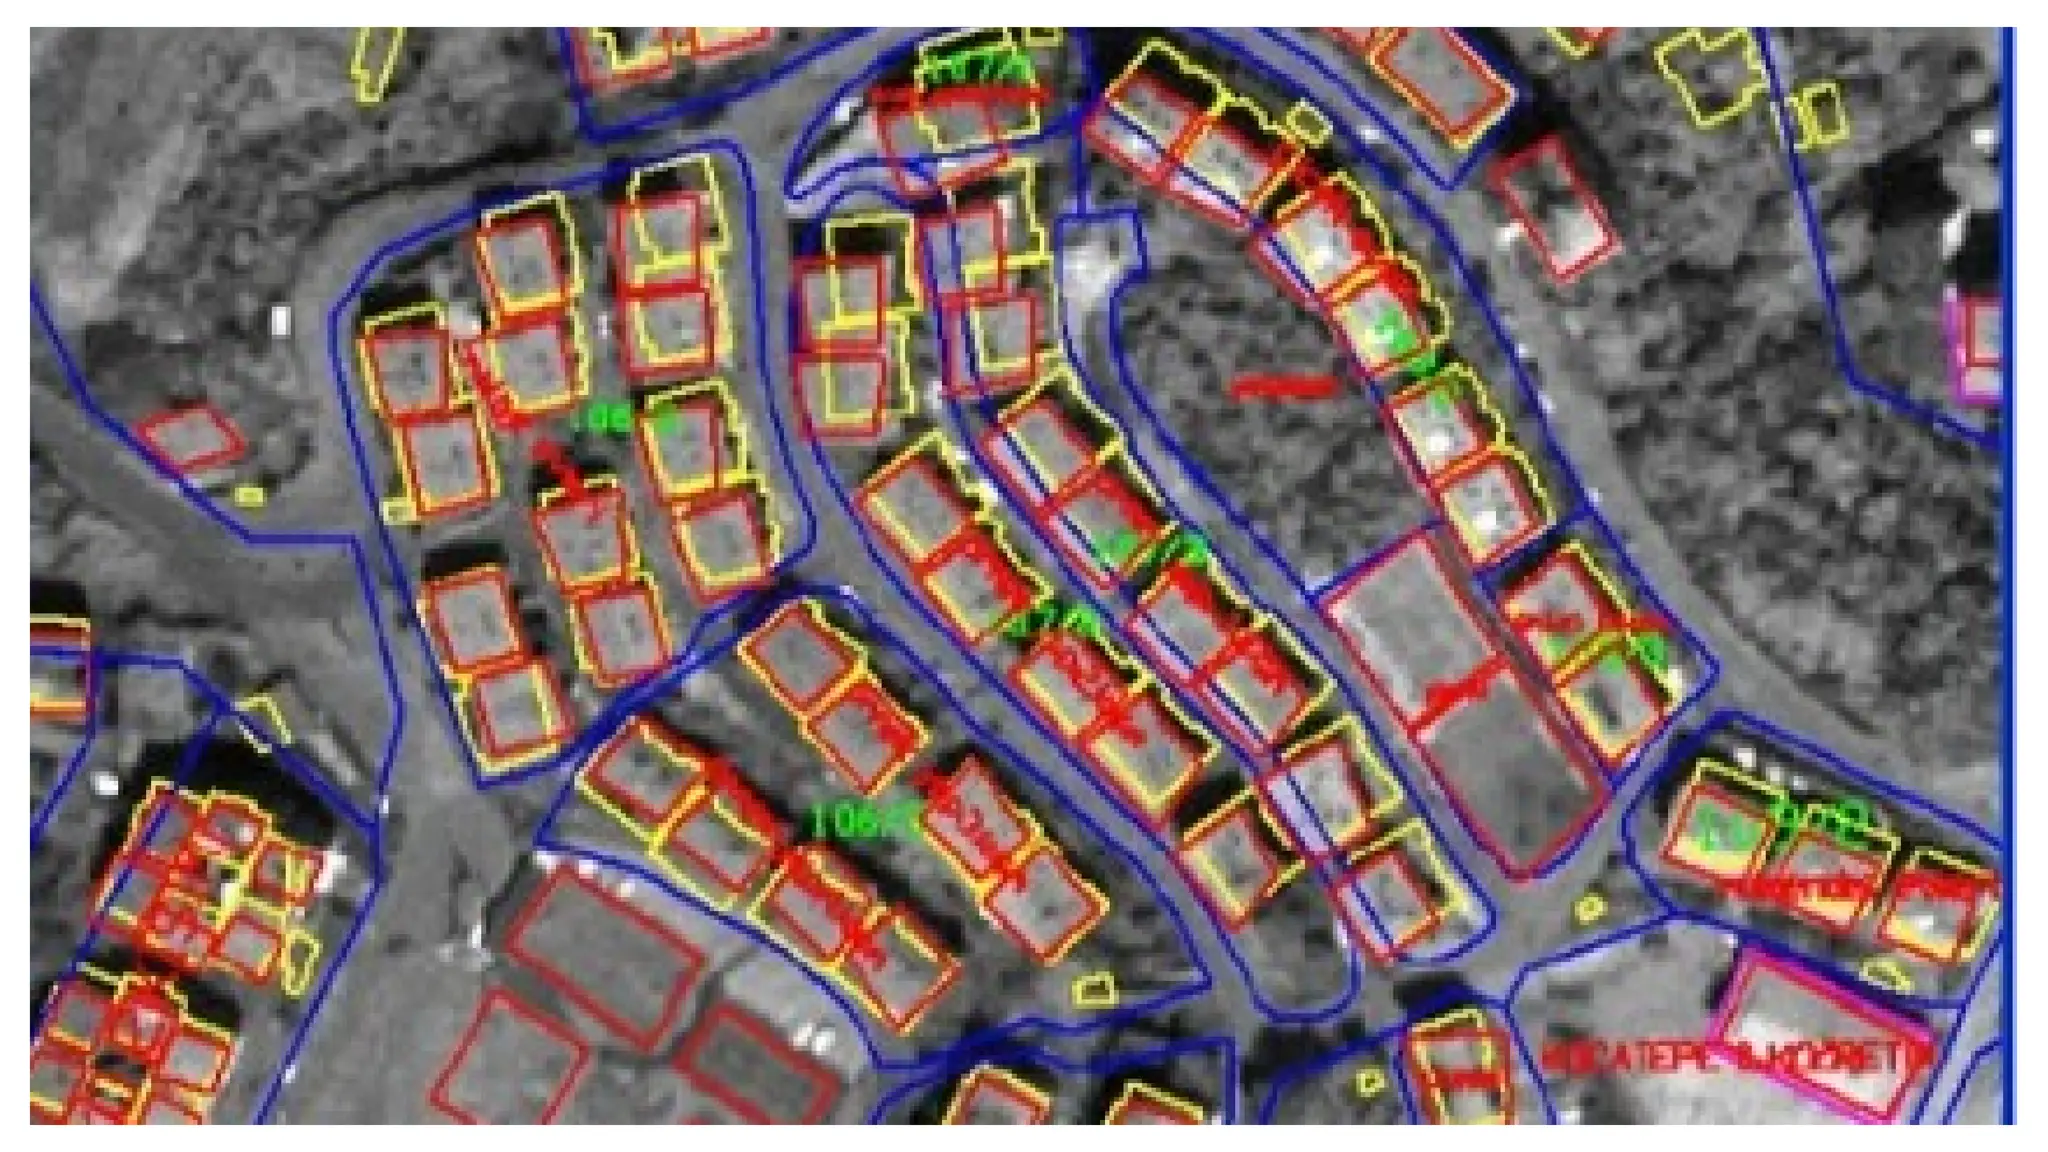
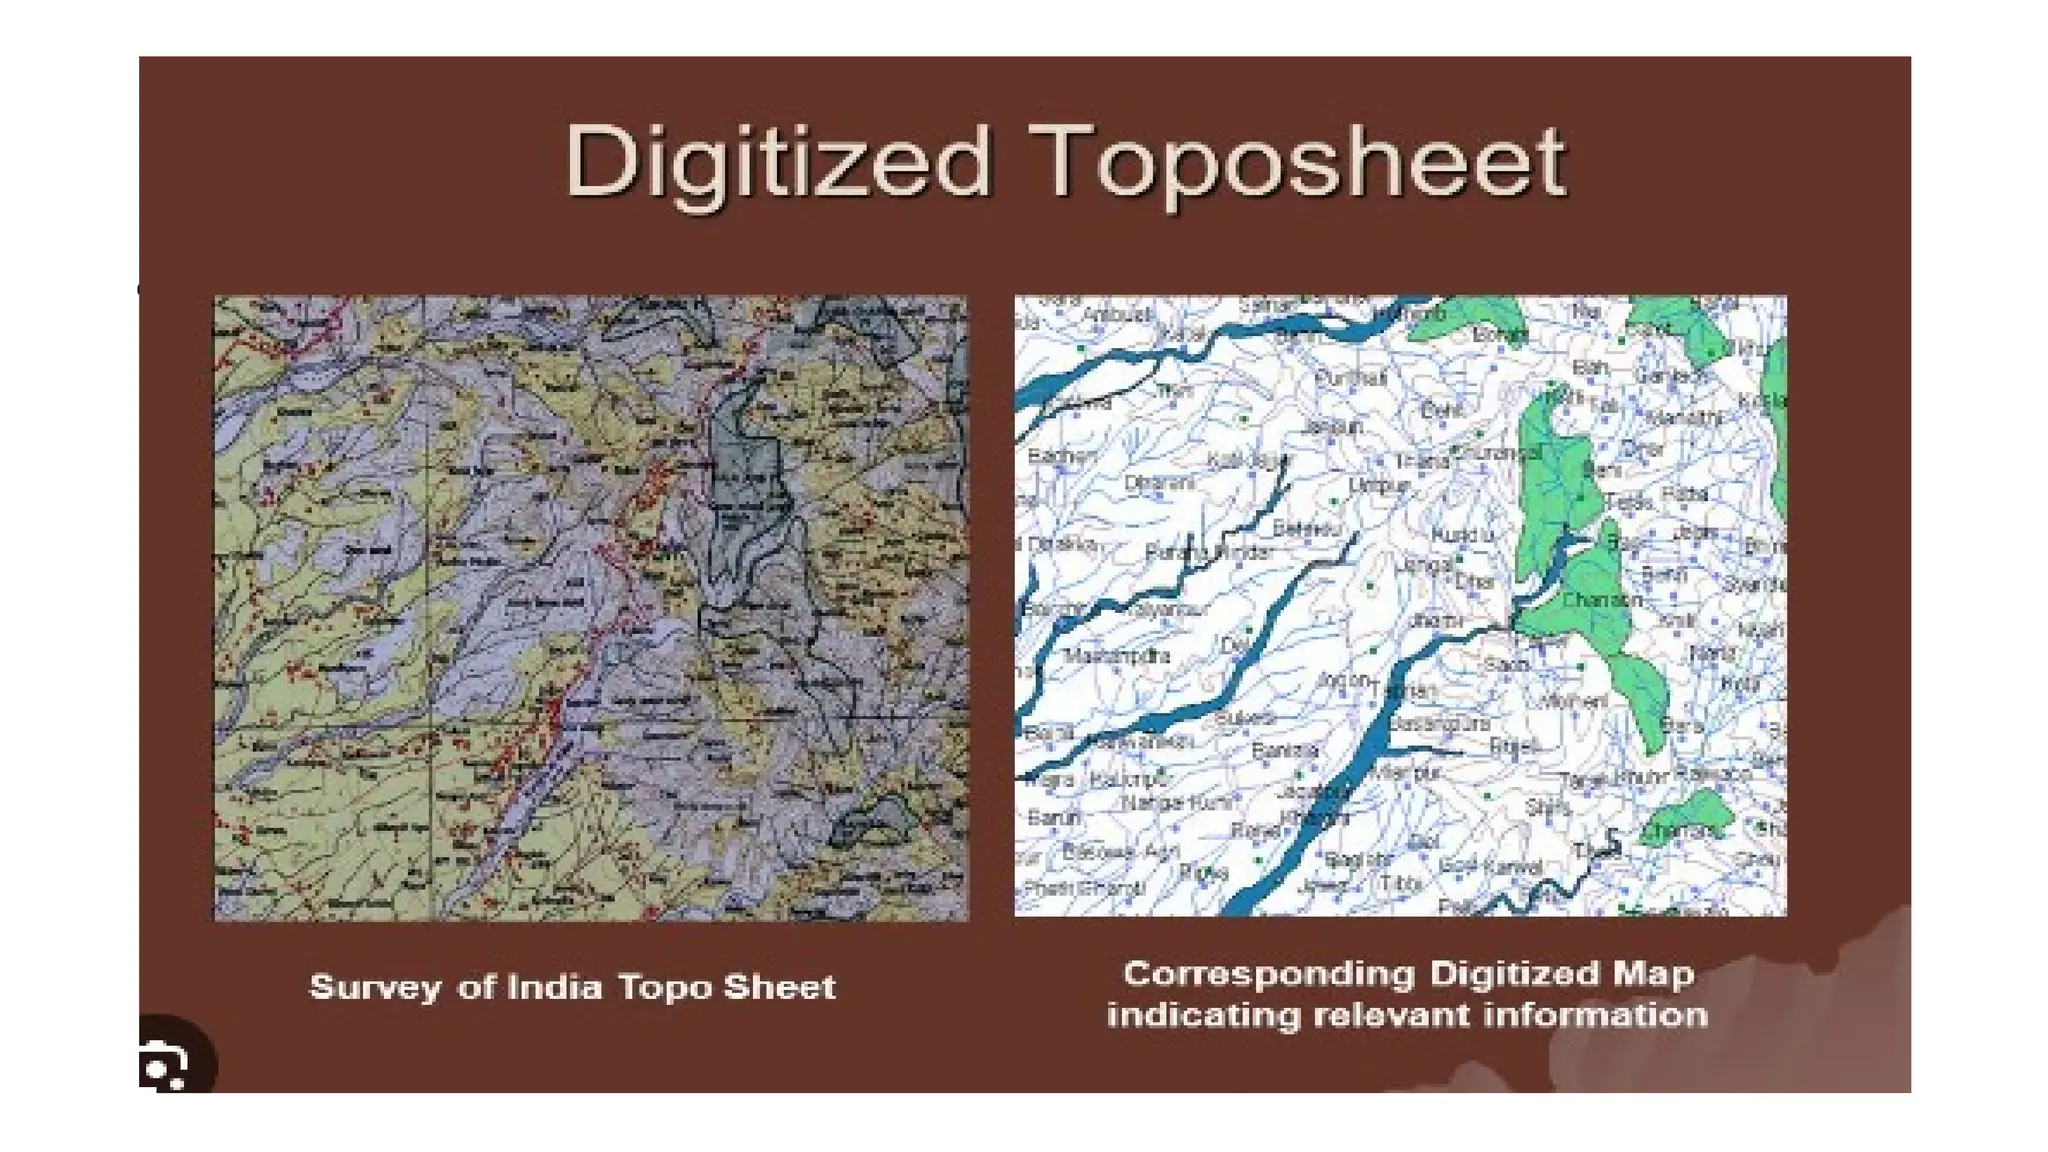
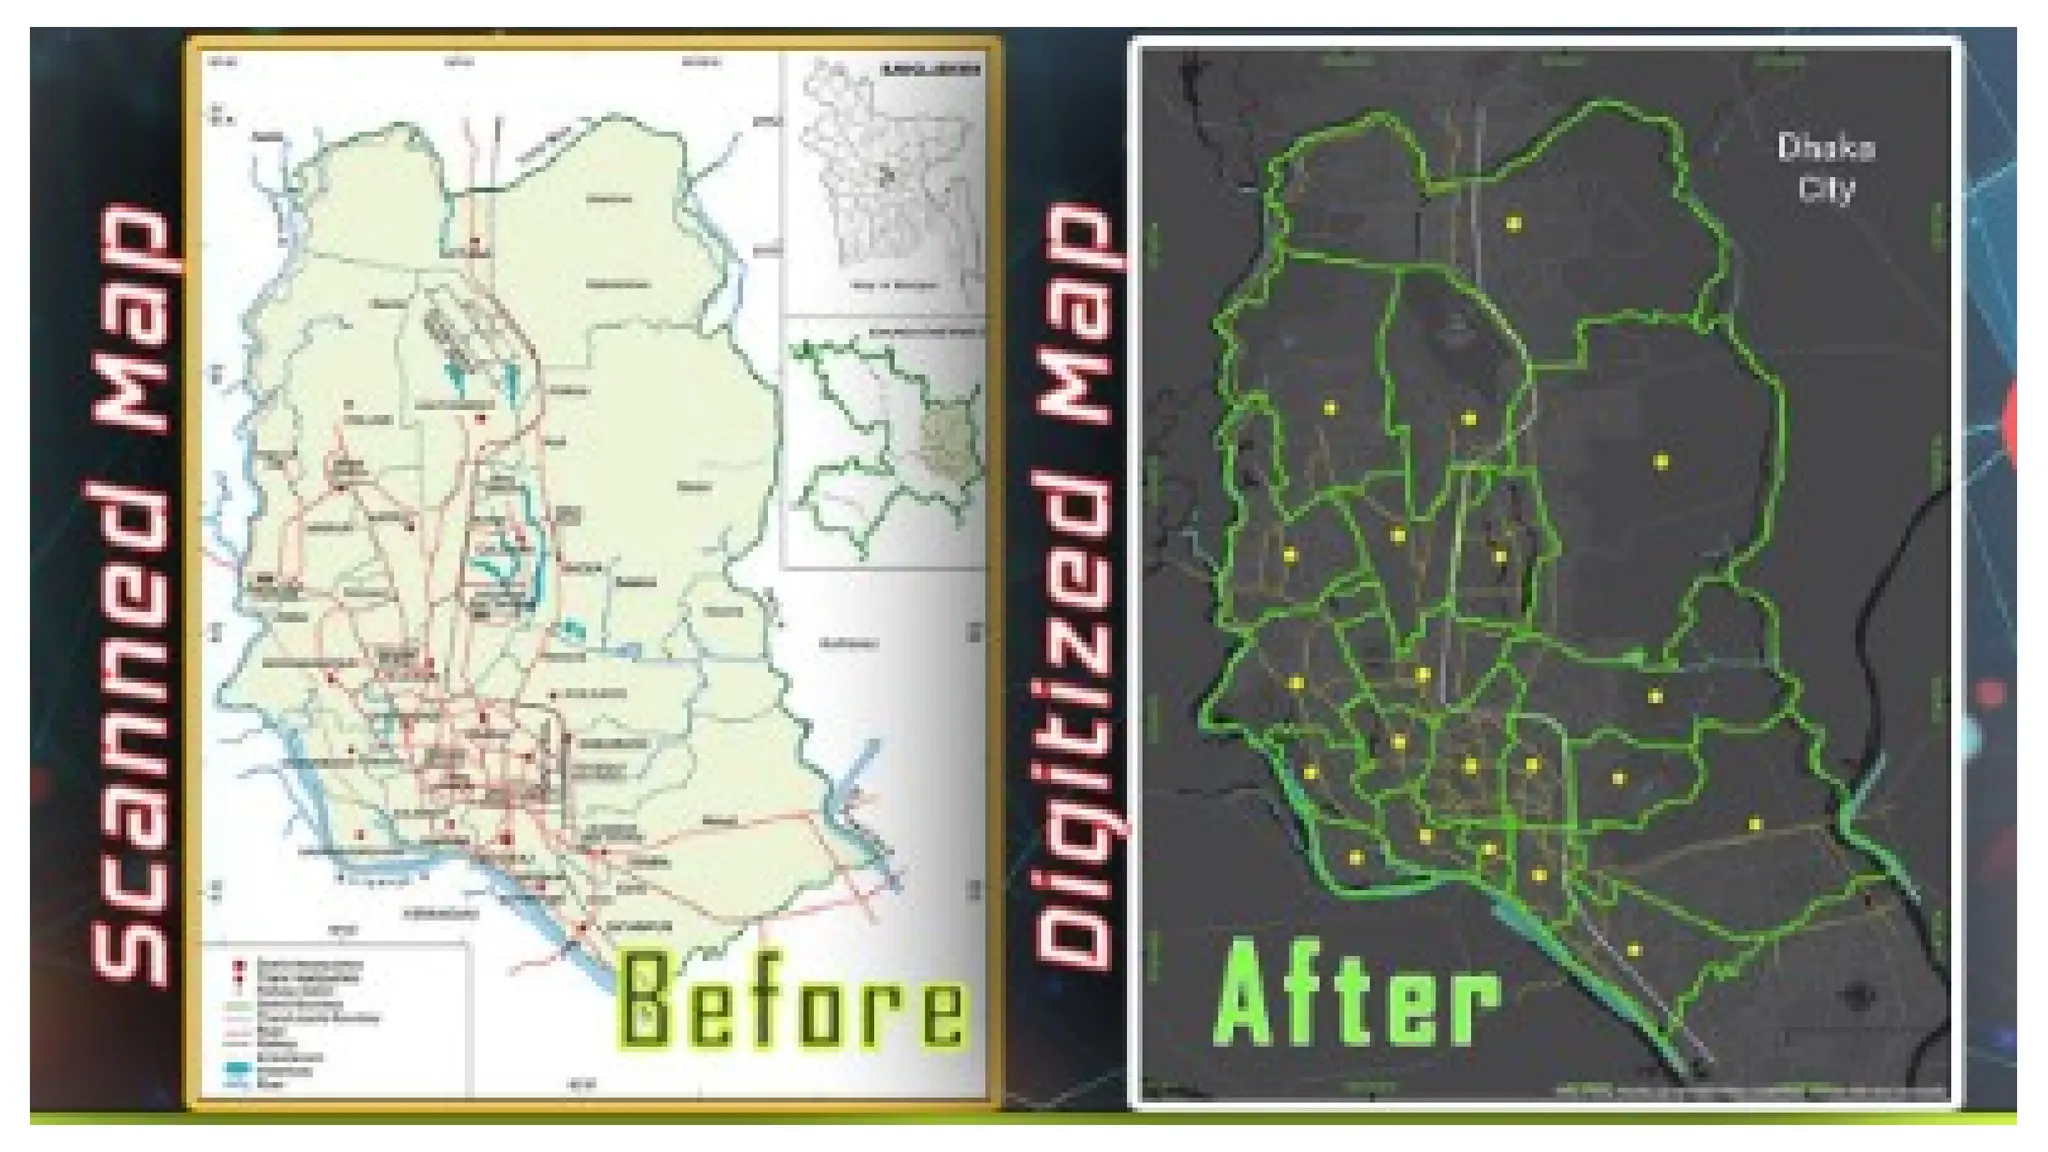
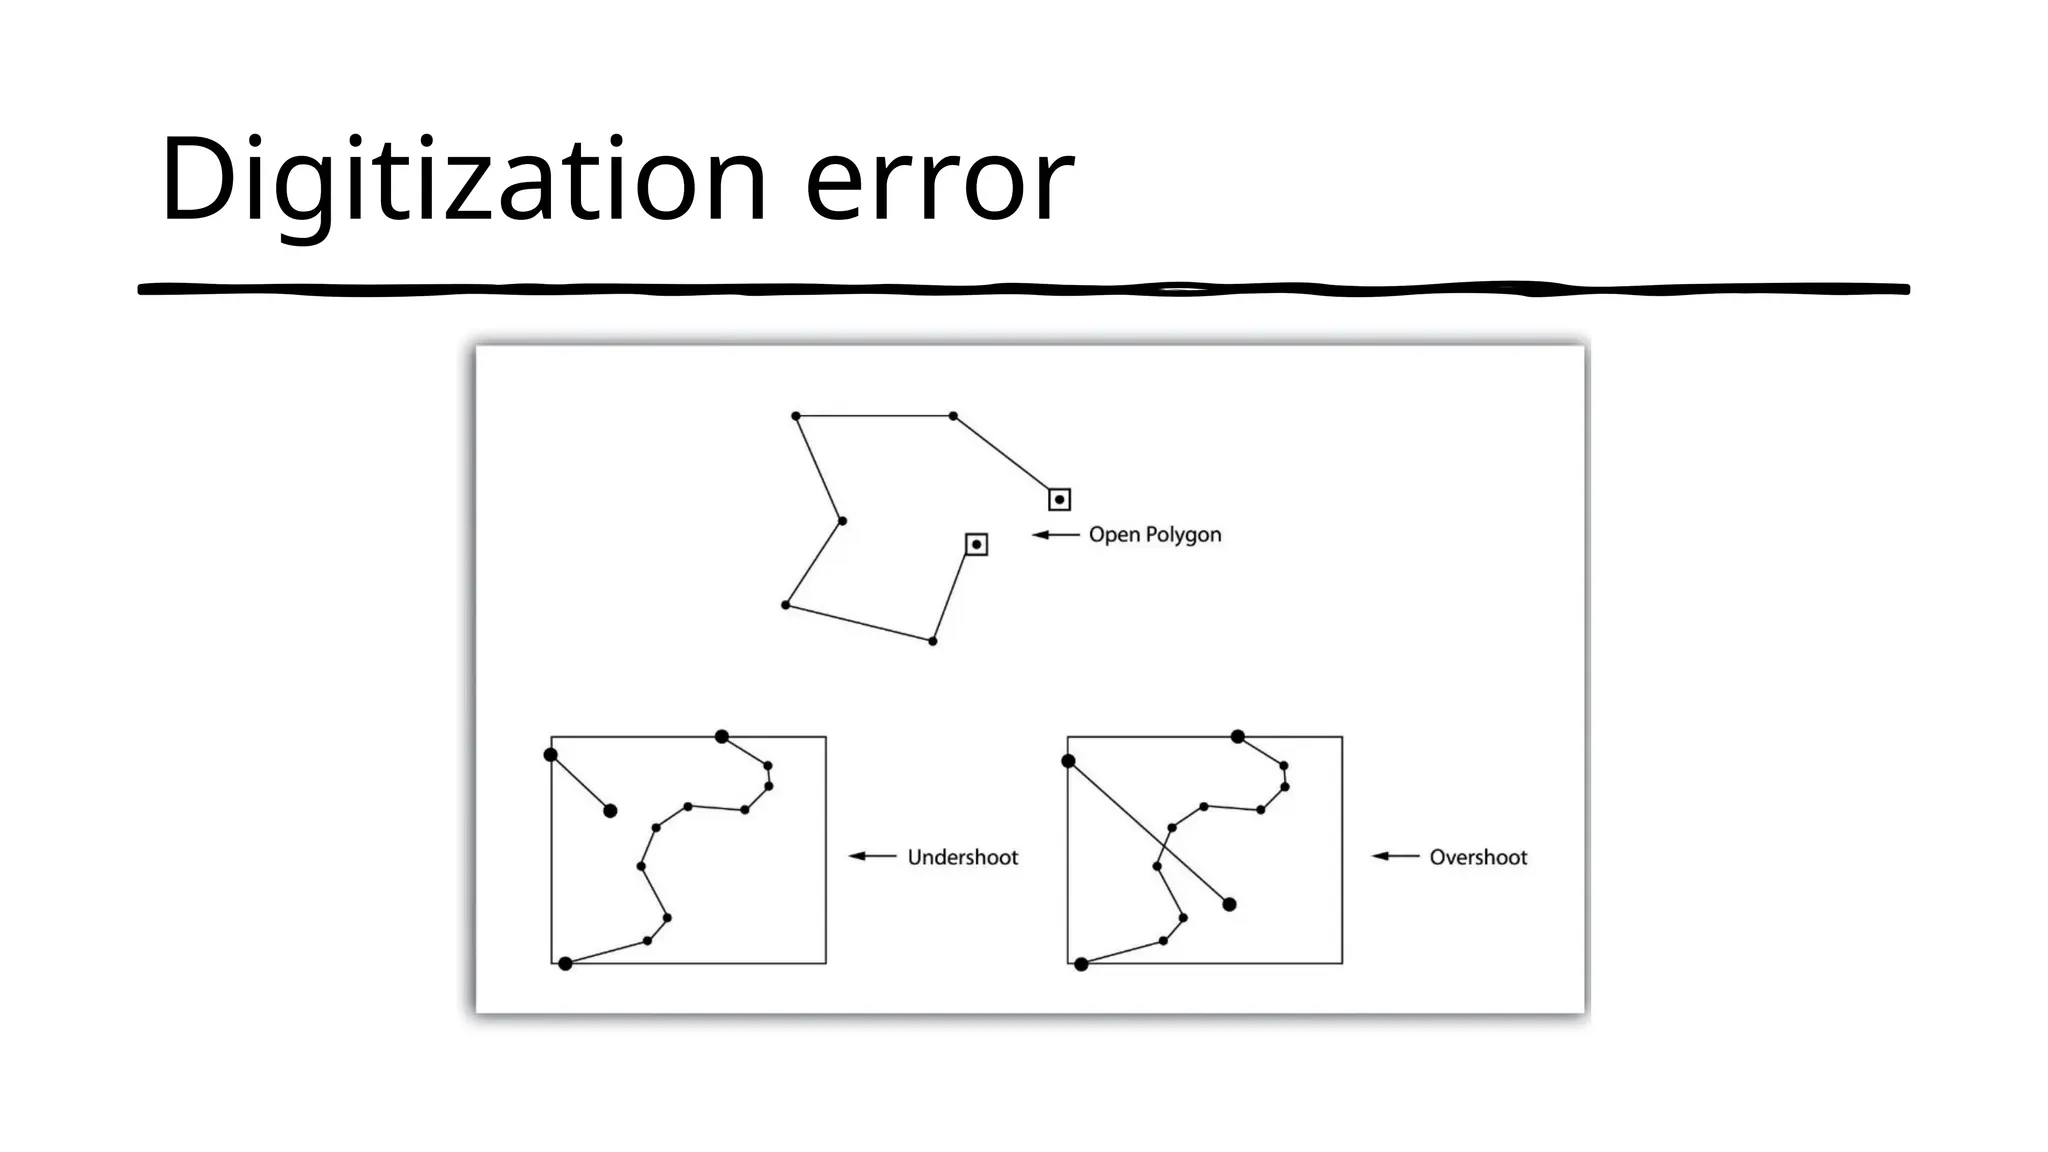
Digitizatio
n
• Digitization isthe process
of converting geographic
data into digital form.
• During this process,
spatial data on maps or
images are traced as
points, polylines or
polygons.
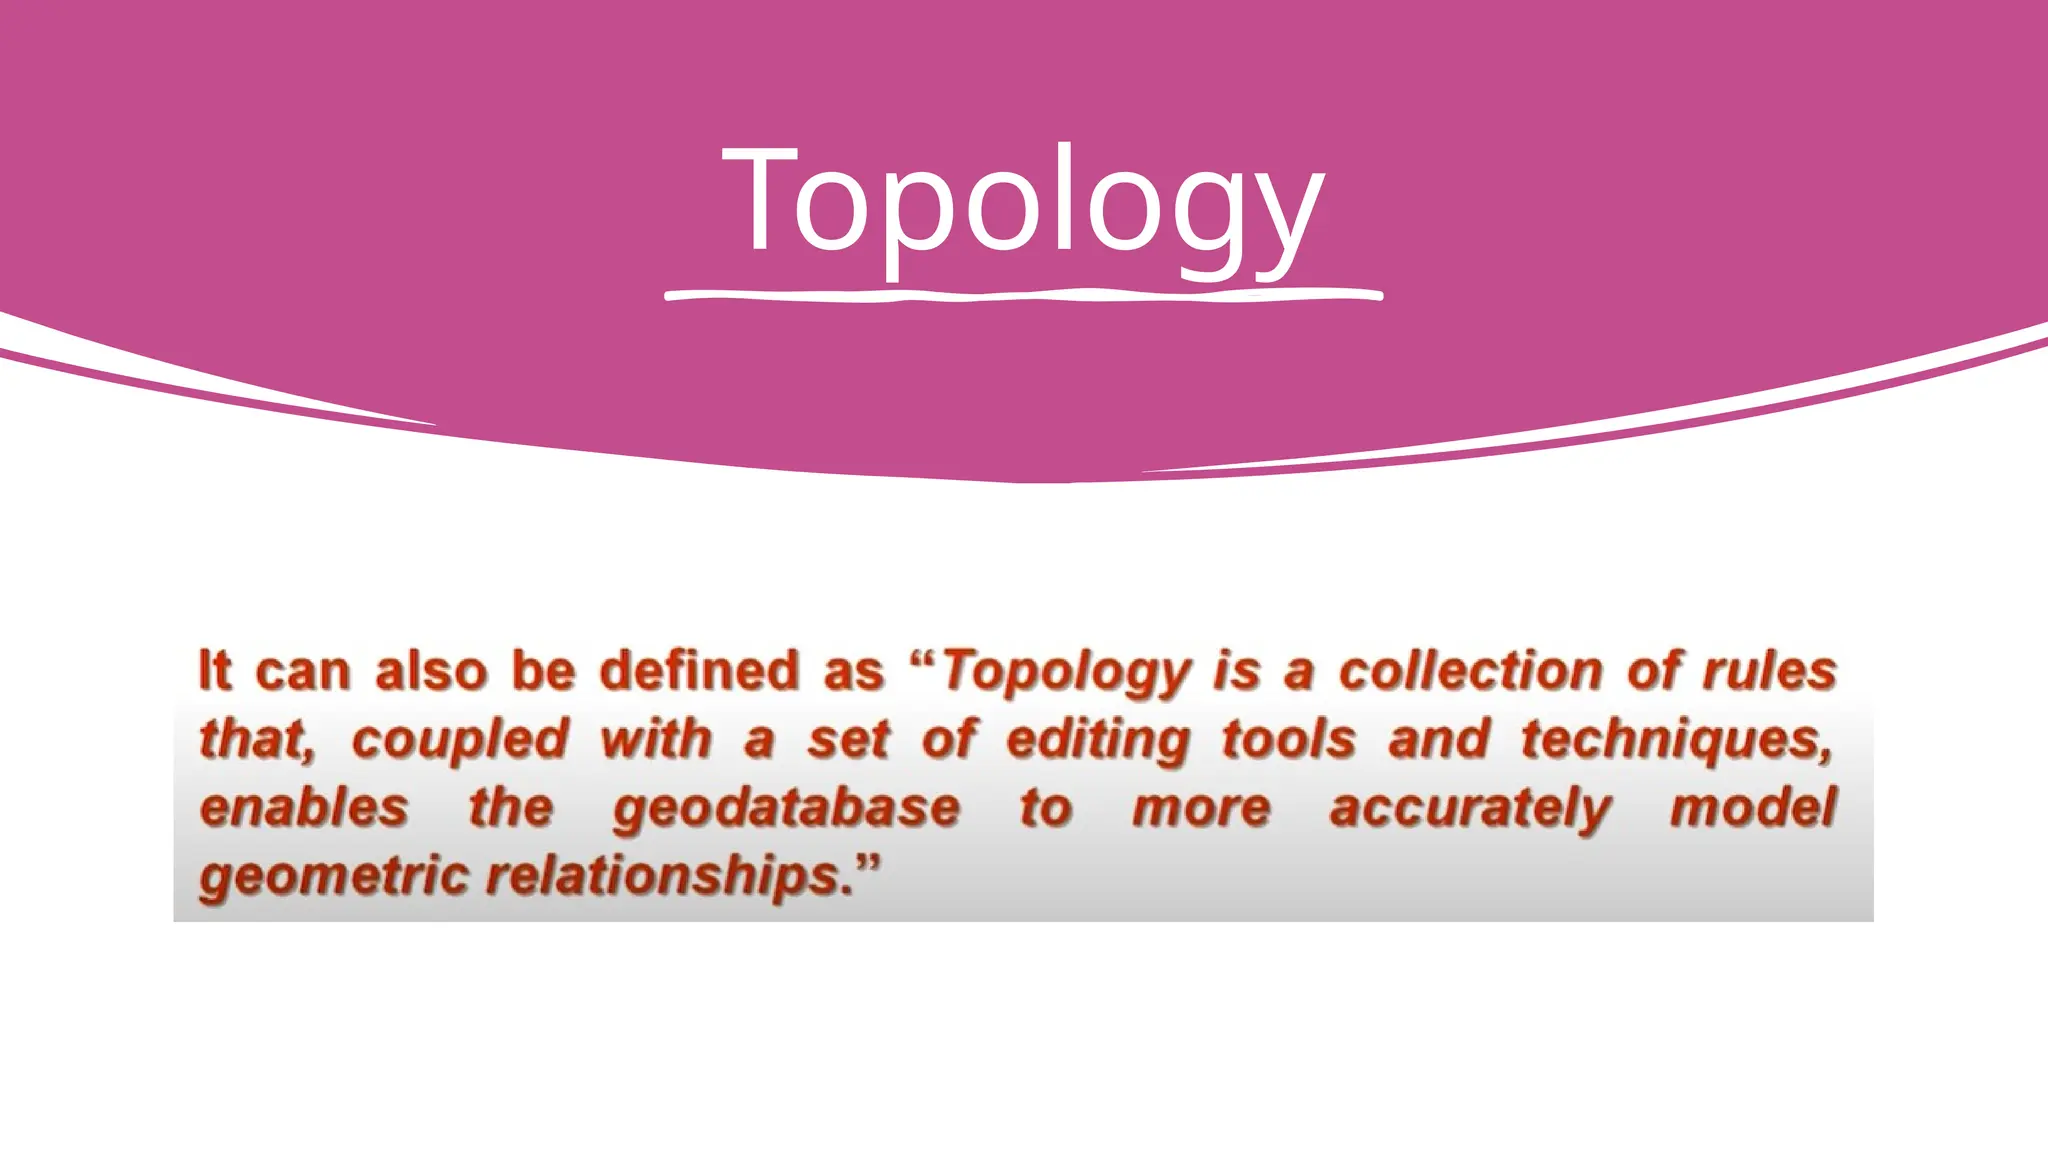
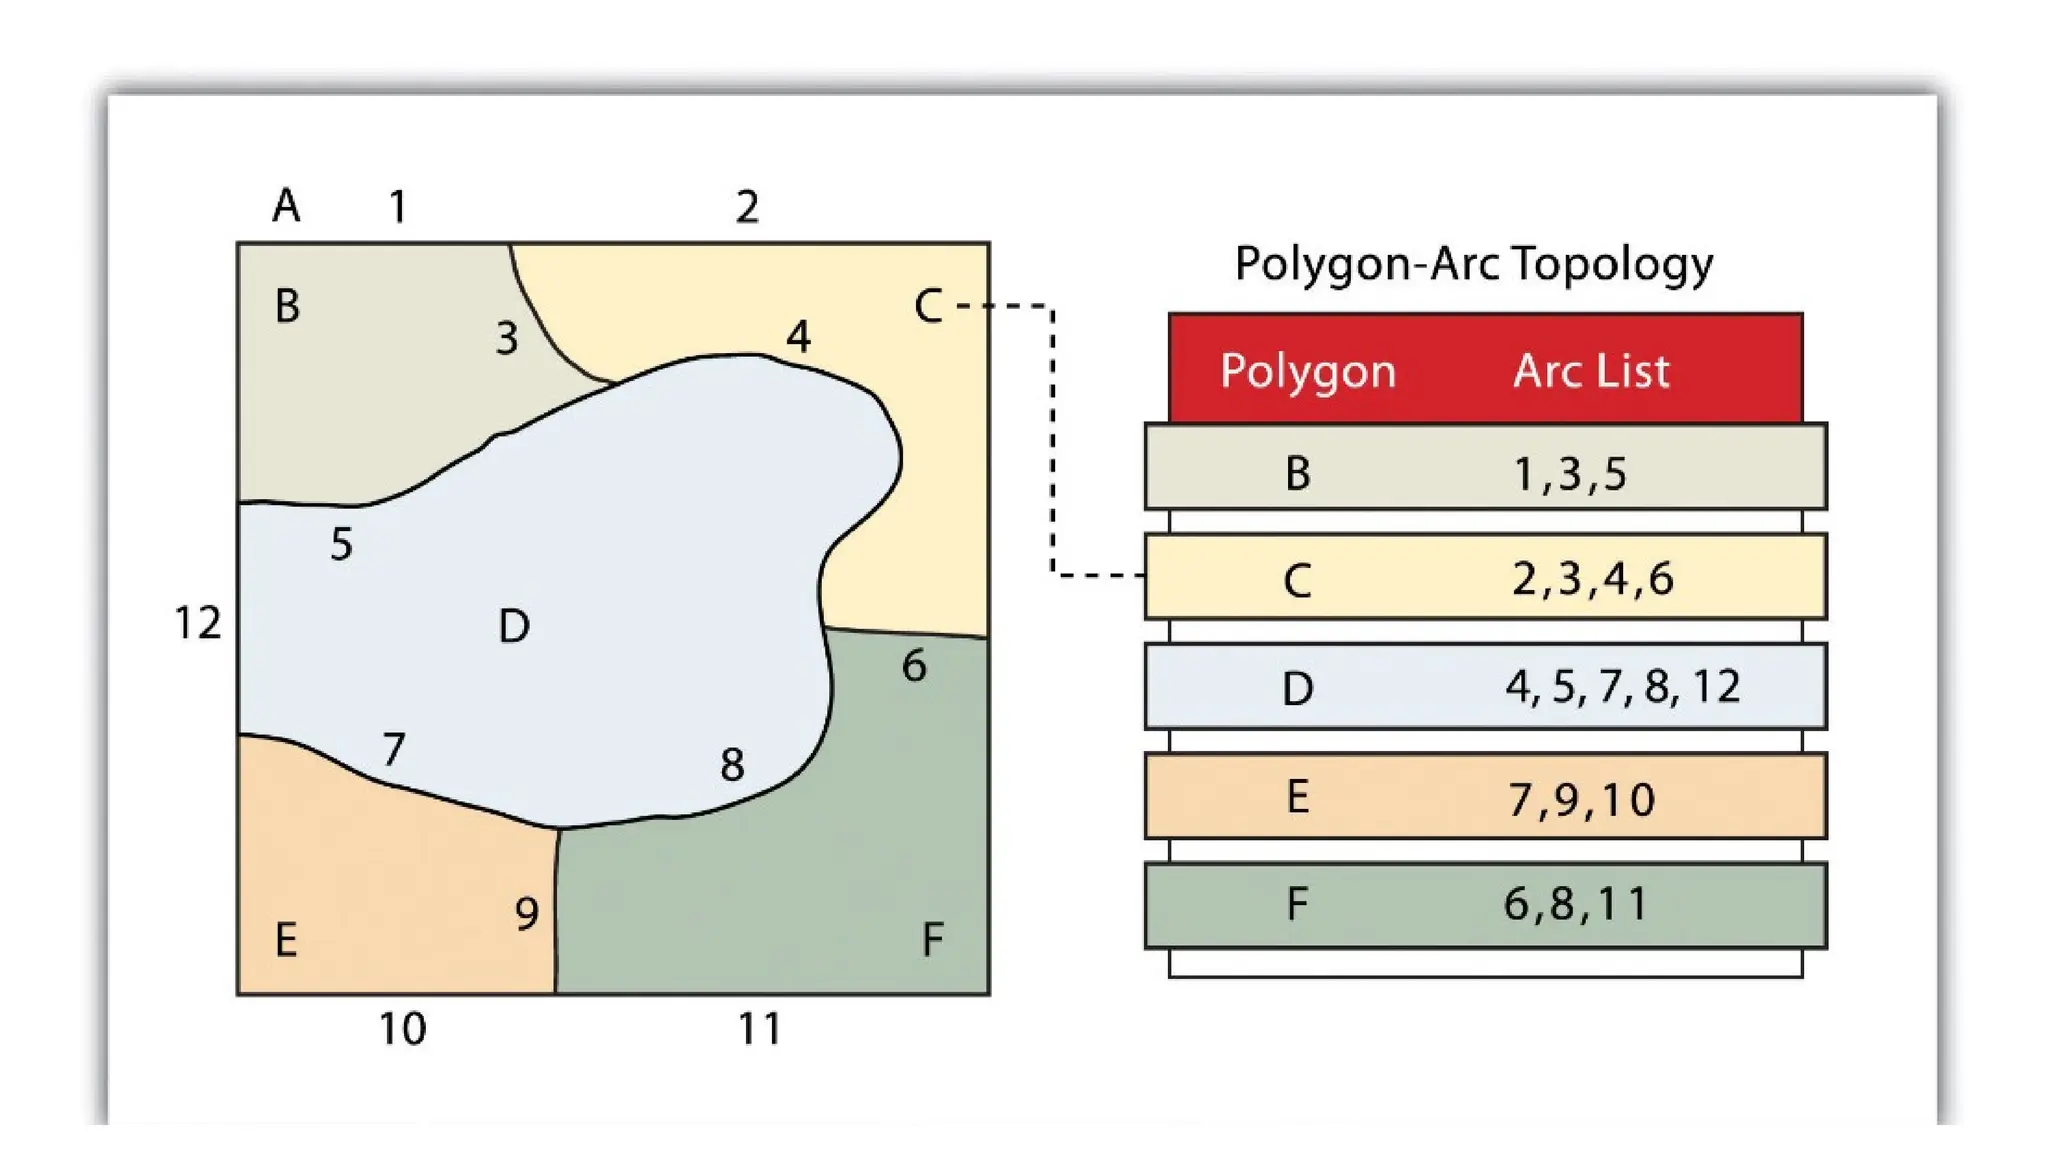
Topology
Spatial relationships betweenadjacent or neighboring features
which do not change under any transformation.
Adjacency and containment describe the geometric relationships which
exist between area features. Areas can be described as being adjacent
when they share a common boundary.
Containment is an extension of the adjacency that describes area
features which may be wholly contained within another area feature,
such as, an island within a lake.
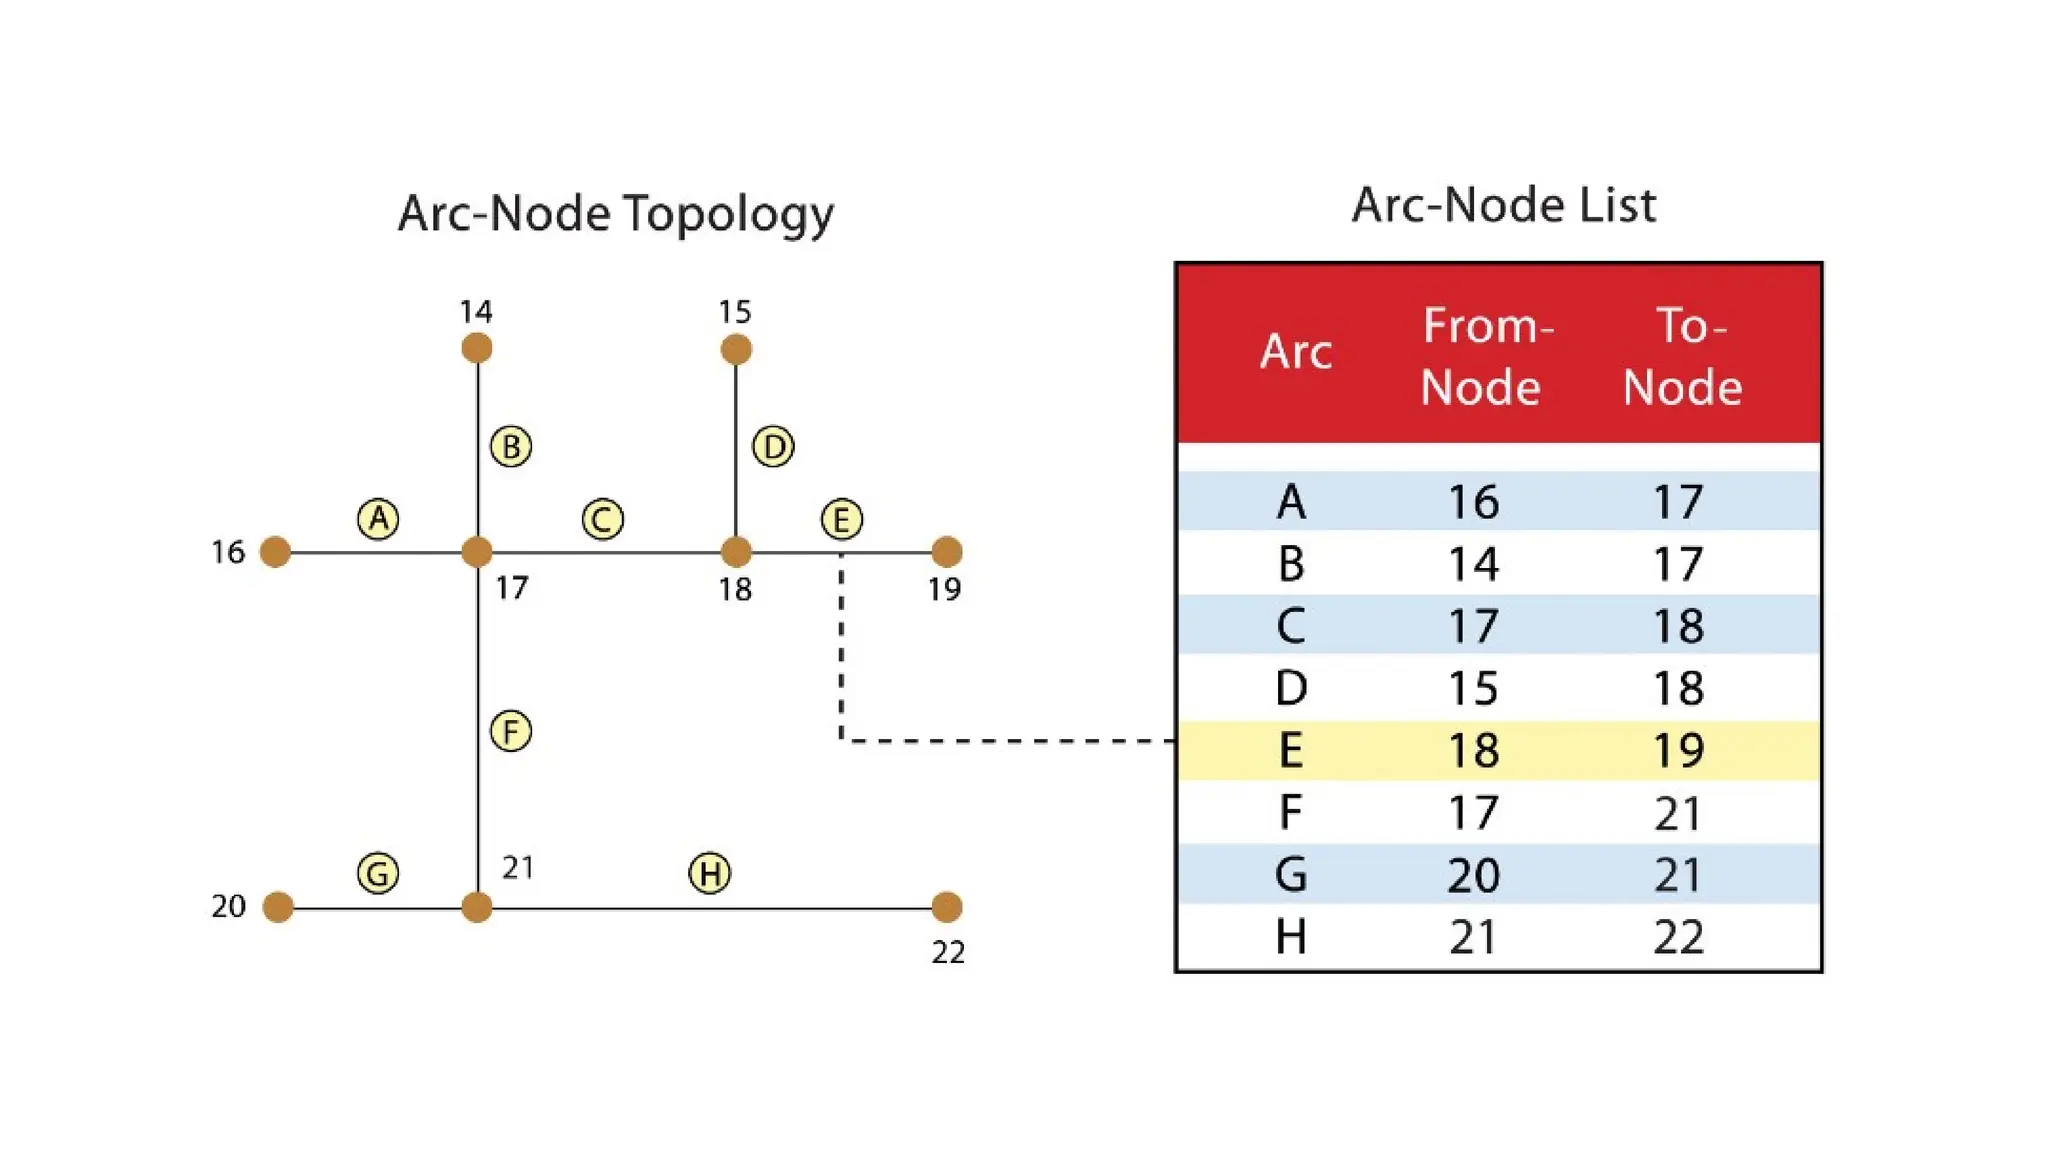
Connectivity is a geometric property used to describe the linkages
between line features, like road network.
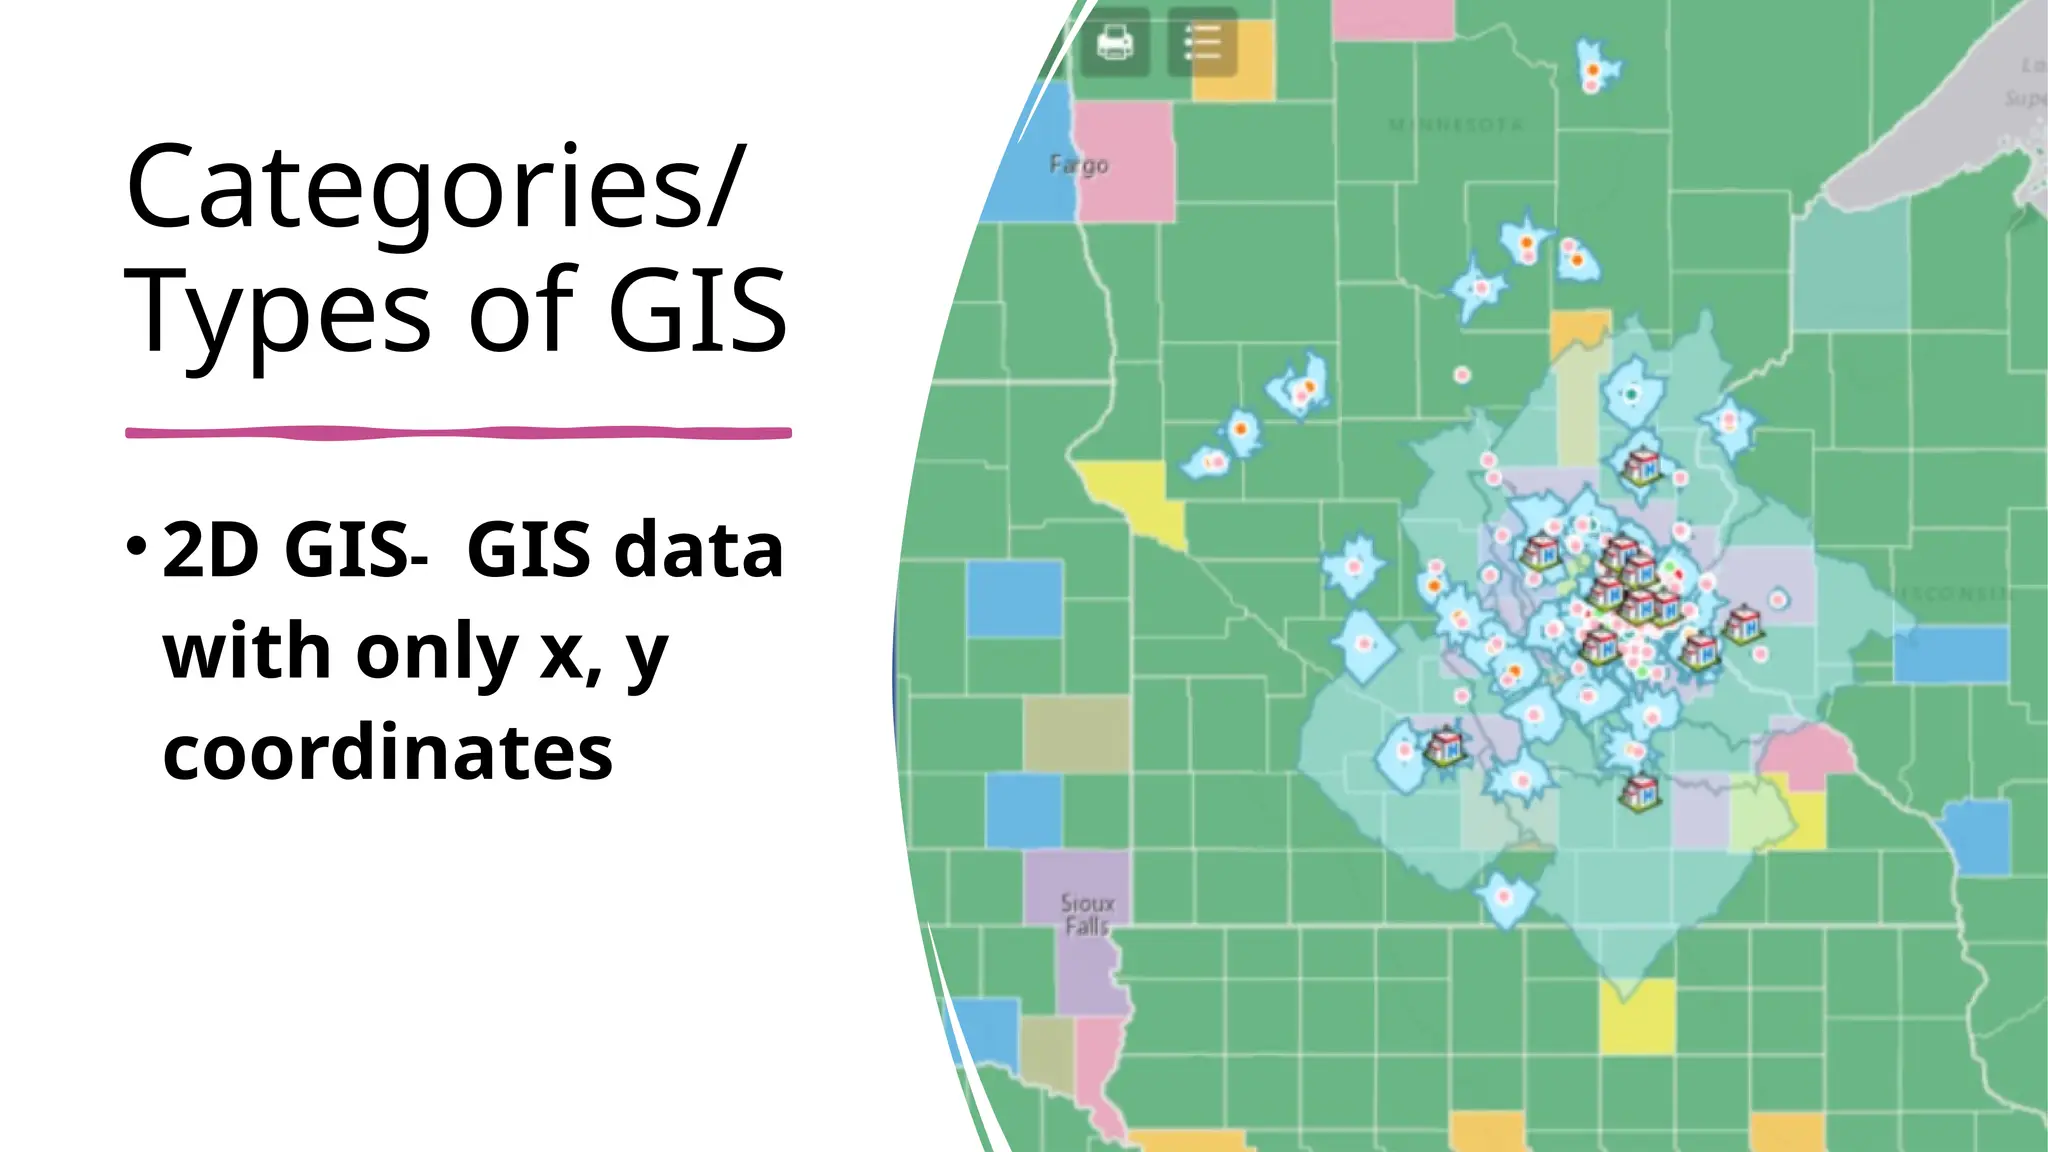
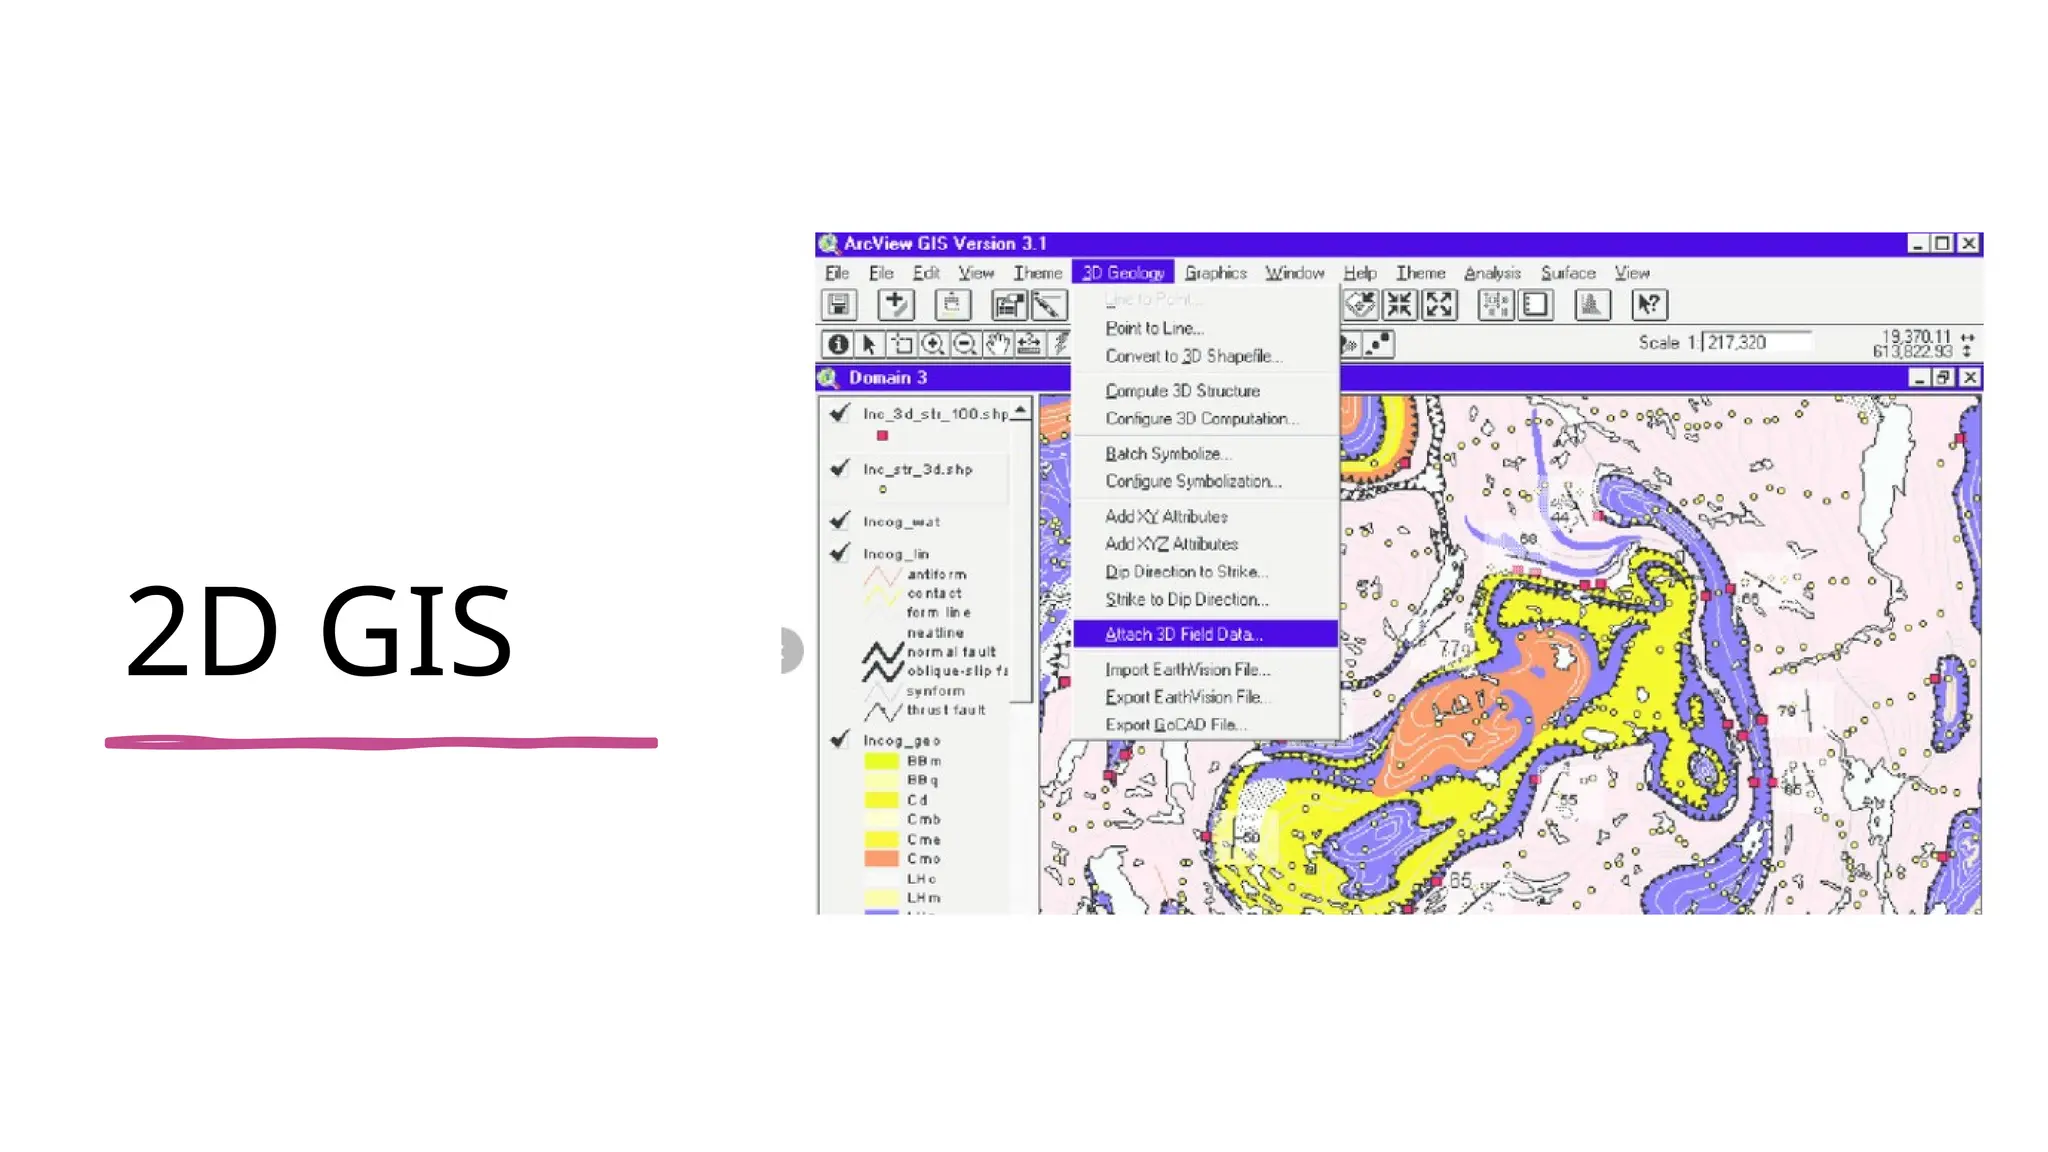
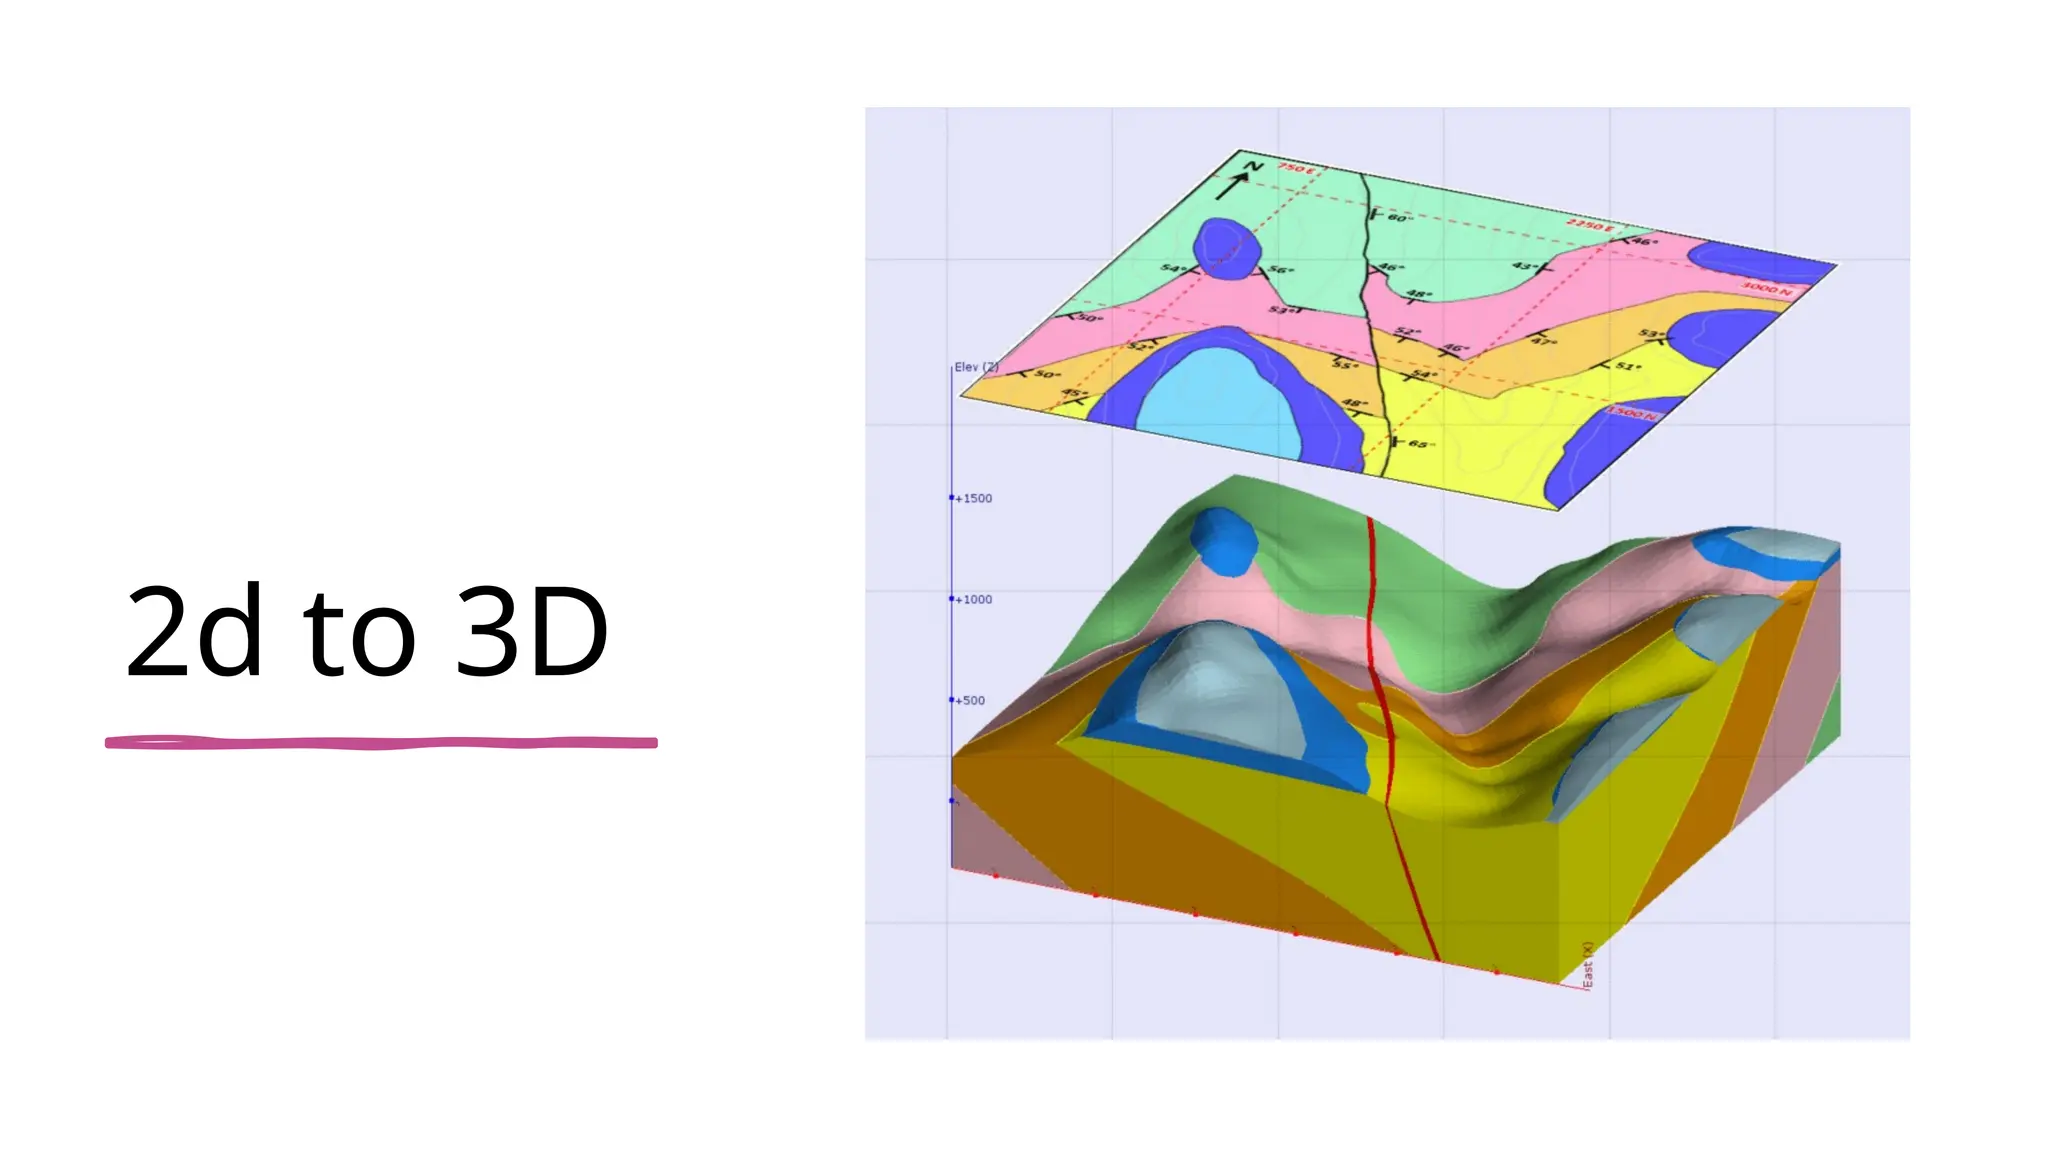
2.5 D
GIS
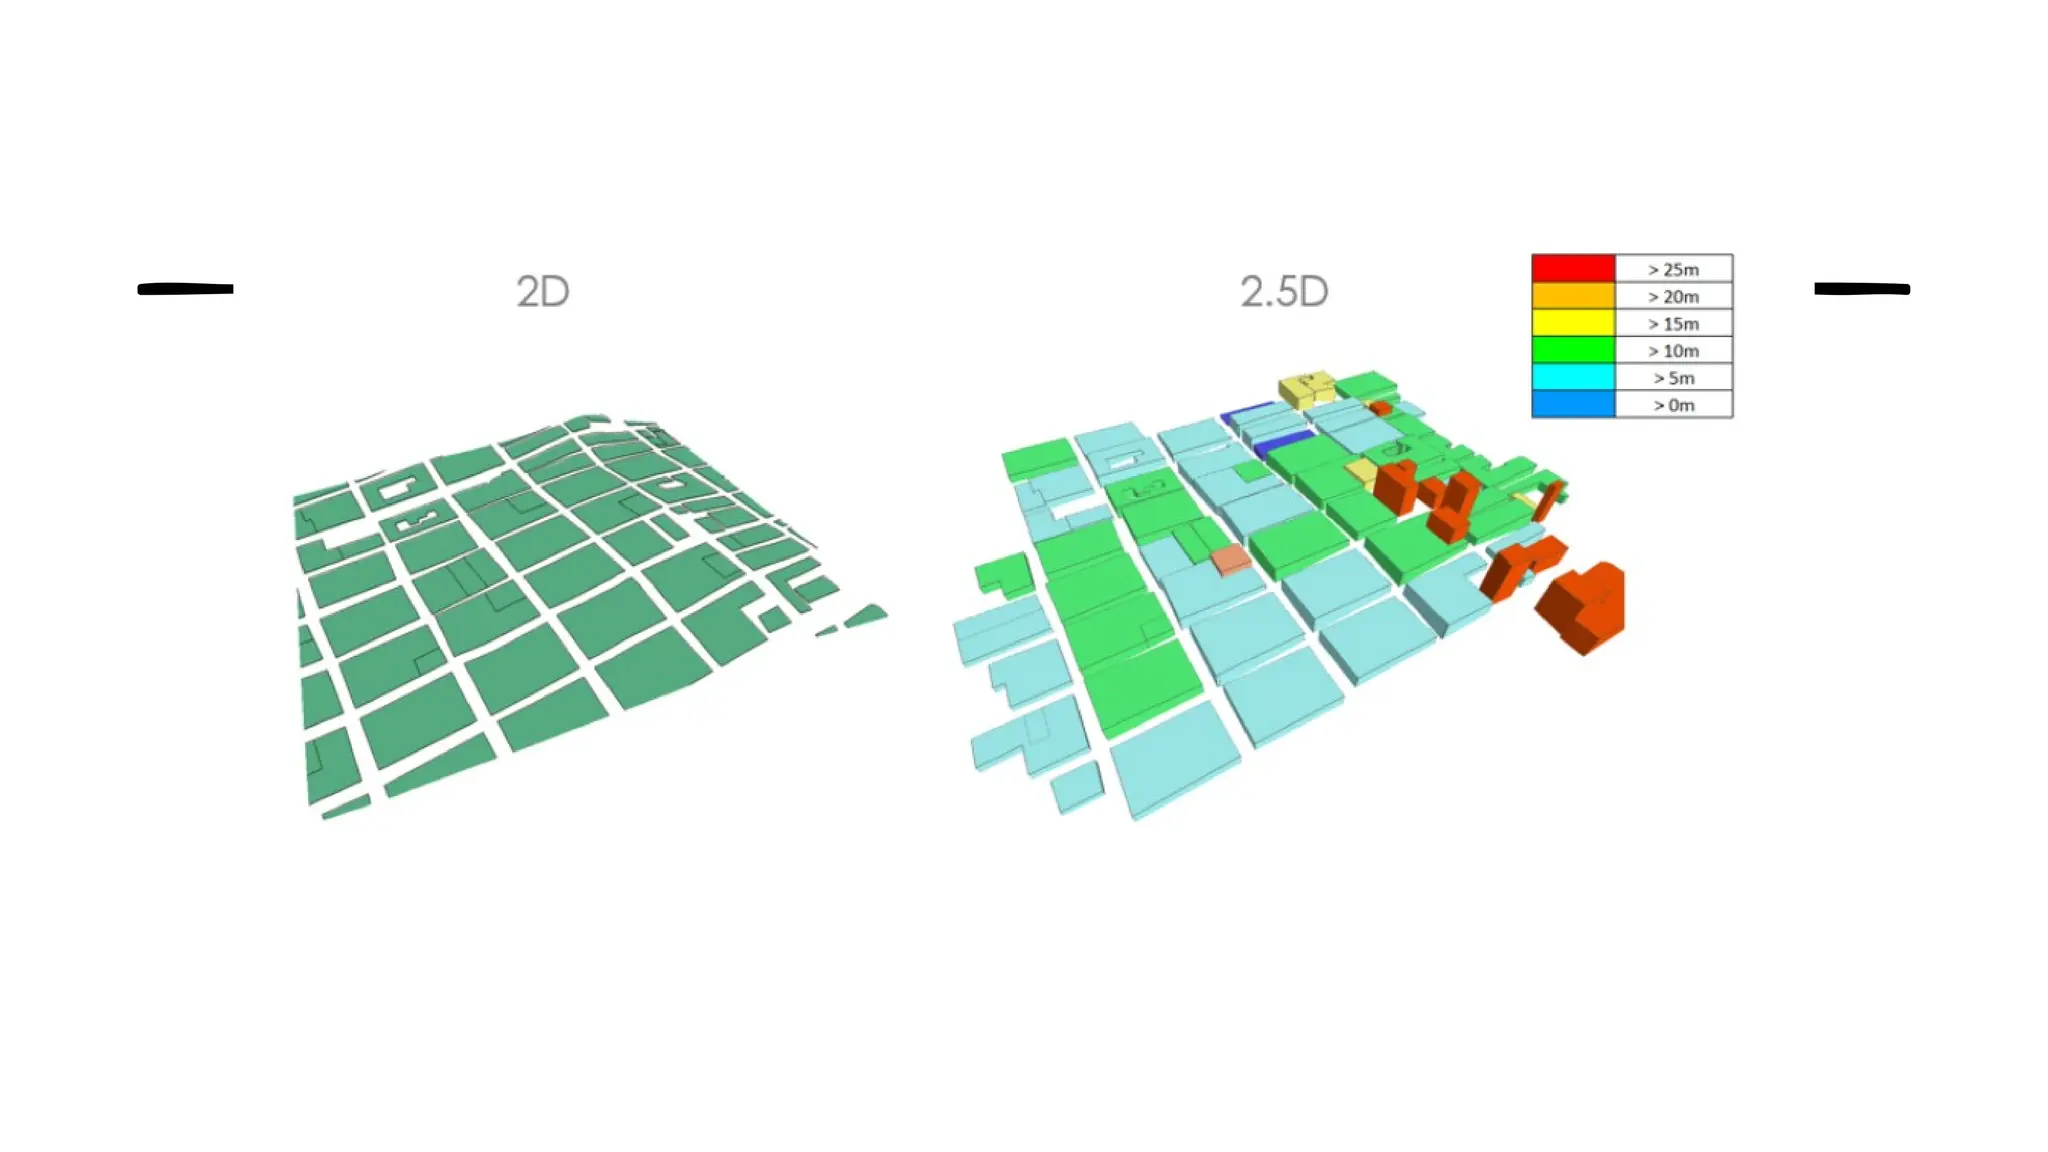
• 2.5Dmaps are an upgrade of
2D maps
• In the 2.5 D case, for the pair of x, y
co-ordinates, a third dimension is
integrated which is dependent
upon the x, y cod.
• Third dimension is defined by
predetermined equation:
• z = f (x, y)
• This third dimension could be
anything like height, soil data,
temp data, rainfall data
96.
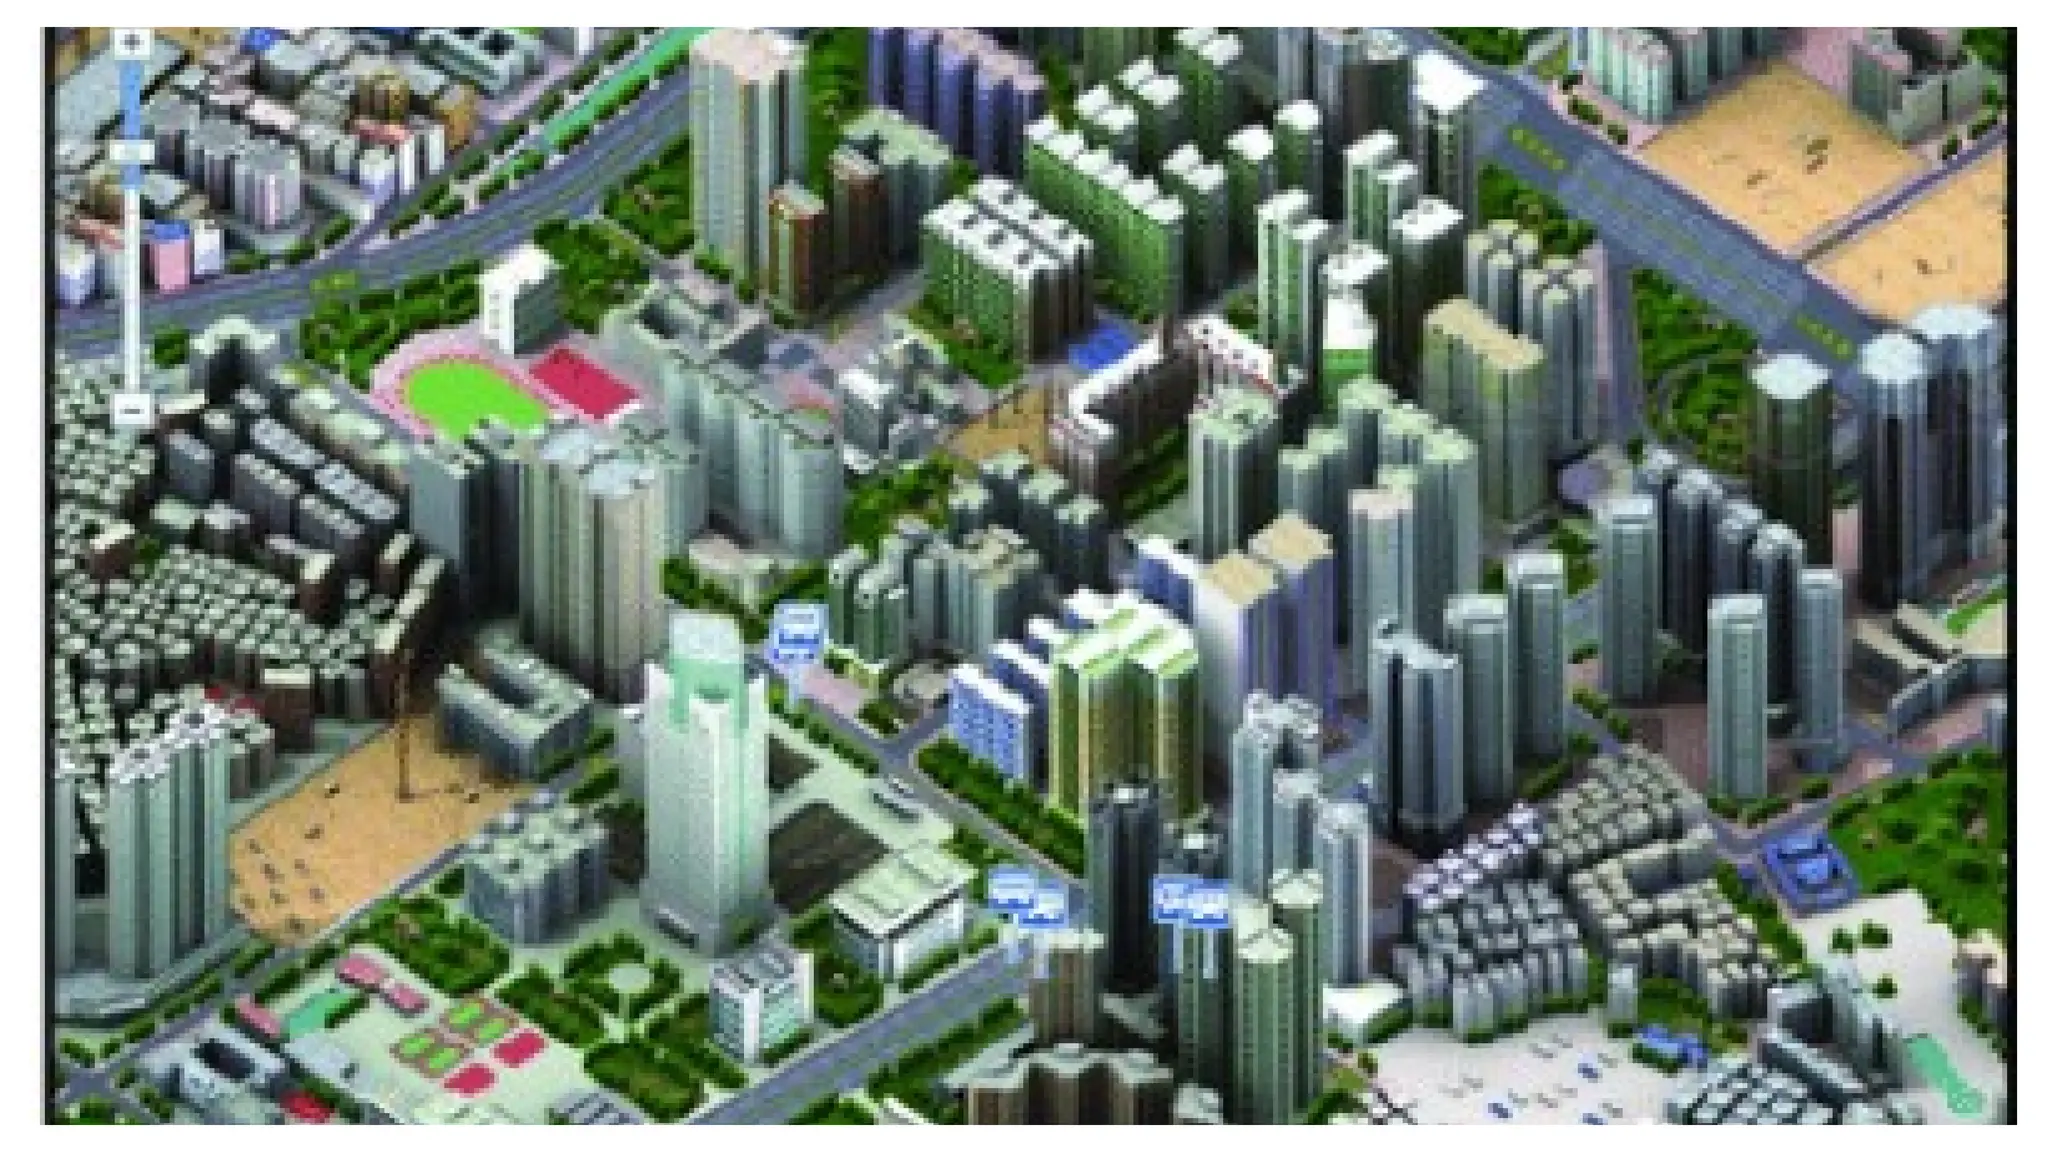
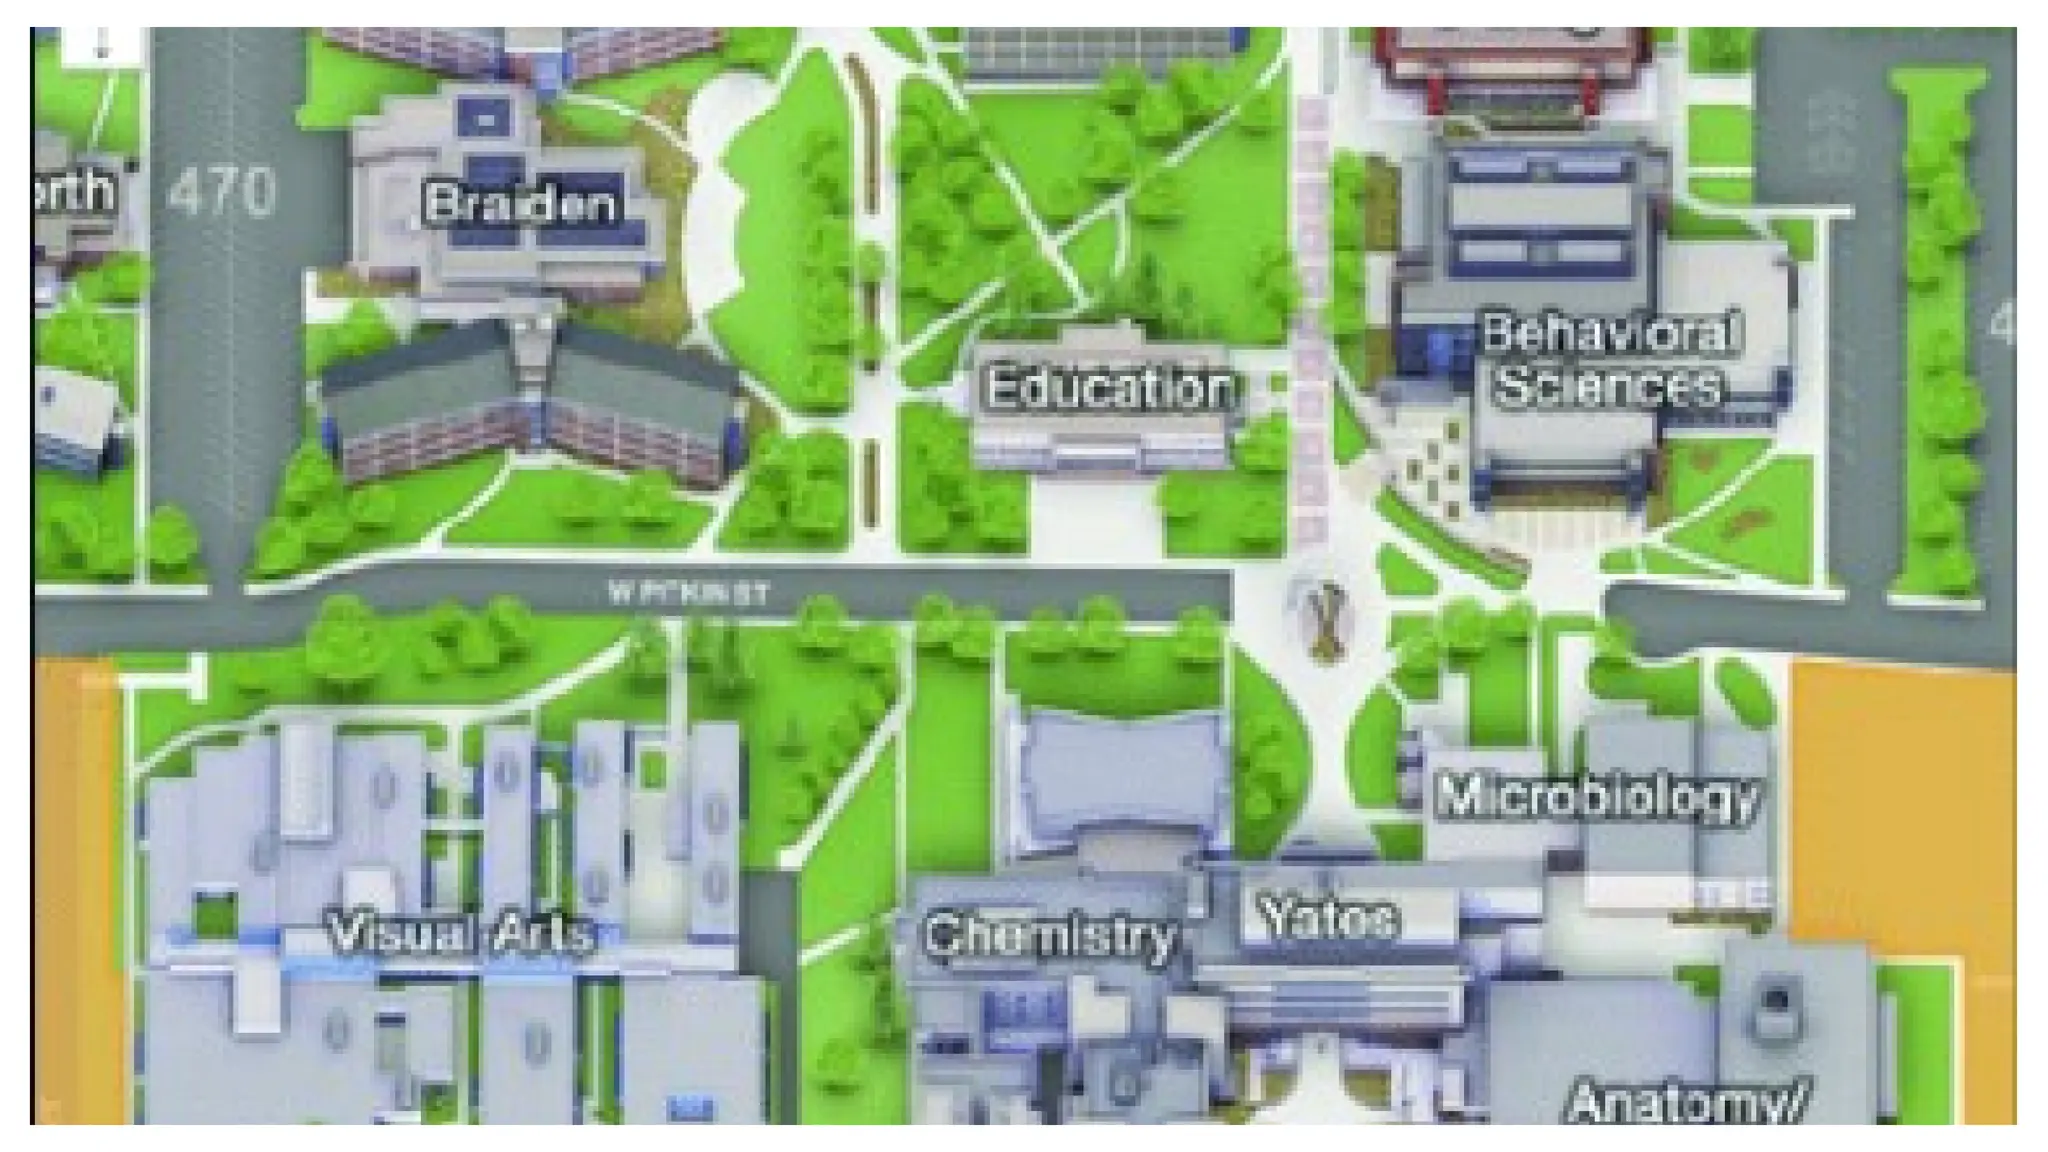
•In 2.5 D,objects appear to be in 3D, but
in reality map is not 3D.
97.
3D GIS
• Inthe 3-D case, for the same pair of x, y co-
ordinates,~ z co-ordinate is calculated
independently from the x, y pair.
• Example - Terrain Elevation Models(DEM), TIN
• Can therebe a 4D GIS?
• If yes, what could be the 4th dimension?
102.
It's
Time !
In 4DGIS, file formats
support the collection
of time data—
(Temporal Data)
In the vector data file
type (Google maps),
you can add
timestamps as
attributes in the layer
name.
With raster data files,
(Google earth image)
time information is
usually put into the file
4D GIS –an alternative to
conventional PERt &cpm
• Construction progress of the project should be
monitored at every time.
• Project monitoring acts as safety step in construction
projects which alerts and advices the organizations
about occurrence of construction failures and delays.
• It includes the process of collecting, analysing, and
recording information regarding the project.
105.
4D GIs inconstruction planning
and monitoring
• For better understanding of construction sequence
and for providing better visualization of the
construction progress planner makes use of 2D
drawings and integrates it with their corresponding
component schedules in GIS software .
• New advancements in GIS software are use of time
component which helps planners in depicting real
world components.
106.
• More theno. Of dimensions, more will be the
data and more complex the algorithms !