

![Thank You! Vikram Kole Head – Marketing [email_address]](https://image.slidesharecdn.com/get-one-single-view-1200472028353420-2/85/Get-One-Single-View-16-320.jpg)
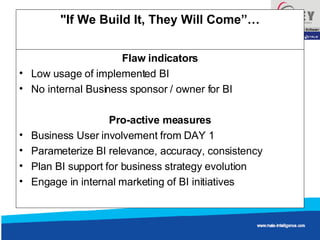
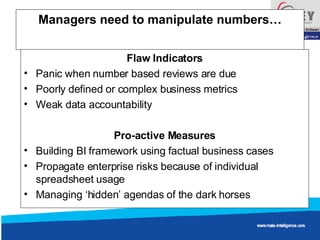
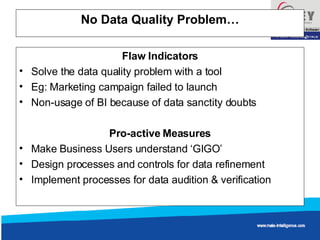
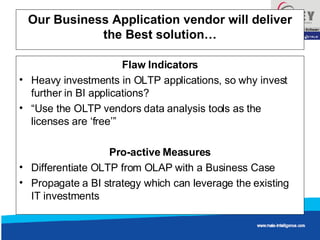
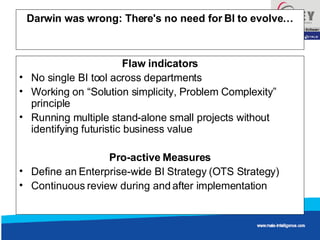
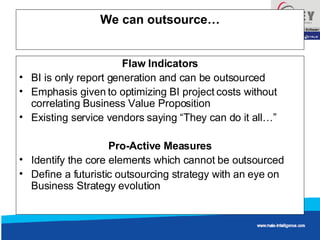
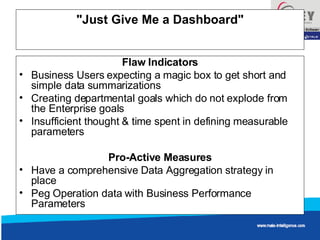
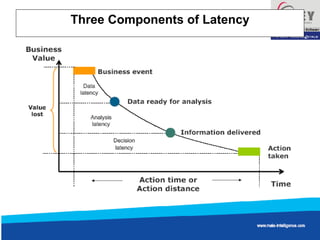
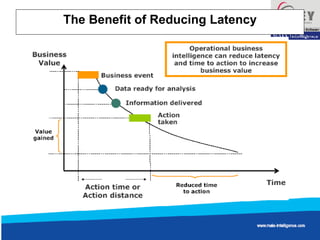
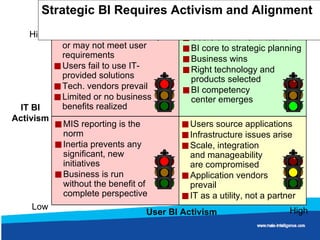
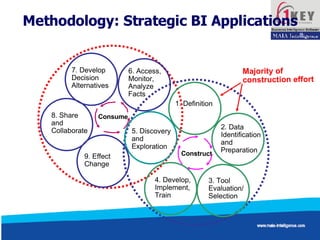
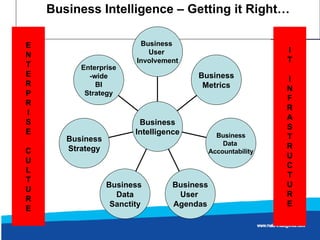

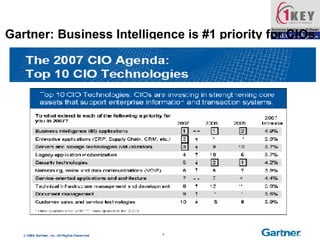
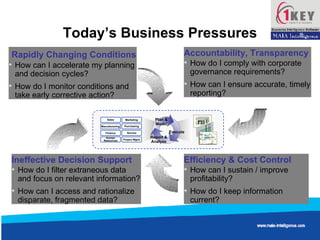
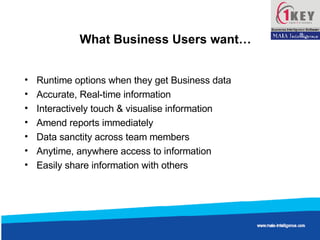
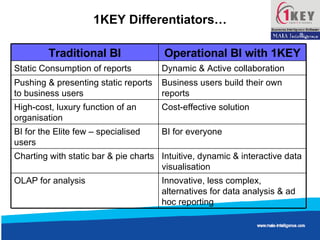
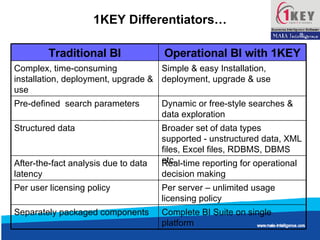
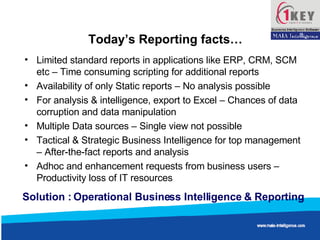
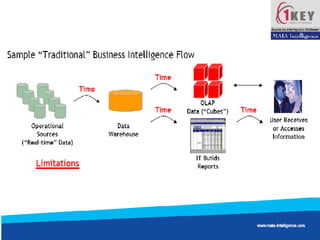
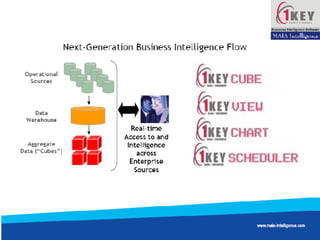
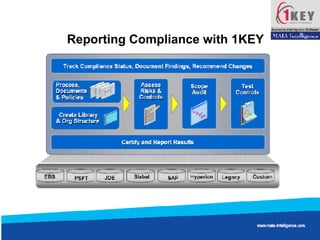
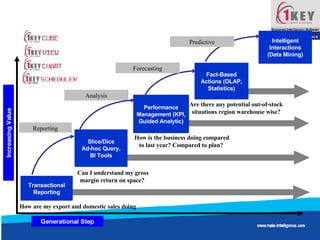
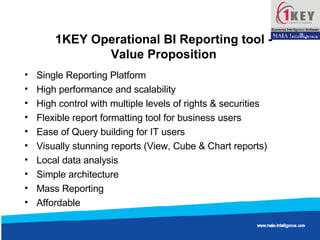
The document summarizes key points from a seminar on business intelligence organized by CSI Coimbatore Chapter. It discusses how operational business intelligence with 1KEY can provide real-time reporting, dynamic collaboration, intuitive data visualization, and be cost-effective for all users. It also cautions against common flaws when implementing business intelligence like lack of business user involvement, poor data quality, and not aligning BI with business strategy.


