SlideShare a Scribd company logo
March 2019 Activity Snapshot
One-Year Change in One-Year Change in
Closed Sales Median Sales Price
2
3
4
5
6
7
8
9
10
11
12
Monthly Indicators
- 3.6% + 4.4% + 1.5%
One-Year Change in
Changes in methodology were implemented in October 2012 to provide a more accurate count of inventory and related metrics. Due to MLS purging rules, activity before 2008 cannot be updated and therefore shifts in the trendlines may occur.
Current as of April 16, 2019. All data from the multiple listing services in the state of Georgia. Report © 2019 ShowingTime.
Pending Sales
Closed Sales
Days on Market Until Sale
Median Sales Price
Average Sales Price
Percent of Original List Price Received
In addition to the quandary of ongoing housing price increases and affordability
concerns in many U.S. markets, the first quarter of 2019 saw a fair share of
adverse weather as well. Sales totals were mixed across the nation and
sometimes dependent on what was a persistent wintry mix, especially in the
Great Plains, Midwest and Northeast. Meanwhile, new listings and total homes
for sale have been trending lower in year-over-year comparisons in many areas,
and last year's marks were already quite low.
New Listings decreased 1.1 percent to 18,483. Pending Sales were up 0.5
percent to 13,911. Inventory levels grew 1.5 percent to 41,463 units.
Prices continued to gain traction. The Median Sales Price increased 4.4 percent
to $222,000. Days on Market was down 9.1 percent to 60 days. Sellers were
encouraged as Months Supply of Inventory was down 5.3 percent to 3.6
months.
The Federal Reserve recently announced that no further interest rate hikes are
planned for 2019. Given the fact that the federal funds rate has increased nine
times over the past three years, this was welcome news for U.S. consumers,
which carry an approximate average of $6,000 in revolving credit card debt per
household. Fed actions also tend to affect mortgage rates, so the pause in rate
hikes was also welcome news to the residential real estate industry.
Homes for Sale
A research tool provided by the Georgia Association of REALTORS®.
Residential real estate activity composed of single-family properties,
townhomes and condominiums combined. Percent changes are
calculated using rounded figures.
Activity Overview
New Listings
Housing Affordability Index
Inventory of Homes for Sale
Months Supply of Inventory
Activity Overview
Key Metrics Historical Sparkbars 3-2018 3-2019 Percent Change YTD 2018 YTD 2019 Percent Change
Key metrics by report month and for year-to-date (YTD) starting from the first of the year.
New Listings 18,698 18,483 - 1.1% 49,386 + 4.6%
Pending Sales 13,837 13,911 + 0.5% 34,073 35,518 + 4.2%
47,230
+ 1.5%
Days on Market Until Sale 66 60 - 9.1% 69 65 - 5.8%
Closed Sales 11,968 11,536 - 3.6% 27,378 27,785
+ 4.9%
Average Sales Price $256,398 $264,882 + 3.3% $248,456 $256,806 + 3.4%
Median Sales Price $212,633 $222,000 + 4.4% $205,000 $215,000
Inventory of Homes for Sale 40,848 41,463 + 1.5% -- --
Months Supply of Inventory 3.8 3.6 - 5.3% --
Current as of April 16, 2019. All data from the multiple listing services in the state of Georgia. Report © 2019 ShowingTime. | 2
- 0.3%
Housing Affordability Index 175 170 - 2.9% 182 176 - 3.3%
Pct. of Orig. Price Received 96.4% 96.0% - 0.4% 96.0% 95.7%
--
-- --
3-2016 3-2017 3-2018 3-2019
3-2016 3-2017 3-2018 3-2019
3-2016 3-2017 3-2018 3-2019
3-2016 3-2017 3-2018 3-2019
3-2016 3-2017 3-2018 3-2019
3-2016 3-2017 3-2018 3-2019
3-2016 3-2017 3-2018 3-2019
3-2016 3-2017 3-2018 3-2019
3-2016 3-2017 3-2018 3-2019
3-2016 3-2017 3-2018 3-2019
New Listings
Prior Year Percent Change
April 2018 18,462 16,079 +14.8%
May 2018 19,043 17,699 +7.6%
June 2018 19,019 17,465 +8.9%
July 2018 17,239 15,556 +10.8%
August 2018 17,519 15,870 +10.4%
September 2018 15,156 12,577 +20.5%
October 2018 16,261 13,793 +17.9%
November 2018 12,533 11,764 +6.5%
December 2018 9,108 8,794 +3.6%
January 2019 15,811 13,387 +18.1%
February 2019 15,092 15,145 -0.3%
March 2019 18,483 18,698 -1.1%
12-Month Avg 16,144 14,736 +9.6%
Historical New Listings by Month
Current as of April 16, 2019. All data from the multiple listing services in the state of Georgia. Report © 2019 ShowingTime. | 3
A count of the properties that have been newly listed on the market in a given month.
New Listings
18,136 18,698 18,483
2017 2018 2019
March
6,000
8,000
10,000
12,000
14,000
16,000
18,000
20,000
1-2012 1-2013 1-2014 1-2015 1-2016 1-2017 1-2018 1-2019
45,027
47,230
49,386
2017 2018 2019
Year to Date
+ 4.6%+ 3.1% - 1.1% + 4.9%+ 6.6% + 5.0%
Pending Sales
Prior Year Percent Change
April 2018 13,852 11,718 +18.2%
May 2018 13,685 12,199 +12.2%
June 2018 12,845 11,925 +7.7%
July 2018 12,406 11,273 +10.1%
August 2018 12,144 11,258 +7.9%
September 2018 10,320 9,061 +13.9%
October 2018 10,626 10,166 +4.5%
November 2018 8,901 8,918 -0.2%
December 2018 7,376 7,480 -1.4%
January 2019 10,347 9,629 +7.5%
February 2019 11,260 10,607 +6.2%
March 2019 13,911 13,837 +0.5%
12-Month Avg 11,473 10,673 +7.5%
Historical Pending Sales by Month
Current as of April 16, 2019. All data from the multiple listing services in the state of Georgia. Report © 2019 ShowingTime. | 4
A count of the properties on which offers have been accepted in a given month.
Pending Sales
12,703
13,837 13,911
2017 2018 2019
March
4,000
6,000
8,000
10,000
12,000
14,000
1-2012 1-2013 1-2014 1-2015 1-2016 1-2017 1-2018 1-2019
31,512
34,073 35,518
2017 2018 2019
Year to Date
+ 4.2%+ 8.9% + 0.5% + 8.1%+ 8.9% + 9.1%
Closed Sales
Prior Year Percent Change
April 2018 12,225 10,404 +17.5%
May 2018 14,091 12,502 +12.7%
June 2018 14,175 13,155 +7.8%
July 2018 13,240 11,462 +15.5%
August 2018 13,315 11,953 +11.4%
September 2018 10,780 10,220 +5.5%
October 2018 11,142 10,033 +11.1%
November 2018 10,186 9,352 +8.9%
December 2018 9,580 9,857 -2.8%
January 2019 7,313 7,212 +1.4%
February 2019 8,936 8,198 +9.0%
March 2019 11,536 11,968 -3.6%
12-Month Avg 11,377 10,526 +8.1%
Historical Closed Sales by Month
Current as of April 16, 2019. All data from the multiple listing services in the state of Georgia. Report © 2019 ShowingTime. | 5
A count of the actual sales that closed in a given month.
Closed Sales
11,532 11,968 11,536
2017 2018 2019
March
4,000
6,000
8,000
10,000
12,000
14,000
16,000
1-2012 1-2013 1-2014 1-2015 1-2016 1-2017 1-2018 1-2019
25,838
27,378 27,785
2017 2018 2019
Year to Date
+ 1.5%+ 3.8% - 3.6% + 6.0%+ 17.1% + 10.6%
Days on Market Until Sale
Prior Year Percent Change
April 2018 60 65 -7.7%
May 2018 55 59 -6.8%
June 2018 53 57 -7.0%
July 2018 52 55 -5.5%
August 2018 52 57 -8.8%
September 2018 55 60 -8.3%
October 2018 55 61 -9.8%
November 2018 58 63 -7.9%
December 2018 62 67 -7.5%
January 2019 67 72 -6.9%
February 2019 68 72 -5.6%
March 2019 60 66 -9.1%
12-Month Avg* 57 62 -8.1%
Historical Days on Market Until Sale by Month
Current as of April 16, 2019. All data from the multiple listing services in the state of Georgia. Report © 2019 ShowingTime. | 6
Average number of days between when a property is listed and when an offer is accepted in a given month.
Days on Market
* Average Days on Market of all properties from April 2018 through March 2019.
This is not the average of the individual figures above.
71
66
60
2017 2018 2019
March
50
60
70
80
90
100
110
1-2012 1-2013 1-2014 1-2015 1-2016 1-2017 1-2018 1-2019
75
69
65
2017 2018 2019
Year to Date
- 5.8%- 7.0% - 9.1% - 8.0%- 12.3% - 10.7%
Median Sales Price
Prior Year Percent Change
April 2018 $215,000 $196,250 +9.6%
May 2018 $220,000 $200,000 +10.0%
June 2018 $226,000 $208,000 +8.7%
July 2018 $224,900 $207,400 +8.4%
August 2018 $214,900 $200,000 +7.5%
September 2018 $217,500 $196,900 +10.5%
October 2018 $214,952 $198,990 +8.0%
November 2018 $213,075 $195,000 +9.3%
December 2018 $215,000 $205,000 +4.9%
January 2019 $210,000 $195,000 +7.7%
February 2019 $210,700 $201,349 +4.6%
March 2019 $222,000 $212,633 +4.4%
12-Month Med* $218,000 $200,750 +8.6%
Historical Median Sales Price by Month
Current as of April 16, 2019. All data from the multiple listing services in the state of Georgia. Report © 2019 ShowingTime. | 7
Point at which half of the sales sold for more and half sold for less, not accounting for seller concessions, in a given month.
Median Sales Price
* Median Sales Price of all properties from April 2018 through March 2019. This is
not the average of the individual figures above.
$192,000
$212,633
$222,000
2017 2018 2019
March
$75,000
$100,000
$125,000
$150,000
$175,000
$200,000
$225,000
$250,000
1-2012 1-2013 1-2014 1-2015 1-2016 1-2017 1-2018 1-2019
$185,900
$205,000
$215,000
2017 2018 2019
Year to Date
+ 4.9%+ 10.7% + 4.4% + 10.3%+ 9.1% + 9.4%
Average Sales Price
Prior Year Percent Change
April 2018 $262,395 $244,353 +7.4%
May 2018 $270,251 $250,560 +7.9%
June 2018 $277,311 $255,143 +8.7%
July 2018 $271,487 $256,389 +5.9%
August 2018 $261,108 $246,973 +5.7%
September 2018 $260,396 $242,078 +7.6%
October 2018 $259,207 $244,230 +6.1%
November 2018 $260,420 $244,324 +6.6%
December 2018 $256,030 $249,589 +2.6%
January 2019 $250,246 $240,100 +4.2%
February 2019 $251,795 $244,292 +3.1%
March 2019 $264,882 $256,398 +3.3%
12-Month Avg* $263,361 $248,527 +6.0%
Historical Average Sales Price by Month
Current as of April 16, 2019. All data from the multiple listing services in the state of Georgia. Report © 2019 ShowingTime. | 8
Average sales price for all closed sales, not accounting for seller concessions, in a given month.
Avg. Sales Price
* Avg. Sales Price of all properties from April 2018 through March 2019. This is not
the average of the individual figures above.
$236,588
$256,398 $264,882
2017 2018 2019
March
$100,000
$150,000
$200,000
$250,000
$300,000
1-2012 1-2013 1-2014 1-2015 1-2016 1-2017 1-2018 1-2019
$229,295
$248,456 $256,806
2017 2018 2019
Year to Date
+ 3.4%+ 8.4% + 3.3% + 8.4%+ 6.9% + 7.3%
Percent of Original List Price Received
Prior Year Percent Change
April 2018 96.9% 96.1% +0.8%
May 2018 97.2% 96.4% +0.8%
June 2018 97.1% 96.4% +0.7%
July 2018 97.0% 96.3% +0.7%
August 2018 96.4% 95.8% +0.6%
September 2018 96.1% 95.8% +0.3%
October 2018 95.8% 95.5% +0.3%
November 2018 95.6% 95.7% -0.1%
December 2018 95.6% 95.6% 0.0%
January 2019 95.2% 95.4% -0.2%
February 2019 95.6% 96.0% -0.4%
March 2019 96.0% 96.4% -0.4%
12-Month Avg* 96.3% 96.0% +0.3%
Historical Percent of Original List Price Received by Month
Current as of April 16, 2019. All data from the multiple listing services in the state of Georgia. Report © 2019 ShowingTime. | 9
Percentage found when dividing a property’s sales price by its original list price, then taking the average for all properties sold
in a given month, not accounting for seller concessions.
Pct. of Orig. Price Received
* Average Pct. of Orig. Price Received for all properties from April 2018 through
March 2019. This is not the average of the individual figures above.
95.7% 96.4% 96.0%
2017 2018 2019
March
88%
90%
92%
94%
96%
98%
1-2012 1-2013 1-2014 1-2015 1-2016 1-2017 1-2018 1-2019
95.2% 96.0% 95.7%
2017 2018 2019
Year to Date
- 0.3%+ 0.7% - 0.4% + 0.8%+ 0.8% + 1.0%
Housing Affordability Index
Prior Year Percent Change
April 2018 170 197 -13.7%
May 2018 166 195 -14.9%
June 2018 163 187 -12.8%
July 2018 164 189 -13.2%
August 2018 170 197 -13.7%
September 2018 163 200 -18.5%
October 2018 156 195 -20.0%
November 2018 160 201 -20.4%
December 2018 172 189 -9.0%
January 2019 176 192 -8.3%
February 2019 178 186 -4.3%
March 2019 170 175 -2.9%
12-Month Avg 167 167 0.0%
Historical Housing Affordability Index by Month
Current as of April 16, 2019. All data from the multiple listing services in the state of Georgia. Report © 2019 ShowingTime. | 10
This index measures housing affordability for the region. For example, an index of 120 means the median household income is 120% of
what is necessary to qualify for the median-priced home under prevailing interest rates. A higher number means greater affordability.
Affordability Index
197
175 170
2017 2018 2019
March
100
200
300
400
500
1-2012 1-2013 1-2014 1-2015 1-2016 1-2017 1-2018 1-2019
204
182 176
2017 2018 2019
Year to Date
- 3.3%- 11.2% - 2.9% - 10.8%- 12.4% - 12.4%
Inventory of Homes for Sale
Prior Year Percent Change
April 2018 41,859 42,701 -2.0%
May 2018 43,302 44,195 -2.0%
June 2018 45,167 45,695 -1.2%
July 2018 45,394 45,718 -0.7%
August 2018 45,847 45,419 +0.9%
September 2018 45,826 44,422 +3.2%
October 2018 46,114 43,288 +6.5%
November 2018 44,735 41,934 +6.7%
December 2018 41,745 39,228 +6.4%
January 2019 41,496 38,510 +7.8%
February 2019 41,234 39,821 +3.5%
March 2019 41,463 40,848 +1.5%
12-Month Avg 43,682 42,648 +2.4%
Historical Inventory of Homes for Sale by Month
Current as of April 16, 2019. All data from the multiple listing services in the state of Georgia. Report © 2019 ShowingTime. | 11
The number of properties available for sale in active status at the end of a given month.
Homes for Sale
42,112 40,848 41,463
2017 2018 2019
March
37,500
40,000
42,500
45,000
47,500
50,000
52,500
55,000
1-2012 1-2013 1-2014 1-2015 1-2016 1-2017 1-2018 1-2019
- 3.0% + 1.5%- 8.7%
Months Supply of Inventory
Prior Year Percent Change
April 2018 3.9 4.2 -7.1%
May 2018 3.9 4.4 -11.4%
June 2018 4.1 4.5 -8.9%
July 2018 4.1 4.5 -8.9%
August 2018 4.1 4.4 -6.8%
September 2018 4.0 4.3 -7.0%
October 2018 4.1 4.2 -2.4%
November 2018 3.9 4.0 -2.5%
December 2018 3.7 3.8 -2.6%
January 2019 3.6 3.7 -2.7%
February 2019 3.6 3.8 -5.3%
March 2019 3.6 3.8 -5.3%
12-Month Avg 3.9 4.1 -4.9%
Historical Months Supply of Inventory by Month
Current as of April 16, 2019. All data from the multiple listing services in the state of Georgia. Report © 2019 ShowingTime. | 12
The inventory of homes for sale at the end of a given month, divided by the average monthly pending sales from the last 12 months.
Months Supply
* Months Supply for all properties from April 2018 through March 2019. This is not
the average of the individual figures above.
4.2
3.8 3.6
2017 2018 2019
March
3.0
4.0
5.0
6.0
7.0
8.0
1-2013 1-2014 1-2015 1-2016 1-2017 1-2018 1-2019
- 9.5% - 5.3%- 16.0%

More Related Content

What's hot

Greater Boston Association of Realtors Monthly Market Insights Report July 2019
Greater Boston Association of Realtors Monthly Market Insights Report July 2019Greater Boston Association of Realtors Monthly Market Insights Report July 2019
Greater Boston Association of Realtors Monthly Market Insights Report July 2019
Joe Schutt
 
Gbar monthly-market-insights-report-september-2019v2
Gbar monthly-market-insights-report-september-2019v2Gbar monthly-market-insights-report-september-2019v2
Gbar monthly-market-insights-report-september-2019v2
Joe Schutt
 
Greater Boston Association of Realtors Monthly Market Insights Report, August...
Greater Boston Association of Realtors Monthly Market Insights Report, August...Greater Boston Association of Realtors Monthly Market Insights Report, August...
Greater Boston Association of Realtors Monthly Market Insights Report, August...
Joe Schutt
 
San Francisco Market Focus Report Aug 2018
San Francisco Market Focus Report Aug 2018San Francisco Market Focus Report Aug 2018
San Francisco Market Focus Report Aug 2018
Ronny Budiutama
 
January 2018 San Francisco Market Update
January 2018 San Francisco Market UpdateJanuary 2018 San Francisco Market Update
January 2018 San Francisco Market Update
Ronny Budiutama
 
Gbar monthly-market-insights-report-june-2019
Gbar monthly-market-insights-report-june-2019Gbar monthly-market-insights-report-june-2019
Gbar monthly-market-insights-report-june-2019
Joe Schutt
 
Massachusetts statewide closed sales for condos and single family homes
Massachusetts statewide closed sales for condos and single family homesMassachusetts statewide closed sales for condos and single family homes
Massachusetts statewide closed sales for condos and single family homes
Michael Mahoney
 
San Francisco Market Focus Report Jan 2020
San Francisco Market Focus Report Jan 2020San Francisco Market Focus Report Jan 2020
San Francisco Market Focus Report Jan 2020
Ronny Budiutama
 
Charlotte, North Carolina Real Estate Update August
Charlotte, North Carolina Real Estate Update AugustCharlotte, North Carolina Real Estate Update August
Charlotte, North Carolina Real Estate Update August
Scott Browder
 
Annual report on sf county housing market
Annual report on sf county housing marketAnnual report on sf county housing market
Annual report on sf county housing market
Ronny Budiutama
 
May 2018 Market Reports
May 2018 Market ReportsMay 2018 Market Reports
May 2018 Market Reports
Referred Realty Group
 
Charlotte region -monthly indicators - feb 2018
Charlotte region -monthly indicators - feb 2018Charlotte region -monthly indicators - feb 2018
Charlotte region -monthly indicators - feb 2018
Scott Browder
 
Charlotte Region Weekly Real Estate Market Activity Report
Charlotte Region Weekly Real Estate Market Activity ReportCharlotte Region Weekly Real Estate Market Activity Report
Charlotte Region Weekly Real Estate Market Activity Report
Scott Browder
 
Charlotte Real Estate Market Overview
Charlotte Real Estate Market OverviewCharlotte Real Estate Market Overview
Charlotte Real Estate Market Overview
Scott Browder
 
San francisco market focus 2018 overview
San francisco market focus 2018 overviewSan francisco market focus 2018 overview
San francisco market focus 2018 overview
Ronny Budiutama
 
San Francisco market report May 2020
San Francisco market report May 2020San Francisco market report May 2020
San Francisco market report May 2020
Ronny Budiutama
 
February 2019 Greater Boston Real Estate Market Trends
February 2019 Greater Boston Real Estate Market TrendsFebruary 2019 Greater Boston Real Estate Market Trends
February 2019 Greater Boston Real Estate Market Trends
Joe Schutt
 
March 2018 Market Reports for the Gallatin Valley
March 2018 Market Reports for the Gallatin ValleyMarch 2018 Market Reports for the Gallatin Valley
March 2018 Market Reports for the Gallatin Valley
Referred Realty Group
 
TORONTO REGIONAL REAL ESTATE BOARD's - MARKET WATCH - FOR DECEMBER 2019 & YEA...
TORONTO REGIONAL REAL ESTATE BOARD's - MARKET WATCH - FOR DECEMBER 2019 & YEA...TORONTO REGIONAL REAL ESTATE BOARD's - MARKET WATCH - FOR DECEMBER 2019 & YEA...
TORONTO REGIONAL REAL ESTATE BOARD's - MARKET WATCH - FOR DECEMBER 2019 & YEA...
Shawn Venasse
 
San Francisco Market Focus March 2017
San Francisco Market Focus March 2017San Francisco Market Focus March 2017
San Francisco Market Focus March 2017
Ronny Budiutama
 

What's hot (20)

Greater Boston Association of Realtors Monthly Market Insights Report July 2019
Greater Boston Association of Realtors Monthly Market Insights Report July 2019Greater Boston Association of Realtors Monthly Market Insights Report July 2019
Greater Boston Association of Realtors Monthly Market Insights Report July 2019
 
Gbar monthly-market-insights-report-september-2019v2
Gbar monthly-market-insights-report-september-2019v2Gbar monthly-market-insights-report-september-2019v2
Gbar monthly-market-insights-report-september-2019v2
 
Greater Boston Association of Realtors Monthly Market Insights Report, August...
Greater Boston Association of Realtors Monthly Market Insights Report, August...Greater Boston Association of Realtors Monthly Market Insights Report, August...
Greater Boston Association of Realtors Monthly Market Insights Report, August...
 
San Francisco Market Focus Report Aug 2018
San Francisco Market Focus Report Aug 2018San Francisco Market Focus Report Aug 2018
San Francisco Market Focus Report Aug 2018
 
January 2018 San Francisco Market Update
January 2018 San Francisco Market UpdateJanuary 2018 San Francisco Market Update
January 2018 San Francisco Market Update
 
Gbar monthly-market-insights-report-june-2019
Gbar monthly-market-insights-report-june-2019Gbar monthly-market-insights-report-june-2019
Gbar monthly-market-insights-report-june-2019
 
Massachusetts statewide closed sales for condos and single family homes
Massachusetts statewide closed sales for condos and single family homesMassachusetts statewide closed sales for condos and single family homes
Massachusetts statewide closed sales for condos and single family homes
 
San Francisco Market Focus Report Jan 2020
San Francisco Market Focus Report Jan 2020San Francisco Market Focus Report Jan 2020
San Francisco Market Focus Report Jan 2020
 
Charlotte, North Carolina Real Estate Update August
Charlotte, North Carolina Real Estate Update AugustCharlotte, North Carolina Real Estate Update August
Charlotte, North Carolina Real Estate Update August
 
Annual report on sf county housing market
Annual report on sf county housing marketAnnual report on sf county housing market
Annual report on sf county housing market
 
May 2018 Market Reports
May 2018 Market ReportsMay 2018 Market Reports
May 2018 Market Reports
 
Charlotte region -monthly indicators - feb 2018
Charlotte region -monthly indicators - feb 2018Charlotte region -monthly indicators - feb 2018
Charlotte region -monthly indicators - feb 2018
 
Charlotte Region Weekly Real Estate Market Activity Report
Charlotte Region Weekly Real Estate Market Activity ReportCharlotte Region Weekly Real Estate Market Activity Report
Charlotte Region Weekly Real Estate Market Activity Report
 
Charlotte Real Estate Market Overview
Charlotte Real Estate Market OverviewCharlotte Real Estate Market Overview
Charlotte Real Estate Market Overview
 
San francisco market focus 2018 overview
San francisco market focus 2018 overviewSan francisco market focus 2018 overview
San francisco market focus 2018 overview
 
San Francisco market report May 2020
San Francisco market report May 2020San Francisco market report May 2020
San Francisco market report May 2020
 
February 2019 Greater Boston Real Estate Market Trends
February 2019 Greater Boston Real Estate Market TrendsFebruary 2019 Greater Boston Real Estate Market Trends
February 2019 Greater Boston Real Estate Market Trends
 
March 2018 Market Reports for the Gallatin Valley
March 2018 Market Reports for the Gallatin ValleyMarch 2018 Market Reports for the Gallatin Valley
March 2018 Market Reports for the Gallatin Valley
 
TORONTO REGIONAL REAL ESTATE BOARD's - MARKET WATCH - FOR DECEMBER 2019 & YEA...
TORONTO REGIONAL REAL ESTATE BOARD's - MARKET WATCH - FOR DECEMBER 2019 & YEA...TORONTO REGIONAL REAL ESTATE BOARD's - MARKET WATCH - FOR DECEMBER 2019 & YEA...
TORONTO REGIONAL REAL ESTATE BOARD's - MARKET WATCH - FOR DECEMBER 2019 & YEA...
 
San Francisco Market Focus March 2017
San Francisco Market Focus March 2017San Francisco Market Focus March 2017
San Francisco Market Focus March 2017
 

Similar to Georgia Housing Market Snapshot For March 2019

Charlotte region weekly market activity report
Charlotte region weekly market activity reportCharlotte region weekly market activity report
Charlotte region weekly market activity report
Scott Browder
 
San Francisco Market Focus Report April 2019
San Francisco Market Focus Report April 2019San Francisco Market Focus Report April 2019
San Francisco Market Focus Report April 2019
Ronny Budiutama
 
San Francisco Market Focus Report August 2019
San Francisco Market Focus Report August 2019San Francisco Market Focus Report August 2019
San Francisco Market Focus Report August 2019
Ronny Budiutama
 
San Francisco Market Focus Report July 2019
San Francisco Market Focus Report July 2019San Francisco Market Focus Report July 2019
San Francisco Market Focus Report July 2019
Ronny Budiutama
 
San Francisco Market Focus Report December 2018
San Francisco Market Focus Report December 2018San Francisco Market Focus Report December 2018
San Francisco Market Focus Report December 2018
Ronny Budiutama
 
San Fancisco Market Focus Report June 2019
San Fancisco Market Focus Report June 2019San Fancisco Market Focus Report June 2019
San Fancisco Market Focus Report June 2019
Ronny Budiutama
 
San Francisco Market Focus Report Feb 2019
San Francisco Market Focus Report Feb 2019San Francisco Market Focus Report Feb 2019
San Francisco Market Focus Report Feb 2019
Ronny Budiutama
 
Georgia Housing Market Snapshot: June 2018. Courtesy of the Georgia Associat...
Georgia Housing Market Snapshot: June 2018.  Courtesy of the Georgia Associat...Georgia Housing Market Snapshot: June 2018.  Courtesy of the Georgia Associat...
Georgia Housing Market Snapshot: June 2018. Courtesy of the Georgia Associat...
Arthur Prescott
 
Georgia Housing Market Snapshot For September 2018
Georgia Housing Market Snapshot For September 2018Georgia Housing Market Snapshot For September 2018
Georgia Housing Market Snapshot For September 2018
Arthur Prescott
 
San Francisco Market Focus Report Jan 2019
San Francisco Market Focus Report Jan 2019San Francisco Market Focus Report Jan 2019
San Francisco Market Focus Report Jan 2019
Ronny Budiutama
 
Greater Boston Association of Realtors Monthly Market Insights Report July 2019
Greater Boston Association of Realtors Monthly Market Insights Report July 2019Greater Boston Association of Realtors Monthly Market Insights Report July 2019
Greater Boston Association of Realtors Monthly Market Insights Report July 2019
Joe Schutt
 
San Francisco market report July 2020
San Francisco market report July 2020San Francisco market report July 2020
San Francisco market report July 2020
Ronny Budiutama
 
Georgia Housing Market Snapshot For July. Gar mmi 2018-07
Georgia Housing Market Snapshot For July. Gar mmi 2018-07Georgia Housing Market Snapshot For July. Gar mmi 2018-07
Georgia Housing Market Snapshot For July. Gar mmi 2018-07
Arthur Prescott
 
Bozeman and Surrounding Communities June 2019 Market Report
Bozeman and Surrounding Communities June 2019 Market ReportBozeman and Surrounding Communities June 2019 Market Report
Bozeman and Surrounding Communities June 2019 Market Report
Referred Realty Group
 
San Francisco market report April 2020
San Francisco market report April 2020San Francisco market report April 2020
San Francisco market report April 2020
Ronny Budiutama
 
San Francisco market focus report December 2019
San Francisco market focus report December 2019San Francisco market focus report December 2019
San Francisco market focus report December 2019
Ronny Budiutama
 
May 2019 Gallatin Valley Market Reports
May 2019 Gallatin Valley Market ReportsMay 2019 Gallatin Valley Market Reports
May 2019 Gallatin Valley Market Reports
Referred Realty Group
 
San Francisco market report June 2020
San Francisco market report June 2020San Francisco market report June 2020
San Francisco market report June 2020
Ronny Budiutama
 
Gbar monthly-market-insight-report-jan20
Gbar monthly-market-insight-report-jan20Gbar monthly-market-insight-report-jan20
Gbar monthly-market-insight-report-jan20
Joe Schutt
 
Gbar monthly-market-insight-report-jan20
Gbar monthly-market-insight-report-jan20Gbar monthly-market-insight-report-jan20
Gbar monthly-market-insight-report-jan20
BryanPrendeville
 

Similar to Georgia Housing Market Snapshot For March 2019 (20)

Charlotte region weekly market activity report
Charlotte region weekly market activity reportCharlotte region weekly market activity report
Charlotte region weekly market activity report
 
San Francisco Market Focus Report April 2019
San Francisco Market Focus Report April 2019San Francisco Market Focus Report April 2019
San Francisco Market Focus Report April 2019
 
San Francisco Market Focus Report August 2019
San Francisco Market Focus Report August 2019San Francisco Market Focus Report August 2019
San Francisco Market Focus Report August 2019
 
San Francisco Market Focus Report July 2019
San Francisco Market Focus Report July 2019San Francisco Market Focus Report July 2019
San Francisco Market Focus Report July 2019
 
San Francisco Market Focus Report December 2018
San Francisco Market Focus Report December 2018San Francisco Market Focus Report December 2018
San Francisco Market Focus Report December 2018
 
San Fancisco Market Focus Report June 2019
San Fancisco Market Focus Report June 2019San Fancisco Market Focus Report June 2019
San Fancisco Market Focus Report June 2019
 
San Francisco Market Focus Report Feb 2019
San Francisco Market Focus Report Feb 2019San Francisco Market Focus Report Feb 2019
San Francisco Market Focus Report Feb 2019
 
Georgia Housing Market Snapshot: June 2018. Courtesy of the Georgia Associat...
Georgia Housing Market Snapshot: June 2018.  Courtesy of the Georgia Associat...Georgia Housing Market Snapshot: June 2018.  Courtesy of the Georgia Associat...
Georgia Housing Market Snapshot: June 2018. Courtesy of the Georgia Associat...
 
Georgia Housing Market Snapshot For September 2018
Georgia Housing Market Snapshot For September 2018Georgia Housing Market Snapshot For September 2018
Georgia Housing Market Snapshot For September 2018
 
San Francisco Market Focus Report Jan 2019
San Francisco Market Focus Report Jan 2019San Francisco Market Focus Report Jan 2019
San Francisco Market Focus Report Jan 2019
 
Greater Boston Association of Realtors Monthly Market Insights Report July 2019
Greater Boston Association of Realtors Monthly Market Insights Report July 2019Greater Boston Association of Realtors Monthly Market Insights Report July 2019
Greater Boston Association of Realtors Monthly Market Insights Report July 2019
 
San Francisco market report July 2020
San Francisco market report July 2020San Francisco market report July 2020
San Francisco market report July 2020
 
Georgia Housing Market Snapshot For July. Gar mmi 2018-07
Georgia Housing Market Snapshot For July. Gar mmi 2018-07Georgia Housing Market Snapshot For July. Gar mmi 2018-07
Georgia Housing Market Snapshot For July. Gar mmi 2018-07
 
Bozeman and Surrounding Communities June 2019 Market Report
Bozeman and Surrounding Communities June 2019 Market ReportBozeman and Surrounding Communities June 2019 Market Report
Bozeman and Surrounding Communities June 2019 Market Report
 
San Francisco market report April 2020
San Francisco market report April 2020San Francisco market report April 2020
San Francisco market report April 2020
 
San Francisco market focus report December 2019
San Francisco market focus report December 2019San Francisco market focus report December 2019
San Francisco market focus report December 2019
 
May 2019 Gallatin Valley Market Reports
May 2019 Gallatin Valley Market ReportsMay 2019 Gallatin Valley Market Reports
May 2019 Gallatin Valley Market Reports
 
San Francisco market report June 2020
San Francisco market report June 2020San Francisco market report June 2020
San Francisco market report June 2020
 
Gbar monthly-market-insight-report-jan20
Gbar monthly-market-insight-report-jan20Gbar monthly-market-insight-report-jan20
Gbar monthly-market-insight-report-jan20
 
Gbar monthly-market-insight-report-jan20
Gbar monthly-market-insight-report-jan20Gbar monthly-market-insight-report-jan20
Gbar monthly-market-insight-report-jan20
 

More from Arthur Prescott

Historic Sales Trend Of Lake Lanier Waterfront Homes For The Past 5 Years.pdf
Historic Sales Trend Of Lake Lanier Waterfront Homes For The Past 5 Years.pdfHistoric Sales Trend Of Lake Lanier Waterfront Homes For The Past 5 Years.pdf
Historic Sales Trend Of Lake Lanier Waterfront Homes For The Past 5 Years.pdf
Arthur Prescott
 
Lake Lanier Waterfront Home Sales Comparison 1st Quarter 2023
Lake Lanier Waterfront Home Sales Comparison 1st Quarter 2023 Lake Lanier Waterfront Home Sales Comparison 1st Quarter 2023
Lake Lanier Waterfront Home Sales Comparison 1st Quarter 2023
Arthur Prescott
 
Georgia Real Estate Market Trends February 2022
Georgia Real Estate Market Trends February 2022Georgia Real Estate Market Trends February 2022
Georgia Real Estate Market Trends February 2022
Arthur Prescott
 
Lake Lanier Home Sales Analysis For 2021
Lake Lanier Home Sales Analysis For 2021Lake Lanier Home Sales Analysis For 2021
Lake Lanier Home Sales Analysis For 2021
Arthur Prescott
 
Historic Sales Price Trend Of Lake Lanier Waterfront Homes For The Past 5 Years!
Historic Sales Price Trend Of Lake Lanier Waterfront Homes For The Past 5 Years!Historic Sales Price Trend Of Lake Lanier Waterfront Homes For The Past 5 Years!
Historic Sales Price Trend Of Lake Lanier Waterfront Homes For The Past 5 Years!
Arthur Prescott
 
Sales Price vs. List Price Ratios For Lake Lanier Waterfront Homes
Sales Price vs. List Price Ratios For Lake Lanier Waterfront HomesSales Price vs. List Price Ratios For Lake Lanier Waterfront Homes
Sales Price vs. List Price Ratios For Lake Lanier Waterfront Homes
Arthur Prescott
 
Lake Lanier Home Sales Analysis September 2021
Lake Lanier Home Sales Analysis September 2021Lake Lanier Home Sales Analysis September 2021
Lake Lanier Home Sales Analysis September 2021
Arthur Prescott
 
Lake Lanier Home Sales Analysis August 2021
Lake Lanier Home Sales Analysis August 2021Lake Lanier Home Sales Analysis August 2021
Lake Lanier Home Sales Analysis August 2021
Arthur Prescott
 
Lake Lanier Home Sales Analysis June 2021
Lake Lanier Home Sales Analysis June 2021Lake Lanier Home Sales Analysis June 2021
Lake Lanier Home Sales Analysis June 2021
Arthur Prescott
 
Lake Lanier Home Sales Analysis February 2021
Lake Lanier Home Sales Analysis February 2021Lake Lanier Home Sales Analysis February 2021
Lake Lanier Home Sales Analysis February 2021
Arthur Prescott
 
Lake Lanier Home Sales Analysis January 2021
Lake Lanier Home Sales Analysis January 2021Lake Lanier Home Sales Analysis January 2021
Lake Lanier Home Sales Analysis January 2021
Arthur Prescott
 
Lake Lanier Home Sales Analysis November 2020
Lake Lanier Home Sales Analysis November 2020Lake Lanier Home Sales Analysis November 2020
Lake Lanier Home Sales Analysis November 2020
Arthur Prescott
 
Lake Lanier Waterfront Home Sales YTD 2020 Versus YTD 2019
Lake Lanier Waterfront Home Sales YTD 2020 Versus YTD 2019Lake Lanier Waterfront Home Sales YTD 2020 Versus YTD 2019
Lake Lanier Waterfront Home Sales YTD 2020 Versus YTD 2019
Arthur Prescott
 
Lake Lanier Waterfront Home Sales Trends Quarter 1 2020
Lake Lanier Waterfront Home Sales Trends Quarter 1 2020Lake Lanier Waterfront Home Sales Trends Quarter 1 2020
Lake Lanier Waterfront Home Sales Trends Quarter 1 2020
Arthur Prescott
 
Lake Lanier Homes Sales Analysis January 2020
Lake Lanier Homes Sales Analysis January 2020Lake Lanier Homes Sales Analysis January 2020
Lake Lanier Homes Sales Analysis January 2020
Arthur Prescott
 
Lake Lanier Waterfront Home Sales By Year For The Past 10 Years
Lake Lanier Waterfront Home Sales By Year For The Past 10 YearsLake Lanier Waterfront Home Sales By Year For The Past 10 Years
Lake Lanier Waterfront Home Sales By Year For The Past 10 Years
Arthur Prescott
 
Historic Average Sales Price Trend Of Lake Lanier Homes
Historic Average Sales Price Trend Of Lake Lanier HomesHistoric Average Sales Price Trend Of Lake Lanier Homes
Historic Average Sales Price Trend Of Lake Lanier Homes
Arthur Prescott
 
Lake Lanier Homes Sales Analysis August 2019
Lake Lanier Homes Sales Analysis August 2019Lake Lanier Homes Sales Analysis August 2019
Lake Lanier Homes Sales Analysis August 2019
Arthur Prescott
 
Lake Lanier Home Sales Analysis April 2019
Lake Lanier Home Sales Analysis April 2019Lake Lanier Home Sales Analysis April 2019
Lake Lanier Home Sales Analysis April 2019
Arthur Prescott
 
Lake Lanier Home Sales Analysis January 2019
Lake Lanier Home Sales Analysis January 2019Lake Lanier Home Sales Analysis January 2019
Lake Lanier Home Sales Analysis January 2019
Arthur Prescott
 

More from Arthur Prescott (20)

Historic Sales Trend Of Lake Lanier Waterfront Homes For The Past 5 Years.pdf
Historic Sales Trend Of Lake Lanier Waterfront Homes For The Past 5 Years.pdfHistoric Sales Trend Of Lake Lanier Waterfront Homes For The Past 5 Years.pdf
Historic Sales Trend Of Lake Lanier Waterfront Homes For The Past 5 Years.pdf
 
Lake Lanier Waterfront Home Sales Comparison 1st Quarter 2023
Lake Lanier Waterfront Home Sales Comparison 1st Quarter 2023 Lake Lanier Waterfront Home Sales Comparison 1st Quarter 2023
Lake Lanier Waterfront Home Sales Comparison 1st Quarter 2023
 
Georgia Real Estate Market Trends February 2022
Georgia Real Estate Market Trends February 2022Georgia Real Estate Market Trends February 2022
Georgia Real Estate Market Trends February 2022
 
Lake Lanier Home Sales Analysis For 2021
Lake Lanier Home Sales Analysis For 2021Lake Lanier Home Sales Analysis For 2021
Lake Lanier Home Sales Analysis For 2021
 
Historic Sales Price Trend Of Lake Lanier Waterfront Homes For The Past 5 Years!
Historic Sales Price Trend Of Lake Lanier Waterfront Homes For The Past 5 Years!Historic Sales Price Trend Of Lake Lanier Waterfront Homes For The Past 5 Years!
Historic Sales Price Trend Of Lake Lanier Waterfront Homes For The Past 5 Years!
 
Sales Price vs. List Price Ratios For Lake Lanier Waterfront Homes
Sales Price vs. List Price Ratios For Lake Lanier Waterfront HomesSales Price vs. List Price Ratios For Lake Lanier Waterfront Homes
Sales Price vs. List Price Ratios For Lake Lanier Waterfront Homes
 
Lake Lanier Home Sales Analysis September 2021
Lake Lanier Home Sales Analysis September 2021Lake Lanier Home Sales Analysis September 2021
Lake Lanier Home Sales Analysis September 2021
 
Lake Lanier Home Sales Analysis August 2021
Lake Lanier Home Sales Analysis August 2021Lake Lanier Home Sales Analysis August 2021
Lake Lanier Home Sales Analysis August 2021
 
Lake Lanier Home Sales Analysis June 2021
Lake Lanier Home Sales Analysis June 2021Lake Lanier Home Sales Analysis June 2021
Lake Lanier Home Sales Analysis June 2021
 
Lake Lanier Home Sales Analysis February 2021
Lake Lanier Home Sales Analysis February 2021Lake Lanier Home Sales Analysis February 2021
Lake Lanier Home Sales Analysis February 2021
 
Lake Lanier Home Sales Analysis January 2021
Lake Lanier Home Sales Analysis January 2021Lake Lanier Home Sales Analysis January 2021
Lake Lanier Home Sales Analysis January 2021
 
Lake Lanier Home Sales Analysis November 2020
Lake Lanier Home Sales Analysis November 2020Lake Lanier Home Sales Analysis November 2020
Lake Lanier Home Sales Analysis November 2020
 
Lake Lanier Waterfront Home Sales YTD 2020 Versus YTD 2019
Lake Lanier Waterfront Home Sales YTD 2020 Versus YTD 2019Lake Lanier Waterfront Home Sales YTD 2020 Versus YTD 2019
Lake Lanier Waterfront Home Sales YTD 2020 Versus YTD 2019
 
Lake Lanier Waterfront Home Sales Trends Quarter 1 2020
Lake Lanier Waterfront Home Sales Trends Quarter 1 2020Lake Lanier Waterfront Home Sales Trends Quarter 1 2020
Lake Lanier Waterfront Home Sales Trends Quarter 1 2020
 
Lake Lanier Homes Sales Analysis January 2020
Lake Lanier Homes Sales Analysis January 2020Lake Lanier Homes Sales Analysis January 2020
Lake Lanier Homes Sales Analysis January 2020
 
Lake Lanier Waterfront Home Sales By Year For The Past 10 Years
Lake Lanier Waterfront Home Sales By Year For The Past 10 YearsLake Lanier Waterfront Home Sales By Year For The Past 10 Years
Lake Lanier Waterfront Home Sales By Year For The Past 10 Years
 
Historic Average Sales Price Trend Of Lake Lanier Homes
Historic Average Sales Price Trend Of Lake Lanier HomesHistoric Average Sales Price Trend Of Lake Lanier Homes
Historic Average Sales Price Trend Of Lake Lanier Homes
 
Lake Lanier Homes Sales Analysis August 2019
Lake Lanier Homes Sales Analysis August 2019Lake Lanier Homes Sales Analysis August 2019
Lake Lanier Homes Sales Analysis August 2019
 
Lake Lanier Home Sales Analysis April 2019
Lake Lanier Home Sales Analysis April 2019Lake Lanier Home Sales Analysis April 2019
Lake Lanier Home Sales Analysis April 2019
 
Lake Lanier Home Sales Analysis January 2019
Lake Lanier Home Sales Analysis January 2019Lake Lanier Home Sales Analysis January 2019
Lake Lanier Home Sales Analysis January 2019
 

Recently uploaded

Simpolo Company Profile & Corporate Logo
Simpolo Company Profile & Corporate LogoSimpolo Company Profile & Corporate Logo
Simpolo Company Profile & Corporate Logo
simpolosparkteam
 
Presentation to Windust Meadows HOA Board of Directors June 4, 2024: Focus o...
Presentation to Windust Meadows HOA Board of Directors June 4, 2024:  Focus o...Presentation to Windust Meadows HOA Board of Directors June 4, 2024:  Focus o...
Presentation to Windust Meadows HOA Board of Directors June 4, 2024: Focus o...
Joseph Lewis Aguirre
 
How to keep your Home naturally Cool and Warm
How to keep your Home naturally Cool and WarmHow to keep your Home naturally Cool and Warm
How to keep your Home naturally Cool and Warm
Vinra Construction
 
Killer Referans Bahcesehir Catalog Listing Turkey
Killer Referans Bahcesehir Catalog Listing TurkeyKiller Referans Bahcesehir Catalog Listing Turkey
Killer Referans Bahcesehir Catalog Listing Turkey
Listing Turkey
 
SVN Live 6.3.24 Weekly Property Broadcast
SVN Live 6.3.24 Weekly Property BroadcastSVN Live 6.3.24 Weekly Property Broadcast
SVN Live 6.3.24 Weekly Property Broadcast
SVN International Corp.
 
Brigade Insignia at Yelahanka Brochure.pdf
Brigade Insignia at Yelahanka Brochure.pdfBrigade Insignia at Yelahanka Brochure.pdf
Brigade Insignia at Yelahanka Brochure.pdf
SachinChauhan191
 
One FNG by Group 108 Sector 142 Noida Construction Update
One FNG by Group 108 Sector 142 Noida Construction UpdateOne FNG by Group 108 Sector 142 Noida Construction Update
One FNG by Group 108 Sector 142 Noida Construction Update
One FNG
 
MC Heights-Best Construction Company in jhang
MC Heights-Best Construction Company in jhangMC Heights-Best Construction Company in jhang
MC Heights-Best Construction Company in jhang
laraibfatim009
 
BricknBolt Understanding Load-Bearing Walls and Their Structural Support in H...
BricknBolt Understanding Load-Bearing Walls and Their Structural Support in H...BricknBolt Understanding Load-Bearing Walls and Their Structural Support in H...
BricknBolt Understanding Load-Bearing Walls and Their Structural Support in H...
BrickAndBolt
 
Biography and career about Lixin Azarmehr
Biography and career about Lixin AzarmehrBiography and career about Lixin Azarmehr
Biography and career about Lixin Azarmehr
Lixin Azarmehr
 
Urbanrise Paradise on Earth - Unveiling Unprecedented Luxury in Exquisite Vil...
Urbanrise Paradise on Earth - Unveiling Unprecedented Luxury in Exquisite Vil...Urbanrise Paradise on Earth - Unveiling Unprecedented Luxury in Exquisite Vil...
Urbanrise Paradise on Earth - Unveiling Unprecedented Luxury in Exquisite Vil...
JagadishKR1
 
Torun Center Residences Istanbul - Listing Turkey
Torun Center Residences Istanbul - Listing TurkeyTorun Center Residences Istanbul - Listing Turkey
Torun Center Residences Istanbul - Listing Turkey
Listing Turkey
 
Architectural & Interior design portfolio.pdf
Architectural & Interior design portfolio.pdfArchitectural & Interior design portfolio.pdf
Architectural & Interior design portfolio.pdf
susantebinum
 
How to Scan Tenants in NYC - You Should Know!
How to Scan Tenants in NYC - You Should Know!How to Scan Tenants in NYC - You Should Know!
How to Scan Tenants in NYC - You Should Know!
BelgiumManagement
 
Avrupa Konutlari Yenimahalle - Listing Turkey
Avrupa Konutlari Yenimahalle - Listing TurkeyAvrupa Konutlari Yenimahalle - Listing Turkey
Avrupa Konutlari Yenimahalle - Listing Turkey
Listing Turkey
 
Omaxe Sports City Dwarka A Comprehensive Guide
Omaxe Sports City Dwarka A Comprehensive GuideOmaxe Sports City Dwarka A Comprehensive Guide
Omaxe Sports City Dwarka A Comprehensive Guide
omaxesportscitydwark
 
Investing In The US As A Canadian… And How To Do It RIGHT!! (feat. Erwin Szet...
Investing In The US As A Canadian… And How To Do It RIGHT!! (feat. Erwin Szet...Investing In The US As A Canadian… And How To Do It RIGHT!! (feat. Erwin Szet...
Investing In The US As A Canadian… And How To Do It RIGHT!! (feat. Erwin Szet...
Volition Properties
 
2BHK-3BHK NEW FLAT FOR SALE IN TUPUDANA,RANCHI.
2BHK-3BHK NEW FLAT FOR SALE IN TUPUDANA,RANCHI.2BHK-3BHK NEW FLAT FOR SALE IN TUPUDANA,RANCHI.
2BHK-3BHK NEW FLAT FOR SALE IN TUPUDANA,RANCHI.
aashiyanastardevelop
 
Optimizing Your MCA Lead Capture Process for Better Results
Optimizing Your MCA Lead Capture Process for Better ResultsOptimizing Your MCA Lead Capture Process for Better Results
Optimizing Your MCA Lead Capture Process for Better Results
Lead Generation Media
 
Oeiras Tech City, Developed by RE Capital and REIG, Will Become Lisbon's Futu...
Oeiras Tech City, Developed by RE Capital and REIG, Will Become Lisbon's Futu...Oeiras Tech City, Developed by RE Capital and REIG, Will Become Lisbon's Futu...
Oeiras Tech City, Developed by RE Capital and REIG, Will Become Lisbon's Futu...
Newman George Leech
 

Recently uploaded (20)

Simpolo Company Profile & Corporate Logo
Simpolo Company Profile & Corporate LogoSimpolo Company Profile & Corporate Logo
Simpolo Company Profile & Corporate Logo
 
Presentation to Windust Meadows HOA Board of Directors June 4, 2024: Focus o...
Presentation to Windust Meadows HOA Board of Directors June 4, 2024:  Focus o...Presentation to Windust Meadows HOA Board of Directors June 4, 2024:  Focus o...
Presentation to Windust Meadows HOA Board of Directors June 4, 2024: Focus o...
 
How to keep your Home naturally Cool and Warm
How to keep your Home naturally Cool and WarmHow to keep your Home naturally Cool and Warm
How to keep your Home naturally Cool and Warm
 
Killer Referans Bahcesehir Catalog Listing Turkey
Killer Referans Bahcesehir Catalog Listing TurkeyKiller Referans Bahcesehir Catalog Listing Turkey
Killer Referans Bahcesehir Catalog Listing Turkey
 
SVN Live 6.3.24 Weekly Property Broadcast
SVN Live 6.3.24 Weekly Property BroadcastSVN Live 6.3.24 Weekly Property Broadcast
SVN Live 6.3.24 Weekly Property Broadcast
 
Brigade Insignia at Yelahanka Brochure.pdf
Brigade Insignia at Yelahanka Brochure.pdfBrigade Insignia at Yelahanka Brochure.pdf
Brigade Insignia at Yelahanka Brochure.pdf
 
One FNG by Group 108 Sector 142 Noida Construction Update
One FNG by Group 108 Sector 142 Noida Construction UpdateOne FNG by Group 108 Sector 142 Noida Construction Update
One FNG by Group 108 Sector 142 Noida Construction Update
 
MC Heights-Best Construction Company in jhang
MC Heights-Best Construction Company in jhangMC Heights-Best Construction Company in jhang
MC Heights-Best Construction Company in jhang
 
BricknBolt Understanding Load-Bearing Walls and Their Structural Support in H...
BricknBolt Understanding Load-Bearing Walls and Their Structural Support in H...BricknBolt Understanding Load-Bearing Walls and Their Structural Support in H...
BricknBolt Understanding Load-Bearing Walls and Their Structural Support in H...
 
Biography and career about Lixin Azarmehr
Biography and career about Lixin AzarmehrBiography and career about Lixin Azarmehr
Biography and career about Lixin Azarmehr
 
Urbanrise Paradise on Earth - Unveiling Unprecedented Luxury in Exquisite Vil...
Urbanrise Paradise on Earth - Unveiling Unprecedented Luxury in Exquisite Vil...Urbanrise Paradise on Earth - Unveiling Unprecedented Luxury in Exquisite Vil...
Urbanrise Paradise on Earth - Unveiling Unprecedented Luxury in Exquisite Vil...
 
Torun Center Residences Istanbul - Listing Turkey
Torun Center Residences Istanbul - Listing TurkeyTorun Center Residences Istanbul - Listing Turkey
Torun Center Residences Istanbul - Listing Turkey
 
Architectural & Interior design portfolio.pdf
Architectural & Interior design portfolio.pdfArchitectural & Interior design portfolio.pdf
Architectural & Interior design portfolio.pdf
 
How to Scan Tenants in NYC - You Should Know!
How to Scan Tenants in NYC - You Should Know!How to Scan Tenants in NYC - You Should Know!
How to Scan Tenants in NYC - You Should Know!
 
Avrupa Konutlari Yenimahalle - Listing Turkey
Avrupa Konutlari Yenimahalle - Listing TurkeyAvrupa Konutlari Yenimahalle - Listing Turkey
Avrupa Konutlari Yenimahalle - Listing Turkey
 
Omaxe Sports City Dwarka A Comprehensive Guide
Omaxe Sports City Dwarka A Comprehensive GuideOmaxe Sports City Dwarka A Comprehensive Guide
Omaxe Sports City Dwarka A Comprehensive Guide
 
Investing In The US As A Canadian… And How To Do It RIGHT!! (feat. Erwin Szet...
Investing In The US As A Canadian… And How To Do It RIGHT!! (feat. Erwin Szet...Investing In The US As A Canadian… And How To Do It RIGHT!! (feat. Erwin Szet...
Investing In The US As A Canadian… And How To Do It RIGHT!! (feat. Erwin Szet...
 
2BHK-3BHK NEW FLAT FOR SALE IN TUPUDANA,RANCHI.
2BHK-3BHK NEW FLAT FOR SALE IN TUPUDANA,RANCHI.2BHK-3BHK NEW FLAT FOR SALE IN TUPUDANA,RANCHI.
2BHK-3BHK NEW FLAT FOR SALE IN TUPUDANA,RANCHI.
 
Optimizing Your MCA Lead Capture Process for Better Results
Optimizing Your MCA Lead Capture Process for Better ResultsOptimizing Your MCA Lead Capture Process for Better Results
Optimizing Your MCA Lead Capture Process for Better Results
 
Oeiras Tech City, Developed by RE Capital and REIG, Will Become Lisbon's Futu...
Oeiras Tech City, Developed by RE Capital and REIG, Will Become Lisbon's Futu...Oeiras Tech City, Developed by RE Capital and REIG, Will Become Lisbon's Futu...
Oeiras Tech City, Developed by RE Capital and REIG, Will Become Lisbon's Futu...
 

Georgia Housing Market Snapshot For March 2019

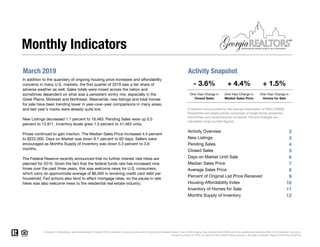
  • 1. March 2019 Activity Snapshot One-Year Change in One-Year Change in Closed Sales Median Sales Price 2 3 4 5 6 7 8 9 10 11 12 Monthly Indicators - 3.6% + 4.4% + 1.5% One-Year Change in Changes in methodology were implemented in October 2012 to provide a more accurate count of inventory and related metrics. Due to MLS purging rules, activity before 2008 cannot be updated and therefore shifts in the trendlines may occur. Current as of April 16, 2019. All data from the multiple listing services in the state of Georgia. Report © 2019 ShowingTime. Pending Sales Closed Sales Days on Market Until Sale Median Sales Price Average Sales Price Percent of Original List Price Received In addition to the quandary of ongoing housing price increases and affordability concerns in many U.S. markets, the first quarter of 2019 saw a fair share of adverse weather as well. Sales totals were mixed across the nation and sometimes dependent on what was a persistent wintry mix, especially in the Great Plains, Midwest and Northeast. Meanwhile, new listings and total homes for sale have been trending lower in year-over-year comparisons in many areas, and last year's marks were already quite low. New Listings decreased 1.1 percent to 18,483. Pending Sales were up 0.5 percent to 13,911. Inventory levels grew 1.5 percent to 41,463 units. Prices continued to gain traction. The Median Sales Price increased 4.4 percent to $222,000. Days on Market was down 9.1 percent to 60 days. Sellers were encouraged as Months Supply of Inventory was down 5.3 percent to 3.6 months. The Federal Reserve recently announced that no further interest rate hikes are planned for 2019. Given the fact that the federal funds rate has increased nine times over the past three years, this was welcome news for U.S. consumers, which carry an approximate average of $6,000 in revolving credit card debt per household. Fed actions also tend to affect mortgage rates, so the pause in rate hikes was also welcome news to the residential real estate industry. Homes for Sale A research tool provided by the Georgia Association of REALTORS®. Residential real estate activity composed of single-family properties, townhomes and condominiums combined. Percent changes are calculated using rounded figures. Activity Overview New Listings Housing Affordability Index Inventory of Homes for Sale Months Supply of Inventory
  • 2. Activity Overview Key Metrics Historical Sparkbars 3-2018 3-2019 Percent Change YTD 2018 YTD 2019 Percent Change Key metrics by report month and for year-to-date (YTD) starting from the first of the year. New Listings 18,698 18,483 - 1.1% 49,386 + 4.6% Pending Sales 13,837 13,911 + 0.5% 34,073 35,518 + 4.2% 47,230 + 1.5% Days on Market Until Sale 66 60 - 9.1% 69 65 - 5.8% Closed Sales 11,968 11,536 - 3.6% 27,378 27,785 + 4.9% Average Sales Price $256,398 $264,882 + 3.3% $248,456 $256,806 + 3.4% Median Sales Price $212,633 $222,000 + 4.4% $205,000 $215,000 Inventory of Homes for Sale 40,848 41,463 + 1.5% -- -- Months Supply of Inventory 3.8 3.6 - 5.3% -- Current as of April 16, 2019. All data from the multiple listing services in the state of Georgia. Report © 2019 ShowingTime. | 2 - 0.3% Housing Affordability Index 175 170 - 2.9% 182 176 - 3.3% Pct. of Orig. Price Received 96.4% 96.0% - 0.4% 96.0% 95.7% -- -- -- 3-2016 3-2017 3-2018 3-2019 3-2016 3-2017 3-2018 3-2019 3-2016 3-2017 3-2018 3-2019 3-2016 3-2017 3-2018 3-2019 3-2016 3-2017 3-2018 3-2019 3-2016 3-2017 3-2018 3-2019 3-2016 3-2017 3-2018 3-2019 3-2016 3-2017 3-2018 3-2019 3-2016 3-2017 3-2018 3-2019 3-2016 3-2017 3-2018 3-2019
  • 3. New Listings Prior Year Percent Change April 2018 18,462 16,079 +14.8% May 2018 19,043 17,699 +7.6% June 2018 19,019 17,465 +8.9% July 2018 17,239 15,556 +10.8% August 2018 17,519 15,870 +10.4% September 2018 15,156 12,577 +20.5% October 2018 16,261 13,793 +17.9% November 2018 12,533 11,764 +6.5% December 2018 9,108 8,794 +3.6% January 2019 15,811 13,387 +18.1% February 2019 15,092 15,145 -0.3% March 2019 18,483 18,698 -1.1% 12-Month Avg 16,144 14,736 +9.6% Historical New Listings by Month Current as of April 16, 2019. All data from the multiple listing services in the state of Georgia. Report © 2019 ShowingTime. | 3 A count of the properties that have been newly listed on the market in a given month. New Listings 18,136 18,698 18,483 2017 2018 2019 March 6,000 8,000 10,000 12,000 14,000 16,000 18,000 20,000 1-2012 1-2013 1-2014 1-2015 1-2016 1-2017 1-2018 1-2019 45,027 47,230 49,386 2017 2018 2019 Year to Date + 4.6%+ 3.1% - 1.1% + 4.9%+ 6.6% + 5.0%
  • 4. Pending Sales Prior Year Percent Change April 2018 13,852 11,718 +18.2% May 2018 13,685 12,199 +12.2% June 2018 12,845 11,925 +7.7% July 2018 12,406 11,273 +10.1% August 2018 12,144 11,258 +7.9% September 2018 10,320 9,061 +13.9% October 2018 10,626 10,166 +4.5% November 2018 8,901 8,918 -0.2% December 2018 7,376 7,480 -1.4% January 2019 10,347 9,629 +7.5% February 2019 11,260 10,607 +6.2% March 2019 13,911 13,837 +0.5% 12-Month Avg 11,473 10,673 +7.5% Historical Pending Sales by Month Current as of April 16, 2019. All data from the multiple listing services in the state of Georgia. Report © 2019 ShowingTime. | 4 A count of the properties on which offers have been accepted in a given month. Pending Sales 12,703 13,837 13,911 2017 2018 2019 March 4,000 6,000 8,000 10,000 12,000 14,000 1-2012 1-2013 1-2014 1-2015 1-2016 1-2017 1-2018 1-2019 31,512 34,073 35,518 2017 2018 2019 Year to Date + 4.2%+ 8.9% + 0.5% + 8.1%+ 8.9% + 9.1%
  • 5. Closed Sales Prior Year Percent Change April 2018 12,225 10,404 +17.5% May 2018 14,091 12,502 +12.7% June 2018 14,175 13,155 +7.8% July 2018 13,240 11,462 +15.5% August 2018 13,315 11,953 +11.4% September 2018 10,780 10,220 +5.5% October 2018 11,142 10,033 +11.1% November 2018 10,186 9,352 +8.9% December 2018 9,580 9,857 -2.8% January 2019 7,313 7,212 +1.4% February 2019 8,936 8,198 +9.0% March 2019 11,536 11,968 -3.6% 12-Month Avg 11,377 10,526 +8.1% Historical Closed Sales by Month Current as of April 16, 2019. All data from the multiple listing services in the state of Georgia. Report © 2019 ShowingTime. | 5 A count of the actual sales that closed in a given month. Closed Sales 11,532 11,968 11,536 2017 2018 2019 March 4,000 6,000 8,000 10,000 12,000 14,000 16,000 1-2012 1-2013 1-2014 1-2015 1-2016 1-2017 1-2018 1-2019 25,838 27,378 27,785 2017 2018 2019 Year to Date + 1.5%+ 3.8% - 3.6% + 6.0%+ 17.1% + 10.6%
  • 6. Days on Market Until Sale Prior Year Percent Change April 2018 60 65 -7.7% May 2018 55 59 -6.8% June 2018 53 57 -7.0% July 2018 52 55 -5.5% August 2018 52 57 -8.8% September 2018 55 60 -8.3% October 2018 55 61 -9.8% November 2018 58 63 -7.9% December 2018 62 67 -7.5% January 2019 67 72 -6.9% February 2019 68 72 -5.6% March 2019 60 66 -9.1% 12-Month Avg* 57 62 -8.1% Historical Days on Market Until Sale by Month Current as of April 16, 2019. All data from the multiple listing services in the state of Georgia. Report © 2019 ShowingTime. | 6 Average number of days between when a property is listed and when an offer is accepted in a given month. Days on Market * Average Days on Market of all properties from April 2018 through March 2019. This is not the average of the individual figures above. 71 66 60 2017 2018 2019 March 50 60 70 80 90 100 110 1-2012 1-2013 1-2014 1-2015 1-2016 1-2017 1-2018 1-2019 75 69 65 2017 2018 2019 Year to Date - 5.8%- 7.0% - 9.1% - 8.0%- 12.3% - 10.7%
  • 7. Median Sales Price Prior Year Percent Change April 2018 $215,000 $196,250 +9.6% May 2018 $220,000 $200,000 +10.0% June 2018 $226,000 $208,000 +8.7% July 2018 $224,900 $207,400 +8.4% August 2018 $214,900 $200,000 +7.5% September 2018 $217,500 $196,900 +10.5% October 2018 $214,952 $198,990 +8.0% November 2018 $213,075 $195,000 +9.3% December 2018 $215,000 $205,000 +4.9% January 2019 $210,000 $195,000 +7.7% February 2019 $210,700 $201,349 +4.6% March 2019 $222,000 $212,633 +4.4% 12-Month Med* $218,000 $200,750 +8.6% Historical Median Sales Price by Month Current as of April 16, 2019. All data from the multiple listing services in the state of Georgia. Report © 2019 ShowingTime. | 7 Point at which half of the sales sold for more and half sold for less, not accounting for seller concessions, in a given month. Median Sales Price * Median Sales Price of all properties from April 2018 through March 2019. This is not the average of the individual figures above. $192,000 $212,633 $222,000 2017 2018 2019 March $75,000 $100,000 $125,000 $150,000 $175,000 $200,000 $225,000 $250,000 1-2012 1-2013 1-2014 1-2015 1-2016 1-2017 1-2018 1-2019 $185,900 $205,000 $215,000 2017 2018 2019 Year to Date + 4.9%+ 10.7% + 4.4% + 10.3%+ 9.1% + 9.4%
  • 8. Average Sales Price Prior Year Percent Change April 2018 $262,395 $244,353 +7.4% May 2018 $270,251 $250,560 +7.9% June 2018 $277,311 $255,143 +8.7% July 2018 $271,487 $256,389 +5.9% August 2018 $261,108 $246,973 +5.7% September 2018 $260,396 $242,078 +7.6% October 2018 $259,207 $244,230 +6.1% November 2018 $260,420 $244,324 +6.6% December 2018 $256,030 $249,589 +2.6% January 2019 $250,246 $240,100 +4.2% February 2019 $251,795 $244,292 +3.1% March 2019 $264,882 $256,398 +3.3% 12-Month Avg* $263,361 $248,527 +6.0% Historical Average Sales Price by Month Current as of April 16, 2019. All data from the multiple listing services in the state of Georgia. Report © 2019 ShowingTime. | 8 Average sales price for all closed sales, not accounting for seller concessions, in a given month. Avg. Sales Price * Avg. Sales Price of all properties from April 2018 through March 2019. This is not the average of the individual figures above. $236,588 $256,398 $264,882 2017 2018 2019 March $100,000 $150,000 $200,000 $250,000 $300,000 1-2012 1-2013 1-2014 1-2015 1-2016 1-2017 1-2018 1-2019 $229,295 $248,456 $256,806 2017 2018 2019 Year to Date + 3.4%+ 8.4% + 3.3% + 8.4%+ 6.9% + 7.3%
  • 9. Percent of Original List Price Received Prior Year Percent Change April 2018 96.9% 96.1% +0.8% May 2018 97.2% 96.4% +0.8% June 2018 97.1% 96.4% +0.7% July 2018 97.0% 96.3% +0.7% August 2018 96.4% 95.8% +0.6% September 2018 96.1% 95.8% +0.3% October 2018 95.8% 95.5% +0.3% November 2018 95.6% 95.7% -0.1% December 2018 95.6% 95.6% 0.0% January 2019 95.2% 95.4% -0.2% February 2019 95.6% 96.0% -0.4% March 2019 96.0% 96.4% -0.4% 12-Month Avg* 96.3% 96.0% +0.3% Historical Percent of Original List Price Received by Month Current as of April 16, 2019. All data from the multiple listing services in the state of Georgia. Report © 2019 ShowingTime. | 9 Percentage found when dividing a property’s sales price by its original list price, then taking the average for all properties sold in a given month, not accounting for seller concessions. Pct. of Orig. Price Received * Average Pct. of Orig. Price Received for all properties from April 2018 through March 2019. This is not the average of the individual figures above. 95.7% 96.4% 96.0% 2017 2018 2019 March 88% 90% 92% 94% 96% 98% 1-2012 1-2013 1-2014 1-2015 1-2016 1-2017 1-2018 1-2019 95.2% 96.0% 95.7% 2017 2018 2019 Year to Date - 0.3%+ 0.7% - 0.4% + 0.8%+ 0.8% + 1.0%
  • 10. Housing Affordability Index Prior Year Percent Change April 2018 170 197 -13.7% May 2018 166 195 -14.9% June 2018 163 187 -12.8% July 2018 164 189 -13.2% August 2018 170 197 -13.7% September 2018 163 200 -18.5% October 2018 156 195 -20.0% November 2018 160 201 -20.4% December 2018 172 189 -9.0% January 2019 176 192 -8.3% February 2019 178 186 -4.3% March 2019 170 175 -2.9% 12-Month Avg 167 167 0.0% Historical Housing Affordability Index by Month Current as of April 16, 2019. All data from the multiple listing services in the state of Georgia. Report © 2019 ShowingTime. | 10 This index measures housing affordability for the region. For example, an index of 120 means the median household income is 120% of what is necessary to qualify for the median-priced home under prevailing interest rates. A higher number means greater affordability. Affordability Index 197 175 170 2017 2018 2019 March 100 200 300 400 500 1-2012 1-2013 1-2014 1-2015 1-2016 1-2017 1-2018 1-2019 204 182 176 2017 2018 2019 Year to Date - 3.3%- 11.2% - 2.9% - 10.8%- 12.4% - 12.4%
  • 11. Inventory of Homes for Sale Prior Year Percent Change April 2018 41,859 42,701 -2.0% May 2018 43,302 44,195 -2.0% June 2018 45,167 45,695 -1.2% July 2018 45,394 45,718 -0.7% August 2018 45,847 45,419 +0.9% September 2018 45,826 44,422 +3.2% October 2018 46,114 43,288 +6.5% November 2018 44,735 41,934 +6.7% December 2018 41,745 39,228 +6.4% January 2019 41,496 38,510 +7.8% February 2019 41,234 39,821 +3.5% March 2019 41,463 40,848 +1.5% 12-Month Avg 43,682 42,648 +2.4% Historical Inventory of Homes for Sale by Month Current as of April 16, 2019. All data from the multiple listing services in the state of Georgia. Report © 2019 ShowingTime. | 11 The number of properties available for sale in active status at the end of a given month. Homes for Sale 42,112 40,848 41,463 2017 2018 2019 March 37,500 40,000 42,500 45,000 47,500 50,000 52,500 55,000 1-2012 1-2013 1-2014 1-2015 1-2016 1-2017 1-2018 1-2019 - 3.0% + 1.5%- 8.7%
  • 12. Months Supply of Inventory Prior Year Percent Change April 2018 3.9 4.2 -7.1% May 2018 3.9 4.4 -11.4% June 2018 4.1 4.5 -8.9% July 2018 4.1 4.5 -8.9% August 2018 4.1 4.4 -6.8% September 2018 4.0 4.3 -7.0% October 2018 4.1 4.2 -2.4% November 2018 3.9 4.0 -2.5% December 2018 3.7 3.8 -2.6% January 2019 3.6 3.7 -2.7% February 2019 3.6 3.8 -5.3% March 2019 3.6 3.8 -5.3% 12-Month Avg 3.9 4.1 -4.9% Historical Months Supply of Inventory by Month Current as of April 16, 2019. All data from the multiple listing services in the state of Georgia. Report © 2019 ShowingTime. | 12 The inventory of homes for sale at the end of a given month, divided by the average monthly pending sales from the last 12 months. Months Supply * Months Supply for all properties from April 2018 through March 2019. This is not the average of the individual figures above. 4.2 3.8 3.6 2017 2018 2019 March 3.0 4.0 5.0 6.0 7.0 8.0 1-2013 1-2014 1-2015 1-2016 1-2017 1-2018 1-2019 - 9.5% - 5.3%- 16.0%