SlideShare a Scribd company logo
1 of 13
Download to read offline
Office: (832) 326-5787
Courtney@CourtneyFoster.com
www.ReferredRealtyMT.com
Courtney Foster
Referred Realty Group
Each data point is one month of activity. Data is from June 4, 2018.
All data from Big Sky Country MLS, a subsidiary of the Gallatin Association of REALTORS®. InfoSparks © 2018 ShowingTime.
May Homes for Sale
Bozeman & Belgrade & Three Forks & Big Sky
0
100
200
300
400
500
2016 2017 2018
444
365
312
-17.8% -14.5%
75
55
67
-26.7% +21.8%
20
39
28
+95.0% -28.2%
252
202
144
-19.8% -28.7%
Bozeman Belgrade Three Forks Big Sky
Office: (832) 326-5787
Courtney@CourtneyFoster.com
www.ReferredRealtyMT.com
Courtney Foster
Referred Realty Group
Each data point is one month of activity. Data is from June 4, 2018.
All data from Big Sky Country MLS, a subsidiary of the Gallatin Association of REALTORS®. InfoSparks © 2018 ShowingTime.
May New Listings
Bozeman & Belgrade & Three Forks & Big Sky
0
50
100
150
200
250
2016 2017 2018
211 211
192
0.0% -9.0%
65 63
76
-3.1% +20.6%
12 15 12
+25.0% -20.0%
32 29
20
-9.4% -31.0%
Bozeman Belgrade Three Forks Big Sky
Office: (832) 326-5787
Courtney@CourtneyFoster.com
www.ReferredRealtyMT.com
Courtney Foster
Referred Realty Group
Each data point is one month of activity. Data is from June 4, 2018.
All data from Big Sky Country MLS, a subsidiary of the Gallatin Association of REALTORS®. InfoSparks © 2018 ShowingTime.
May Pending Sales
Bozeman & Belgrade & Three Forks & Big Sky
0
50
100
150
200
2016 2017 2018
179
162
152
-9.5% -6.2%
55
47
64
-14.5% +36.2%
8 6
14
-25.0% +133.3%
14 12
16
-14.3% +33.3%
Bozeman Belgrade Three Forks Big Sky
Office: (832) 326-5787
Courtney@CourtneyFoster.com
www.ReferredRealtyMT.com
Courtney Foster
Referred Realty Group
Each data point is one month of activity. Data is from June 4, 2018.
All data from Big Sky Country MLS, a subsidiary of the Gallatin Association of REALTORS®. InfoSparks © 2018 ShowingTime.
May Closed Sales
Bozeman & Belgrade & Three Forks & Big Sky
0
25
50
75
100
125
150
175
2016 2017 2018
158
146
154
-7.6% +5.5%
34 36
45
+5.9% +25.0%
6 7 6
+16.7% -14.3%
20
24
30
+20.0% +25.0%
Bozeman Belgrade Three Forks Big Sky
Office: (832) 326-5787
Courtney@CourtneyFoster.com
www.ReferredRealtyMT.com
Courtney Foster
Referred Realty Group
Each data point is activity year to date. Data is from June 4, 2018.
All data from Big Sky Country MLS, a subsidiary of the Gallatin Association of REALTORS®. InfoSparks © 2018 ShowingTime.
May Closed Sales
Bozeman & Belgrade & Three Forks & Big Sky
0
100
200
300
400
500
600
700
2016 2017 2018
557
515
558
-7.5% +8.3%
141
162 162
+14.9% 0.0%
23 16 25
-30.4% +56.3%
87
101
124
+16.1% +22.8%
Bozeman Belgrade Three Forks Big Sky
Office: (832) 326-5787
Courtney@CourtneyFoster.com
www.ReferredRealtyMT.com
Courtney Foster
Referred Realty Group
Each data point is activity year to date. Data is from June 4, 2018.
All data from Big Sky Country MLS, a subsidiary of the Gallatin Association of REALTORS®. InfoSparks © 2018 ShowingTime.
May Average Sales Price
Bozeman & Belgrade & Three Forks & Big Sky
$0
$0.2M
$0.4M
$0.6M
$0.8M
$1.0M
2016 2017 2018
$369,957
$421,705
$466,295
+14.0% +10.6%
$250,273
$287,524
$312,915
+14.9% +8.8%
$231,319
$203,984
$253,328
-11.8% +24.2%
$674,063
$738,960
$883,437
+9.6% +19.6%
Bozeman Belgrade Three Forks Big Sky
Office: (832) 326-5787
Courtney@CourtneyFoster.com
www.ReferredRealtyMT.com
Courtney Foster
Referred Realty Group
Each data point is one month of activity. Data is from June 4, 2018.
All data from Big Sky Country MLS, a subsidiary of the Gallatin Association of REALTORS®. InfoSparks © 2018 ShowingTime.
May Months Supply of Homes for Sale
Bozeman & Belgrade & Three Forks & Big Sky
0.0
10.0
2.5
5.0
7.5
12.5
15.0
17.5
2016 2017 2018
3.3
2.9
2.5
-12.1% -13.8%
2.2
1.5 1.7
-31.8% +13.3%
3.4
7.5
3.5
+120.6% -53.3%
13.7
9.1
6.0
-33.6% -34.1%
Bozeman Belgrade Three Forks Big Sky
Office: (832) 326-5787
Courtney@CourtneyFoster.com
www.ReferredRealtyMT.com
Courtney Foster
Referred Realty Group
Each data point is one month of activity. Data is from June 4, 2018.
All data from Big Sky Country MLS, a subsidiary of the Gallatin Association of REALTORS®. InfoSparks © 2018 ShowingTime.
May Median Days on Market
Bozeman & Belgrade & Three Forks & Big Sky
0
20
40
60
80
100
120
2016 2017 2018
33
11 11
-66.7% 0.0%
18
9
13
-50.0% +44.4%
12
41
50
+241.7% +22.0%
101
107
57
+5.9% -46.7%
Bozeman Belgrade Three Forks Big Sky
Office: (832) 326-5787
Courtney@CourtneyFoster.com
www.ReferredRealtyMT.com
Courtney Foster
Referred Realty Group
Each data point is one month of activity. Data is from June 4, 2018.
All data from Big Sky Country MLS, a subsidiary of the Gallatin Association of REALTORS®. InfoSparks © 2018 ShowingTime.
May Average Price Per Square Foot
Bozeman & Belgrade & Three Forks & Big Sky
$0
$100
$200
$300
$400
$500
2016 2017 2018
$172
$194
$219
+12.8% +12.9%
$134
$156
$184
+16.4% +17.9%
$122
$136
$191
+11.5% +40.4%
$304
$266
$379
-12.5% +42.5%
Bozeman Belgrade Three Forks Big Sky
Local Market Update – April 2018
This is a research tool provided by the Big Sky Country MLS
Bozeman City Limits
Single Family April Year to Date
Key Metrics 2017 2018 % Change Thru 4-2017 Thru 4-2018 % Change
New Listings 64 52 - 18.8% 230 215 - 6.5%
Pending Sales 64 62 - 3.1% 198 209 + 5.6%
Closed Sales 40 54 + 35.0% 134 163 + 21.6%
Days on Market Until Sale 70 70 0.0% 77 60 - 22.1%
Median Sales Price* $389,450 $429,950 + 10.4% $362,000 $425,000 + 17.4%
Average Sales Price* $420,210 $461,846 + 9.9% $411,800 $462,773 + 12.4%
Percent of List Price Received* 99.4% 98.9% - 0.5% 99.7% 99.3% - 0.4%
Inventory of Homes for Sale 115 85 - 26.1% –– –– ––
Months Supply of Inventory 2.4 1.8 - 25.0% –– –– ––
Condo/Townhouse April Year to Date
Key Metrics 2017 2018 % Change Thru 4-2017 Thru 4-2018 % Change
New Listings 58 44 - 24.1% 183 151 - 17.5%
Pending Sales 46 49 + 6.5% 159 159 0.0%
Closed Sales 29 32 + 10.3% 109 115 + 5.5%
Days on Market Until Sale 58 69 + 19.0% 124 72 - 41.9%
Median Sales Price* $279,900 $303,065 + 8.3% $278,279 $299,900 + 7.8%
Average Sales Price* $320,197 $311,038 - 2.9% $334,173 $355,235 + 6.3%
Percent of List Price Received* 99.0% 99.7% + 0.7% 99.6% 99.6% 0.0%
Inventory of Homes for Sale 67 71 + 6.0% –– –– ––
Months Supply of Inventory 1.8 1.9 + 5.6% –– –– ––
* Does not account for sale concessions and/or downpayment assistance. | Percent changes are calculated using rounded figures and can sometimes look extreme due to small sample size.
A rolling 12-month calculation represents the current month and the 11 months prior in a single data point. If no activity occurred during a month, the line extends to the next available data point.
Median Sales Price - Single Family
Rolling 12-Month Calculation Gallatin County
Bozeman City Limits
1-2003 1-2005 1-2007 1-2009 1-2011 1-2013 1-2015 1-2017
$150,000
$200,000
$250,000
$300,000
$350,000
$400,000
$450,000
Median Sales Price - Condo
Rolling 12-Month Calculation Gallatin County
Bozeman City Limits
1-2003 1-2005 1-2007 1-2009 1-2011 1-2013 1-2015 1-2017
$100,000
$150,000
$200,000
$250,000
$300,000
Current as of May 10, 2018. All data from Big Sky Country Multiple Listing Service®. Report © 2018 ShowingTime.
Local Market Update – April 2018
This is a research tool provided by the Big Sky Country MLS
Belgrade
Single Family April Year to Date
Key Metrics 2017 2018 % Change Thru 4-2017 Thru 4-2018 % Change
New Listings 31 35 + 12.9% 121 119 - 1.7%
Pending Sales 37 35 - 5.4% 127 111 - 12.6%
Closed Sales 27 28 + 3.7% 96 87 - 9.4%
Days on Market Until Sale 36 13 - 63.9% 61 41 - 32.8%
Median Sales Price* $279,500 $286,000 + 2.3% $275,000 $285,000 + 3.6%
Average Sales Price* $302,430 $296,677 - 1.9% $299,139 $324,601 + 8.5%
Percent of List Price Received* 99.4% 99.4% 0.0% 98.6% 98.9% + 0.3%
Inventory of Homes for Sale 27 40 + 48.1% –– –– ––
Months Supply of Inventory 1.0 1.4 + 40.0% –– –– ––
Condo/Townhouse April Year to Date
Key Metrics 2017 2018 % Change Thru 4-2017 Thru 4-2018 % Change
New Listings 10 10 0.0% 31 39 + 25.8%
Pending Sales 8 10 + 25.0% 29 34 + 17.2%
Closed Sales 8 10 + 25.0% 18 21 + 16.7%
Days on Market Until Sale 12 15 + 25.0% 28 30 + 7.1%
Median Sales Price* $192,450 $242,450 + 26.0% $174,250 $211,000 + 21.1%
Average Sales Price* $190,988 $240,840 + 26.1% $178,006 $228,410 + 28.3%
Percent of List Price Received* 100.1% 100.0% - 0.1% 99.8% 99.5% - 0.3%
Inventory of Homes for Sale 8 13 + 62.5% –– –– ––
Months Supply of Inventory 1.1 1.8 + 63.6% –– –– ––
* Does not account for sale concessions and/or downpayment assistance. | Percent changes are calculated using rounded figures and can sometimes look extreme due to small sample size.
A rolling 12-month calculation represents the current month and the 11 months prior in a single data point. If no activity occurred during a month, the line extends to the next available data point.
Median Sales Price - Single Family
Rolling 12-Month Calculation Gallatin County
Belgrade
1-2003 1-2005 1-2007 1-2009 1-2011 1-2013 1-2015 1-2017
$100,000
$150,000
$200,000
$250,000
$300,000
$350,000
$400,000
Median Sales Price - Condo
Rolling 12-Month Calculation Gallatin County
Belgrade
1-2003 1-2005 1-2007 1-2009 1-2011 1-2013 1-2015 1-2017
$50,000
$100,000
$150,000
$200,000
$250,000
$300,000
Current as of May 10, 2018. All data from Big Sky Country Multiple Listing Service®. Report © 2018 ShowingTime.
Local Market Update – April 2018
This is a research tool provided by the Big Sky Country MLS
Greater Big Sky
Single Family April Year to Date
Key Metrics 2017 2018 % Change Thru 4-2017 Thru 4-2018 % Change
New Listings 7 4 - 42.9% 30 36 + 20.0%
Pending Sales 8 13 + 62.5% 25 45 + 80.0%
Closed Sales 6 10 + 66.7% 18 27 + 50.0%
Days on Market Until Sale 192 151 - 21.4% 172 157 - 8.7%
Median Sales Price* $2,135,000 $1,518,000 - 28.9% $1,067,500 $1,471,500 + 37.8%
Average Sales Price* $2,107,500 $2,210,356 + 4.9% $1,469,327 $1,830,341 + 24.6%
Percent of List Price Received* 93.3% 94.9% + 1.7% 95.1% 97.3% + 2.3%
Inventory of Homes for Sale 78 49 - 37.2% –– –– ––
Months Supply of Inventory 12.3 6.0 - 51.2% –– –– ––
Condo/Townhouse April Year to Date
Key Metrics 2017 2018 % Change Thru 4-2017 Thru 4-2018 % Change
New Listings 11 10 - 9.1% 65 62 - 4.6%
Pending Sales 18 8 - 55.6% 73 73 0.0%
Closed Sales 15 25 + 66.7% 51 62 + 21.6%
Days on Market Until Sale 85 157 + 84.7% 166 122 - 26.5%
Median Sales Price* $413,000 $460,000 + 11.4% $372,500 $387,900 + 4.1%
Average Sales Price* $464,037 $582,531 + 25.5% $475,912 $487,195 + 2.4%
Percent of List Price Received* 99.3% 96.5% - 2.8% 96.6% 96.7% + 0.1%
Inventory of Homes for Sale 97 93 - 4.1% –– –– ––
Months Supply of Inventory 6.3 6.5 + 3.2% –– –– ––
* Does not account for sale concessions and/or downpayment assistance. | Percent changes are calculated using rounded figures and can sometimes look extreme due to small sample size.
A rolling 12-month calculation represents the current month and the 11 months prior in a single data point. If no activity occurred during a month, the line extends to the next available data point.
Median Sales Price - Single Family
Rolling 12-Month Calculation Gallatin County
Greater Big Sky
1-2003 1-2005 1-2007 1-2009 1-2011 1-2013 1-2015 1-2017
$0
$500,000
$1,000,000
$1,500,000
$2,000,000
Median Sales Price - Condo
Rolling 12-Month Calculation Gallatin County
Greater Big Sky
1-2003 1-2005 1-2007 1-2009 1-2011 1-2013 1-2015 1-2017
$0
$100,000
$200,000
$300,000
$400,000
$500,000
$600,000
Current as of May 10, 2018. All data from Big Sky Country Multiple Listing Service®. Report © 2018 ShowingTime.
Local Market Update – April 2018
This is a research tool provided by the Big Sky Country MLS
Livingston City Limits
Single Family April Year to Date
Key Metrics 2017 2018 % Change Thru 4-2017 Thru 4-2018 % Change
New Listings 18 12 - 33.3% 54 42 - 22.2%
Pending Sales 14 14 0.0% 59 40 - 32.2%
Closed Sales 15 11 - 26.7% 39 36 - 7.7%
Days on Market Until Sale 79 67 - 15.2% 77 46 - 40.3%
Median Sales Price* $229,900 $278,000 + 20.9% $215,000 $265,000 + 23.3%
Average Sales Price* $234,869 $295,060 + 25.6% $228,463 $267,815 + 17.2%
Percent of List Price Received* 95.9% 97.1% + 1.3% 96.6% 96.9% + 0.3%
Inventory of Homes for Sale 27 23 - 14.8% –– –– ––
Months Supply of Inventory 2.3 2.0 - 13.0% –– –– ––
Condo/Townhouse April Year to Date
Key Metrics 2017 2018 % Change Thru 4-2017 Thru 4-2018 % Change
New Listings 3 4 + 33.3% 6 10 + 66.7%
Pending Sales 2 7 + 250.0% 3 13 + 333.3%
Closed Sales 1 0 - 100.0% 2 9 + 350.0%
Days on Market Until Sale 14 –– –– 45 38 - 15.6%
Median Sales Price* $325,000 –– –– $236,500 $218,000 - 7.8%
Average Sales Price* $325,000 –– –– $236,500 $217,878 - 7.9%
Percent of List Price Received* 92.9% –– –– 94.8% 97.1% + 2.4%
Inventory of Homes for Sale 4 3 - 25.0% –– –– ––
Months Supply of Inventory 2.4 0.8 - 66.7% –– –– ––
* Does not account for sale concessions and/or downpayment assistance. | Percent changes are calculated using rounded figures and can sometimes look extreme due to small sample size.
A rolling 12-month calculation represents the current month and the 11 months prior in a single data point. If no activity occurred during a month, the line extends to the next available data point.
Median Sales Price - Single Family
Rolling 12-Month Calculation Gallatin County
Livingston City Limits
1-2003 1-2005 1-2007 1-2009 1-2011 1-2013 1-2015 1-2017
$50,000
$100,000
$150,000
$200,000
$250,000
$300,000
$350,000
$400,000
Median Sales Price - Condo
Rolling 12-Month Calculation Gallatin County
Livingston City Limits
1-2003 1-2005 1-2007 1-2009 1-2011 1-2013 1-2015 1-2017
$50,000
$100,000
$150,000
$200,000
$250,000
$300,000
Current as of May 10, 2018. All data from Big Sky Country Multiple Listing Service®. Report © 2018 ShowingTime.

More Related Content

What's hot

June 2018 Gallatin Valley Market Reports
June 2018 Gallatin Valley Market ReportsJune 2018 Gallatin Valley Market Reports
June 2018 Gallatin Valley Market ReportsReferred Realty Group
 
#HomeSalesShow Nov 2017 Market Reports
#HomeSalesShow Nov 2017 Market Reports#HomeSalesShow Nov 2017 Market Reports
#HomeSalesShow Nov 2017 Market ReportsReferred Realty Group
 
May 2019 Gallatin Valley Market Reports
May 2019 Gallatin Valley Market ReportsMay 2019 Gallatin Valley Market Reports
May 2019 Gallatin Valley Market ReportsReferred Realty Group
 
August 2019 Market Reports for Bozeman
August 2019 Market Reports for BozemanAugust 2019 Market Reports for Bozeman
August 2019 Market Reports for BozemanReferred Realty Group
 
Bozeman and Surrounding Communities June 2019 Market Report
Bozeman and Surrounding Communities June 2019 Market ReportBozeman and Surrounding Communities June 2019 Market Report
Bozeman and Surrounding Communities June 2019 Market ReportReferred Realty Group
 
April 2019 Market Reports for the Gallatin Valley
April 2019 Market Reports for the Gallatin ValleyApril 2019 Market Reports for the Gallatin Valley
April 2019 Market Reports for the Gallatin ValleyReferred Realty Group
 
Charlotte region -monthly indicators - feb 2018
Charlotte region -monthly indicators - feb 2018Charlotte region -monthly indicators - feb 2018
Charlotte region -monthly indicators - feb 2018Scott Browder
 
Georgia Housing Market Snapshot For September 2018
Georgia Housing Market Snapshot For September 2018Georgia Housing Market Snapshot For September 2018
Georgia Housing Market Snapshot For September 2018Arthur Prescott
 
San Francisco Market Focus April 2018
San Francisco Market Focus April 2018San Francisco Market Focus April 2018
San Francisco Market Focus April 2018Ronny Budiutama
 
#HomeSalesShow Oct 2017 market reports
#HomeSalesShow Oct 2017 market reports#HomeSalesShow Oct 2017 market reports
#HomeSalesShow Oct 2017 market reportsReferred Realty Group
 
Jan 2019 Gallatin Valley Market Reports
Jan 2019 Gallatin Valley Market ReportsJan 2019 Gallatin Valley Market Reports
Jan 2019 Gallatin Valley Market ReportsReferred Realty Group
 
San Francisco Market Focus Report November 2018
San Francisco Market Focus Report November 2018San Francisco Market Focus Report November 2018
San Francisco Market Focus Report November 2018Ronny Budiutama
 
Feb 2019 Market Reports for the Bozeman Area
Feb 2019 Market Reports for the Bozeman AreaFeb 2019 Market Reports for the Bozeman Area
Feb 2019 Market Reports for the Bozeman AreaReferred Realty Group
 
Austin Real Estate Market Report May 2013
Austin Real Estate Market Report May 2013 Austin Real Estate Market Report May 2013
Austin Real Estate Market Report May 2013 austinhometeam
 
Massachusetts statewide closed sales for condos and single family homes
Massachusetts statewide closed sales for condos and single family homesMassachusetts statewide closed sales for condos and single family homes
Massachusetts statewide closed sales for condos and single family homesMichael Mahoney
 
July 2019 Gallatin Valley Market Reports
July 2019 Gallatin Valley Market ReportsJuly 2019 Gallatin Valley Market Reports
July 2019 Gallatin Valley Market ReportsReferred Realty Group
 
Georgia Housing Market Snapshot For October 2018
Georgia Housing Market Snapshot For October 2018Georgia Housing Market Snapshot For October 2018
Georgia Housing Market Snapshot For October 2018Arthur Prescott
 

What's hot (20)

June 2018 Gallatin Valley Market Reports
June 2018 Gallatin Valley Market ReportsJune 2018 Gallatin Valley Market Reports
June 2018 Gallatin Valley Market Reports
 
#HomeSalesShow Nov 2017 Market Reports
#HomeSalesShow Nov 2017 Market Reports#HomeSalesShow Nov 2017 Market Reports
#HomeSalesShow Nov 2017 Market Reports
 
May 2019 Gallatin Valley Market Reports
May 2019 Gallatin Valley Market ReportsMay 2019 Gallatin Valley Market Reports
May 2019 Gallatin Valley Market Reports
 
August 2019 Market Reports for Bozeman
August 2019 Market Reports for BozemanAugust 2019 Market Reports for Bozeman
August 2019 Market Reports for Bozeman
 
Bozeman and Surrounding Communities June 2019 Market Report
Bozeman and Surrounding Communities June 2019 Market ReportBozeman and Surrounding Communities June 2019 Market Report
Bozeman and Surrounding Communities June 2019 Market Report
 
March 2019 Market Report
March 2019 Market ReportMarch 2019 Market Report
March 2019 Market Report
 
Oct 2019 Market Reports
Oct 2019 Market ReportsOct 2019 Market Reports
Oct 2019 Market Reports
 
April 2019 Market Reports for the Gallatin Valley
April 2019 Market Reports for the Gallatin ValleyApril 2019 Market Reports for the Gallatin Valley
April 2019 Market Reports for the Gallatin Valley
 
Charlotte region -monthly indicators - feb 2018
Charlotte region -monthly indicators - feb 2018Charlotte region -monthly indicators - feb 2018
Charlotte region -monthly indicators - feb 2018
 
Georgia Housing Market Snapshot For September 2018
Georgia Housing Market Snapshot For September 2018Georgia Housing Market Snapshot For September 2018
Georgia Housing Market Snapshot For September 2018
 
San Francisco Market Focus April 2018
San Francisco Market Focus April 2018San Francisco Market Focus April 2018
San Francisco Market Focus April 2018
 
#HomeSalesShow Oct 2017 market reports
#HomeSalesShow Oct 2017 market reports#HomeSalesShow Oct 2017 market reports
#HomeSalesShow Oct 2017 market reports
 
Jan 2019 Gallatin Valley Market Reports
Jan 2019 Gallatin Valley Market ReportsJan 2019 Gallatin Valley Market Reports
Jan 2019 Gallatin Valley Market Reports
 
San Francisco Market Focus Report November 2018
San Francisco Market Focus Report November 2018San Francisco Market Focus Report November 2018
San Francisco Market Focus Report November 2018
 
Feb 2019 Market Reports for the Bozeman Area
Feb 2019 Market Reports for the Bozeman AreaFeb 2019 Market Reports for the Bozeman Area
Feb 2019 Market Reports for the Bozeman Area
 
September 2019 Market Reports
September 2019 Market ReportsSeptember 2019 Market Reports
September 2019 Market Reports
 
Austin Real Estate Market Report May 2013
Austin Real Estate Market Report May 2013 Austin Real Estate Market Report May 2013
Austin Real Estate Market Report May 2013
 
Massachusetts statewide closed sales for condos and single family homes
Massachusetts statewide closed sales for condos and single family homesMassachusetts statewide closed sales for condos and single family homes
Massachusetts statewide closed sales for condos and single family homes
 
July 2019 Gallatin Valley Market Reports
July 2019 Gallatin Valley Market ReportsJuly 2019 Gallatin Valley Market Reports
July 2019 Gallatin Valley Market Reports
 
Georgia Housing Market Snapshot For October 2018
Georgia Housing Market Snapshot For October 2018Georgia Housing Market Snapshot For October 2018
Georgia Housing Market Snapshot For October 2018
 

Similar to May 2018 Market Reports

Georgia Housing Market Snapshot For November 2018
Georgia Housing Market Snapshot For November 2018Georgia Housing Market Snapshot For November 2018
Georgia Housing Market Snapshot For November 2018Arthur Prescott
 
San Francisco Market Focus Report May
San Francisco Market Focus Report MaySan Francisco Market Focus Report May
San Francisco Market Focus Report MayRonny Budiutama
 
San Francisco Market Focus Report October 2018
San Francisco Market Focus Report October 2018San Francisco Market Focus Report October 2018
San Francisco Market Focus Report October 2018Ronny Budiutama
 
San Francisco Market Focus Report September 2018
San Francisco Market Focus Report September 2018San Francisco Market Focus Report September 2018
San Francisco Market Focus Report September 2018Ronny Budiutama
 
Georgia Housing Market Snapshot: June 2018. Courtesy of the Georgia Associat...
Georgia Housing Market Snapshot: June 2018.  Courtesy of the Georgia Associat...Georgia Housing Market Snapshot: June 2018.  Courtesy of the Georgia Associat...
Georgia Housing Market Snapshot: June 2018. Courtesy of the Georgia Associat...Arthur Prescott
 
San Francisco Market Focus Report Aug 2018
San Francisco Market Focus Report Aug 2018San Francisco Market Focus Report Aug 2018
San Francisco Market Focus Report Aug 2018Ronny Budiutama
 
San Francisco Market Focus February 2018
San Francisco Market Focus February 2018San Francisco Market Focus February 2018
San Francisco Market Focus February 2018Ronny Budiutama
 
San Francisco Market Focus Report July
San Francisco Market Focus Report JulySan Francisco Market Focus Report July
San Francisco Market Focus Report JulyRonny Budiutama
 
Greater Baton Rouge Home Sales December 2017 Update provided by GBRAR.
Greater Baton Rouge Home Sales December 2017 Update provided by GBRAR. Greater Baton Rouge Home Sales December 2017 Update provided by GBRAR.
Greater Baton Rouge Home Sales December 2017 Update provided by GBRAR. Bill Cobb, Appraiser
 
Georgia Housing Market Snapshot For July. Gar mmi 2018-07
Georgia Housing Market Snapshot For July. Gar mmi 2018-07Georgia Housing Market Snapshot For July. Gar mmi 2018-07
Georgia Housing Market Snapshot For July. Gar mmi 2018-07Arthur Prescott
 
Georgia Housing Market Snapshot For March 2019
Georgia Housing Market Snapshot For March 2019Georgia Housing Market Snapshot For March 2019
Georgia Housing Market Snapshot For March 2019Arthur Prescott
 

Similar to May 2018 Market Reports (12)

March 2020 Market Data
March 2020 Market DataMarch 2020 Market Data
March 2020 Market Data
 
Georgia Housing Market Snapshot For November 2018
Georgia Housing Market Snapshot For November 2018Georgia Housing Market Snapshot For November 2018
Georgia Housing Market Snapshot For November 2018
 
San Francisco Market Focus Report May
San Francisco Market Focus Report MaySan Francisco Market Focus Report May
San Francisco Market Focus Report May
 
San Francisco Market Focus Report October 2018
San Francisco Market Focus Report October 2018San Francisco Market Focus Report October 2018
San Francisco Market Focus Report October 2018
 
San Francisco Market Focus Report September 2018
San Francisco Market Focus Report September 2018San Francisco Market Focus Report September 2018
San Francisco Market Focus Report September 2018
 
Georgia Housing Market Snapshot: June 2018. Courtesy of the Georgia Associat...
Georgia Housing Market Snapshot: June 2018.  Courtesy of the Georgia Associat...Georgia Housing Market Snapshot: June 2018.  Courtesy of the Georgia Associat...
Georgia Housing Market Snapshot: June 2018. Courtesy of the Georgia Associat...
 
San Francisco Market Focus Report Aug 2018
San Francisco Market Focus Report Aug 2018San Francisco Market Focus Report Aug 2018
San Francisco Market Focus Report Aug 2018
 
San Francisco Market Focus February 2018
San Francisco Market Focus February 2018San Francisco Market Focus February 2018
San Francisco Market Focus February 2018
 
San Francisco Market Focus Report July
San Francisco Market Focus Report JulySan Francisco Market Focus Report July
San Francisco Market Focus Report July
 
Greater Baton Rouge Home Sales December 2017 Update provided by GBRAR.
Greater Baton Rouge Home Sales December 2017 Update provided by GBRAR. Greater Baton Rouge Home Sales December 2017 Update provided by GBRAR.
Greater Baton Rouge Home Sales December 2017 Update provided by GBRAR.
 
Georgia Housing Market Snapshot For July. Gar mmi 2018-07
Georgia Housing Market Snapshot For July. Gar mmi 2018-07Georgia Housing Market Snapshot For July. Gar mmi 2018-07
Georgia Housing Market Snapshot For July. Gar mmi 2018-07
 
Georgia Housing Market Snapshot For March 2019
Georgia Housing Market Snapshot For March 2019Georgia Housing Market Snapshot For March 2019
Georgia Housing Market Snapshot For March 2019
 

More from Referred Realty Group

Bozeman March 2022 Real Estate Market Report
Bozeman March 2022 Real Estate Market ReportBozeman March 2022 Real Estate Market Report
Bozeman March 2022 Real Estate Market ReportReferred Realty Group
 
Feb 2022 Market Report for Bozeman, MT
Feb 2022 Market Report for Bozeman, MTFeb 2022 Market Report for Bozeman, MT
Feb 2022 Market Report for Bozeman, MTReferred Realty Group
 
January 2022 Bozeman real estate stats
January 2022 Bozeman real estate statsJanuary 2022 Bozeman real estate stats
January 2022 Bozeman real estate statsReferred Realty Group
 
December and Year End 2018 Sales Data
December and Year End 2018 Sales DataDecember and Year End 2018 Sales Data
December and Year End 2018 Sales DataReferred Realty Group
 
November 2018 Real Estate Update, The Woodlands, TX
November 2018 Real Estate Update, The Woodlands, TXNovember 2018 Real Estate Update, The Woodlands, TX
November 2018 Real Estate Update, The Woodlands, TXReferred Realty Group
 
October 2018 Real Estate Update for The Woodlands, Texas
October 2018 Real Estate Update for The Woodlands, TexasOctober 2018 Real Estate Update for The Woodlands, Texas
October 2018 Real Estate Update for The Woodlands, TexasReferred Realty Group
 
September 2018 Real Estate Update, The Woodlands, Texas
September 2018 Real Estate Update, The Woodlands, TexasSeptember 2018 Real Estate Update, The Woodlands, Texas
September 2018 Real Estate Update, The Woodlands, TexasReferred Realty Group
 
August 2018 Real Estate Update for The Woodlands, Texas
August 2018 Real Estate Update for The Woodlands, TexasAugust 2018 Real Estate Update for The Woodlands, Texas
August 2018 Real Estate Update for The Woodlands, TexasReferred Realty Group
 
July 2018 Real Estate Update for The Woodlands, Texas
July 2018 Real Estate Update for The Woodlands, TexasJuly 2018 Real Estate Update for The Woodlands, Texas
July 2018 Real Estate Update for The Woodlands, TexasReferred Realty Group
 
May 2018 Real Estate Update for The Woodlands, Texas
May 2018 Real Estate Update for The Woodlands, TexasMay 2018 Real Estate Update for The Woodlands, Texas
May 2018 Real Estate Update for The Woodlands, TexasReferred Realty Group
 

More from Referred Realty Group (12)

Apr 22 Market Reports
Apr 22 Market ReportsApr 22 Market Reports
Apr 22 Market Reports
 
Bozeman March 2022 Real Estate Market Report
Bozeman March 2022 Real Estate Market ReportBozeman March 2022 Real Estate Market Report
Bozeman March 2022 Real Estate Market Report
 
Feb 2022 Market Report for Bozeman, MT
Feb 2022 Market Report for Bozeman, MTFeb 2022 Market Report for Bozeman, MT
Feb 2022 Market Report for Bozeman, MT
 
January 2022 Bozeman real estate stats
January 2022 Bozeman real estate statsJanuary 2022 Bozeman real estate stats
January 2022 Bozeman real estate stats
 
December and Year End 2018 Sales Data
December and Year End 2018 Sales DataDecember and Year End 2018 Sales Data
December and Year End 2018 Sales Data
 
November 2018 Real Estate Update, The Woodlands, TX
November 2018 Real Estate Update, The Woodlands, TXNovember 2018 Real Estate Update, The Woodlands, TX
November 2018 Real Estate Update, The Woodlands, TX
 
October 2018 Real Estate Update for The Woodlands, Texas
October 2018 Real Estate Update for The Woodlands, TexasOctober 2018 Real Estate Update for The Woodlands, Texas
October 2018 Real Estate Update for The Woodlands, Texas
 
September 2018 Real Estate Update, The Woodlands, Texas
September 2018 Real Estate Update, The Woodlands, TexasSeptember 2018 Real Estate Update, The Woodlands, Texas
September 2018 Real Estate Update, The Woodlands, Texas
 
August 2018 Real Estate Update for The Woodlands, Texas
August 2018 Real Estate Update for The Woodlands, TexasAugust 2018 Real Estate Update for The Woodlands, Texas
August 2018 Real Estate Update for The Woodlands, Texas
 
July 2018 Real Estate Update for The Woodlands, Texas
July 2018 Real Estate Update for The Woodlands, TexasJuly 2018 Real Estate Update for The Woodlands, Texas
July 2018 Real Estate Update for The Woodlands, Texas
 
May 2018 Real Estate Update for The Woodlands, Texas
May 2018 Real Estate Update for The Woodlands, TexasMay 2018 Real Estate Update for The Woodlands, Texas
May 2018 Real Estate Update for The Woodlands, Texas
 
April 2018 Real Estate Update
April 2018 Real Estate UpdateApril 2018 Real Estate Update
April 2018 Real Estate Update
 

Recently uploaded

Kohinoor Courtyard One Wakad Pune | Elegant Living Spaces
Kohinoor Courtyard One Wakad Pune | Elegant Living SpacesKohinoor Courtyard One Wakad Pune | Elegant Living Spaces
Kohinoor Courtyard One Wakad Pune | Elegant Living Spacesaidasheikh47
 
Call girls in Shakti Nagar Delhi~8447779280°/=@/ Short 1500 Night 6000}ESCORT...
Call girls in Shakti Nagar Delhi~8447779280°/=@/ Short 1500 Night 6000}ESCORT...Call girls in Shakti Nagar Delhi~8447779280°/=@/ Short 1500 Night 6000}ESCORT...
Call girls in Shakti Nagar Delhi~8447779280°/=@/ Short 1500 Night 6000}ESCORT...asmaqueen5
 
Ganga Platinum Kharadi Pune brochure.pdf
Ganga Platinum Kharadi Pune brochure.pdfGanga Platinum Kharadi Pune brochure.pdf
Ganga Platinum Kharadi Pune brochure.pdfsabhyara24
 
Kalpataru Exquisite Wakad Pune E-Brochure.pdf
Kalpataru Exquisite Wakad Pune  E-Brochure.pdfKalpataru Exquisite Wakad Pune  E-Brochure.pdf
Kalpataru Exquisite Wakad Pune E-Brochure.pdfManishSaxena95
 
Acibadem Konaklari Uskudar - Listin Turkey
Acibadem Konaklari Uskudar - Listin TurkeyAcibadem Konaklari Uskudar - Listin Turkey
Acibadem Konaklari Uskudar - Listin TurkeyListing Turkey
 
ACE Terra Yamuna Expressway | 8929888700
ACE Terra Yamuna Expressway | 8929888700ACE Terra Yamuna Expressway | 8929888700
ACE Terra Yamuna Expressway | 8929888700Truhomes
 
Kohinoor Teiko Hinjewadi Phase 2 Pune E-Brochure.pdf
Kohinoor Teiko Hinjewadi Phase 2 Pune  E-Brochure.pdfKohinoor Teiko Hinjewadi Phase 2 Pune  E-Brochure.pdf
Kohinoor Teiko Hinjewadi Phase 2 Pune E-Brochure.pdfManishSaxena95
 
Vanam At Purva Soukhyam Guduvanchery.pdf.pdf
Vanam At Purva Soukhyam Guduvanchery.pdf.pdfVanam At Purva Soukhyam Guduvanchery.pdf.pdf
Vanam At Purva Soukhyam Guduvanchery.pdf.pdfkratirudram
 
Low Rate ✨➥9711108085▻✨Call Girls In East Of Kailash (E.K) (Delhi)
Low Rate ✨➥9711108085▻✨Call Girls In East Of Kailash (E.K) (Delhi)Low Rate ✨➥9711108085▻✨Call Girls In East Of Kailash (E.K) (Delhi)
Low Rate ✨➥9711108085▻✨Call Girls In East Of Kailash (E.K) (Delhi)delhi24hrs1
 
Rohan Harita Tathawade Pune Brochure.pdf
Rohan Harita Tathawade Pune Brochure.pdfRohan Harita Tathawade Pune Brochure.pdf
Rohan Harita Tathawade Pune Brochure.pdfabbu831446
 
~Call Girls In Roop Nagar {8447779280}(Low Price) Escort Service In Delhi
~Call Girls In Roop Nagar {8447779280}(Low Price) Escort Service In Delhi~Call Girls In Roop Nagar {8447779280}(Low Price) Escort Service In Delhi
~Call Girls In Roop Nagar {8447779280}(Low Price) Escort Service In Delhiasmaqueen5
 
construction material procurement in India
construction material procurement in Indiaconstruction material procurement in India
construction material procurement in Indiarohanindosup
 
BPTP THE AMAARIO Luxury Project Invest Like Royalty in Sector 37D Gurgaon Dwa...
BPTP THE AMAARIO Luxury Project Invest Like Royalty in Sector 37D Gurgaon Dwa...BPTP THE AMAARIO Luxury Project Invest Like Royalty in Sector 37D Gurgaon Dwa...
BPTP THE AMAARIO Luxury Project Invest Like Royalty in Sector 37D Gurgaon Dwa...ApartmentWala1
 
Real Estate Finance and Investments (2019).pdf
Real Estate Finance and Investments (2019).pdfReal Estate Finance and Investments (2019).pdf
Real Estate Finance and Investments (2019).pdfZahraYusuf9
 
Jaipur Escorts 🥰 8617370543 Call Girls Offer VIP Hot Girls
Jaipur Escorts 🥰 8617370543 Call Girls Offer VIP Hot GirlsJaipur Escorts 🥰 8617370543 Call Girls Offer VIP Hot Girls
Jaipur Escorts 🥰 8617370543 Call Girls Offer VIP Hot GirlsDeepika Singh
 
Yashwin Enchante Uppar Kharadi Pune E-Brochue.pdf
Yashwin Enchante Uppar Kharadi Pune  E-Brochue.pdfYashwin Enchante Uppar Kharadi Pune  E-Brochue.pdf
Yashwin Enchante Uppar Kharadi Pune E-Brochue.pdfManishSaxena95
 
Cheap Rate ✨➥9582086666▻✨Call Girls In Gurgaon Sector 1 (Gurgaon)
Cheap Rate ✨➥9582086666▻✨Call Girls In Gurgaon Sector 1 (Gurgaon)Cheap Rate ✨➥9582086666▻✨Call Girls In Gurgaon Sector 1 (Gurgaon)
Cheap Rate ✨➥9582086666▻✨Call Girls In Gurgaon Sector 1 (Gurgaon)delhi24hrs1
 
Retail Space for Lease - 1221 W. Main St., Sun Prairie, WI
Retail Space for Lease - 1221 W. Main St., Sun Prairie, WIRetail Space for Lease - 1221 W. Main St., Sun Prairie, WI
Retail Space for Lease - 1221 W. Main St., Sun Prairie, WILee & Associates of Madison, WI
 
The Gale at Godrej Park World Hinjewadi Pune Brochure.pdf
The Gale at Godrej Park World Hinjewadi Pune Brochure.pdfThe Gale at Godrej Park World Hinjewadi Pune Brochure.pdf
The Gale at Godrej Park World Hinjewadi Pune Brochure.pdfPrachiRudram
 
MEQ Mainstreet Equity Corp Q2 2024 Investor Presentation
MEQ Mainstreet Equity Corp Q2 2024 Investor PresentationMEQ Mainstreet Equity Corp Q2 2024 Investor Presentation
MEQ Mainstreet Equity Corp Q2 2024 Investor PresentationMEQ - Mainstreet Equity Corp.
 

Recently uploaded (20)

Kohinoor Courtyard One Wakad Pune | Elegant Living Spaces
Kohinoor Courtyard One Wakad Pune | Elegant Living SpacesKohinoor Courtyard One Wakad Pune | Elegant Living Spaces
Kohinoor Courtyard One Wakad Pune | Elegant Living Spaces
 
Call girls in Shakti Nagar Delhi~8447779280°/=@/ Short 1500 Night 6000}ESCORT...
Call girls in Shakti Nagar Delhi~8447779280°/=@/ Short 1500 Night 6000}ESCORT...Call girls in Shakti Nagar Delhi~8447779280°/=@/ Short 1500 Night 6000}ESCORT...
Call girls in Shakti Nagar Delhi~8447779280°/=@/ Short 1500 Night 6000}ESCORT...
 
Ganga Platinum Kharadi Pune brochure.pdf
Ganga Platinum Kharadi Pune brochure.pdfGanga Platinum Kharadi Pune brochure.pdf
Ganga Platinum Kharadi Pune brochure.pdf
 
Kalpataru Exquisite Wakad Pune E-Brochure.pdf
Kalpataru Exquisite Wakad Pune  E-Brochure.pdfKalpataru Exquisite Wakad Pune  E-Brochure.pdf
Kalpataru Exquisite Wakad Pune E-Brochure.pdf
 
Acibadem Konaklari Uskudar - Listin Turkey
Acibadem Konaklari Uskudar - Listin TurkeyAcibadem Konaklari Uskudar - Listin Turkey
Acibadem Konaklari Uskudar - Listin Turkey
 
ACE Terra Yamuna Expressway | 8929888700
ACE Terra Yamuna Expressway | 8929888700ACE Terra Yamuna Expressway | 8929888700
ACE Terra Yamuna Expressway | 8929888700
 
Kohinoor Teiko Hinjewadi Phase 2 Pune E-Brochure.pdf
Kohinoor Teiko Hinjewadi Phase 2 Pune  E-Brochure.pdfKohinoor Teiko Hinjewadi Phase 2 Pune  E-Brochure.pdf
Kohinoor Teiko Hinjewadi Phase 2 Pune E-Brochure.pdf
 
Vanam At Purva Soukhyam Guduvanchery.pdf.pdf
Vanam At Purva Soukhyam Guduvanchery.pdf.pdfVanam At Purva Soukhyam Guduvanchery.pdf.pdf
Vanam At Purva Soukhyam Guduvanchery.pdf.pdf
 
Low Rate ✨➥9711108085▻✨Call Girls In East Of Kailash (E.K) (Delhi)
Low Rate ✨➥9711108085▻✨Call Girls In East Of Kailash (E.K) (Delhi)Low Rate ✨➥9711108085▻✨Call Girls In East Of Kailash (E.K) (Delhi)
Low Rate ✨➥9711108085▻✨Call Girls In East Of Kailash (E.K) (Delhi)
 
Rohan Harita Tathawade Pune Brochure.pdf
Rohan Harita Tathawade Pune Brochure.pdfRohan Harita Tathawade Pune Brochure.pdf
Rohan Harita Tathawade Pune Brochure.pdf
 
~Call Girls In Roop Nagar {8447779280}(Low Price) Escort Service In Delhi
~Call Girls In Roop Nagar {8447779280}(Low Price) Escort Service In Delhi~Call Girls In Roop Nagar {8447779280}(Low Price) Escort Service In Delhi
~Call Girls In Roop Nagar {8447779280}(Low Price) Escort Service In Delhi
 
construction material procurement in India
construction material procurement in Indiaconstruction material procurement in India
construction material procurement in India
 
BPTP THE AMAARIO Luxury Project Invest Like Royalty in Sector 37D Gurgaon Dwa...
BPTP THE AMAARIO Luxury Project Invest Like Royalty in Sector 37D Gurgaon Dwa...BPTP THE AMAARIO Luxury Project Invest Like Royalty in Sector 37D Gurgaon Dwa...
BPTP THE AMAARIO Luxury Project Invest Like Royalty in Sector 37D Gurgaon Dwa...
 
Real Estate Finance and Investments (2019).pdf
Real Estate Finance and Investments (2019).pdfReal Estate Finance and Investments (2019).pdf
Real Estate Finance and Investments (2019).pdf
 
Jaipur Escorts 🥰 8617370543 Call Girls Offer VIP Hot Girls
Jaipur Escorts 🥰 8617370543 Call Girls Offer VIP Hot GirlsJaipur Escorts 🥰 8617370543 Call Girls Offer VIP Hot Girls
Jaipur Escorts 🥰 8617370543 Call Girls Offer VIP Hot Girls
 
Yashwin Enchante Uppar Kharadi Pune E-Brochue.pdf
Yashwin Enchante Uppar Kharadi Pune  E-Brochue.pdfYashwin Enchante Uppar Kharadi Pune  E-Brochue.pdf
Yashwin Enchante Uppar Kharadi Pune E-Brochue.pdf
 
Cheap Rate ✨➥9582086666▻✨Call Girls In Gurgaon Sector 1 (Gurgaon)
Cheap Rate ✨➥9582086666▻✨Call Girls In Gurgaon Sector 1 (Gurgaon)Cheap Rate ✨➥9582086666▻✨Call Girls In Gurgaon Sector 1 (Gurgaon)
Cheap Rate ✨➥9582086666▻✨Call Girls In Gurgaon Sector 1 (Gurgaon)
 
Retail Space for Lease - 1221 W. Main St., Sun Prairie, WI
Retail Space for Lease - 1221 W. Main St., Sun Prairie, WIRetail Space for Lease - 1221 W. Main St., Sun Prairie, WI
Retail Space for Lease - 1221 W. Main St., Sun Prairie, WI
 
The Gale at Godrej Park World Hinjewadi Pune Brochure.pdf
The Gale at Godrej Park World Hinjewadi Pune Brochure.pdfThe Gale at Godrej Park World Hinjewadi Pune Brochure.pdf
The Gale at Godrej Park World Hinjewadi Pune Brochure.pdf
 
MEQ Mainstreet Equity Corp Q2 2024 Investor Presentation
MEQ Mainstreet Equity Corp Q2 2024 Investor PresentationMEQ Mainstreet Equity Corp Q2 2024 Investor Presentation
MEQ Mainstreet Equity Corp Q2 2024 Investor Presentation
 

May 2018 Market Reports

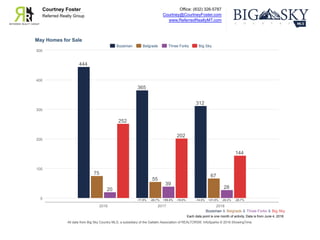
  • 1. Office: (832) 326-5787 Courtney@CourtneyFoster.com www.ReferredRealtyMT.com Courtney Foster Referred Realty Group Each data point is one month of activity. Data is from June 4, 2018. All data from Big Sky Country MLS, a subsidiary of the Gallatin Association of REALTORS®. InfoSparks © 2018 ShowingTime. May Homes for Sale Bozeman & Belgrade & Three Forks & Big Sky 0 100 200 300 400 500 2016 2017 2018 444 365 312 -17.8% -14.5% 75 55 67 -26.7% +21.8% 20 39 28 +95.0% -28.2% 252 202 144 -19.8% -28.7% Bozeman Belgrade Three Forks Big Sky
  • 2. Office: (832) 326-5787 Courtney@CourtneyFoster.com www.ReferredRealtyMT.com Courtney Foster Referred Realty Group Each data point is one month of activity. Data is from June 4, 2018. All data from Big Sky Country MLS, a subsidiary of the Gallatin Association of REALTORS®. InfoSparks © 2018 ShowingTime. May New Listings Bozeman & Belgrade & Three Forks & Big Sky 0 50 100 150 200 250 2016 2017 2018 211 211 192 0.0% -9.0% 65 63 76 -3.1% +20.6% 12 15 12 +25.0% -20.0% 32 29 20 -9.4% -31.0% Bozeman Belgrade Three Forks Big Sky
  • 3. Office: (832) 326-5787 Courtney@CourtneyFoster.com www.ReferredRealtyMT.com Courtney Foster Referred Realty Group Each data point is one month of activity. Data is from June 4, 2018. All data from Big Sky Country MLS, a subsidiary of the Gallatin Association of REALTORS®. InfoSparks © 2018 ShowingTime. May Pending Sales Bozeman & Belgrade & Three Forks & Big Sky 0 50 100 150 200 2016 2017 2018 179 162 152 -9.5% -6.2% 55 47 64 -14.5% +36.2% 8 6 14 -25.0% +133.3% 14 12 16 -14.3% +33.3% Bozeman Belgrade Three Forks Big Sky
  • 4. Office: (832) 326-5787 Courtney@CourtneyFoster.com www.ReferredRealtyMT.com Courtney Foster Referred Realty Group Each data point is one month of activity. Data is from June 4, 2018. All data from Big Sky Country MLS, a subsidiary of the Gallatin Association of REALTORS®. InfoSparks © 2018 ShowingTime. May Closed Sales Bozeman & Belgrade & Three Forks & Big Sky 0 25 50 75 100 125 150 175 2016 2017 2018 158 146 154 -7.6% +5.5% 34 36 45 +5.9% +25.0% 6 7 6 +16.7% -14.3% 20 24 30 +20.0% +25.0% Bozeman Belgrade Three Forks Big Sky
  • 5. Office: (832) 326-5787 Courtney@CourtneyFoster.com www.ReferredRealtyMT.com Courtney Foster Referred Realty Group Each data point is activity year to date. Data is from June 4, 2018. All data from Big Sky Country MLS, a subsidiary of the Gallatin Association of REALTORS®. InfoSparks © 2018 ShowingTime. May Closed Sales Bozeman & Belgrade & Three Forks & Big Sky 0 100 200 300 400 500 600 700 2016 2017 2018 557 515 558 -7.5% +8.3% 141 162 162 +14.9% 0.0% 23 16 25 -30.4% +56.3% 87 101 124 +16.1% +22.8% Bozeman Belgrade Three Forks Big Sky
  • 6. Office: (832) 326-5787 Courtney@CourtneyFoster.com www.ReferredRealtyMT.com Courtney Foster Referred Realty Group Each data point is activity year to date. Data is from June 4, 2018. All data from Big Sky Country MLS, a subsidiary of the Gallatin Association of REALTORS®. InfoSparks © 2018 ShowingTime. May Average Sales Price Bozeman & Belgrade & Three Forks & Big Sky $0 $0.2M $0.4M $0.6M $0.8M $1.0M 2016 2017 2018 $369,957 $421,705 $466,295 +14.0% +10.6% $250,273 $287,524 $312,915 +14.9% +8.8% $231,319 $203,984 $253,328 -11.8% +24.2% $674,063 $738,960 $883,437 +9.6% +19.6% Bozeman Belgrade Three Forks Big Sky
  • 7. Office: (832) 326-5787 Courtney@CourtneyFoster.com www.ReferredRealtyMT.com Courtney Foster Referred Realty Group Each data point is one month of activity. Data is from June 4, 2018. All data from Big Sky Country MLS, a subsidiary of the Gallatin Association of REALTORS®. InfoSparks © 2018 ShowingTime. May Months Supply of Homes for Sale Bozeman & Belgrade & Three Forks & Big Sky 0.0 10.0 2.5 5.0 7.5 12.5 15.0 17.5 2016 2017 2018 3.3 2.9 2.5 -12.1% -13.8% 2.2 1.5 1.7 -31.8% +13.3% 3.4 7.5 3.5 +120.6% -53.3% 13.7 9.1 6.0 -33.6% -34.1% Bozeman Belgrade Three Forks Big Sky
  • 8. Office: (832) 326-5787 Courtney@CourtneyFoster.com www.ReferredRealtyMT.com Courtney Foster Referred Realty Group Each data point is one month of activity. Data is from June 4, 2018. All data from Big Sky Country MLS, a subsidiary of the Gallatin Association of REALTORS®. InfoSparks © 2018 ShowingTime. May Median Days on Market Bozeman & Belgrade & Three Forks & Big Sky 0 20 40 60 80 100 120 2016 2017 2018 33 11 11 -66.7% 0.0% 18 9 13 -50.0% +44.4% 12 41 50 +241.7% +22.0% 101 107 57 +5.9% -46.7% Bozeman Belgrade Three Forks Big Sky
  • 9. Office: (832) 326-5787 Courtney@CourtneyFoster.com www.ReferredRealtyMT.com Courtney Foster Referred Realty Group Each data point is one month of activity. Data is from June 4, 2018. All data from Big Sky Country MLS, a subsidiary of the Gallatin Association of REALTORS®. InfoSparks © 2018 ShowingTime. May Average Price Per Square Foot Bozeman & Belgrade & Three Forks & Big Sky $0 $100 $200 $300 $400 $500 2016 2017 2018 $172 $194 $219 +12.8% +12.9% $134 $156 $184 +16.4% +17.9% $122 $136 $191 +11.5% +40.4% $304 $266 $379 -12.5% +42.5% Bozeman Belgrade Three Forks Big Sky
  • 10. Local Market Update – April 2018 This is a research tool provided by the Big Sky Country MLS Bozeman City Limits Single Family April Year to Date Key Metrics 2017 2018 % Change Thru 4-2017 Thru 4-2018 % Change New Listings 64 52 - 18.8% 230 215 - 6.5% Pending Sales 64 62 - 3.1% 198 209 + 5.6% Closed Sales 40 54 + 35.0% 134 163 + 21.6% Days on Market Until Sale 70 70 0.0% 77 60 - 22.1% Median Sales Price* $389,450 $429,950 + 10.4% $362,000 $425,000 + 17.4% Average Sales Price* $420,210 $461,846 + 9.9% $411,800 $462,773 + 12.4% Percent of List Price Received* 99.4% 98.9% - 0.5% 99.7% 99.3% - 0.4% Inventory of Homes for Sale 115 85 - 26.1% –– –– –– Months Supply of Inventory 2.4 1.8 - 25.0% –– –– –– Condo/Townhouse April Year to Date Key Metrics 2017 2018 % Change Thru 4-2017 Thru 4-2018 % Change New Listings 58 44 - 24.1% 183 151 - 17.5% Pending Sales 46 49 + 6.5% 159 159 0.0% Closed Sales 29 32 + 10.3% 109 115 + 5.5% Days on Market Until Sale 58 69 + 19.0% 124 72 - 41.9% Median Sales Price* $279,900 $303,065 + 8.3% $278,279 $299,900 + 7.8% Average Sales Price* $320,197 $311,038 - 2.9% $334,173 $355,235 + 6.3% Percent of List Price Received* 99.0% 99.7% + 0.7% 99.6% 99.6% 0.0% Inventory of Homes for Sale 67 71 + 6.0% –– –– –– Months Supply of Inventory 1.8 1.9 + 5.6% –– –– –– * Does not account for sale concessions and/or downpayment assistance. | Percent changes are calculated using rounded figures and can sometimes look extreme due to small sample size. A rolling 12-month calculation represents the current month and the 11 months prior in a single data point. If no activity occurred during a month, the line extends to the next available data point. Median Sales Price - Single Family Rolling 12-Month Calculation Gallatin County Bozeman City Limits 1-2003 1-2005 1-2007 1-2009 1-2011 1-2013 1-2015 1-2017 $150,000 $200,000 $250,000 $300,000 $350,000 $400,000 $450,000 Median Sales Price - Condo Rolling 12-Month Calculation Gallatin County Bozeman City Limits 1-2003 1-2005 1-2007 1-2009 1-2011 1-2013 1-2015 1-2017 $100,000 $150,000 $200,000 $250,000 $300,000 Current as of May 10, 2018. All data from Big Sky Country Multiple Listing Service®. Report © 2018 ShowingTime.
  • 11. Local Market Update – April 2018 This is a research tool provided by the Big Sky Country MLS Belgrade Single Family April Year to Date Key Metrics 2017 2018 % Change Thru 4-2017 Thru 4-2018 % Change New Listings 31 35 + 12.9% 121 119 - 1.7% Pending Sales 37 35 - 5.4% 127 111 - 12.6% Closed Sales 27 28 + 3.7% 96 87 - 9.4% Days on Market Until Sale 36 13 - 63.9% 61 41 - 32.8% Median Sales Price* $279,500 $286,000 + 2.3% $275,000 $285,000 + 3.6% Average Sales Price* $302,430 $296,677 - 1.9% $299,139 $324,601 + 8.5% Percent of List Price Received* 99.4% 99.4% 0.0% 98.6% 98.9% + 0.3% Inventory of Homes for Sale 27 40 + 48.1% –– –– –– Months Supply of Inventory 1.0 1.4 + 40.0% –– –– –– Condo/Townhouse April Year to Date Key Metrics 2017 2018 % Change Thru 4-2017 Thru 4-2018 % Change New Listings 10 10 0.0% 31 39 + 25.8% Pending Sales 8 10 + 25.0% 29 34 + 17.2% Closed Sales 8 10 + 25.0% 18 21 + 16.7% Days on Market Until Sale 12 15 + 25.0% 28 30 + 7.1% Median Sales Price* $192,450 $242,450 + 26.0% $174,250 $211,000 + 21.1% Average Sales Price* $190,988 $240,840 + 26.1% $178,006 $228,410 + 28.3% Percent of List Price Received* 100.1% 100.0% - 0.1% 99.8% 99.5% - 0.3% Inventory of Homes for Sale 8 13 + 62.5% –– –– –– Months Supply of Inventory 1.1 1.8 + 63.6% –– –– –– * Does not account for sale concessions and/or downpayment assistance. | Percent changes are calculated using rounded figures and can sometimes look extreme due to small sample size. A rolling 12-month calculation represents the current month and the 11 months prior in a single data point. If no activity occurred during a month, the line extends to the next available data point. Median Sales Price - Single Family Rolling 12-Month Calculation Gallatin County Belgrade 1-2003 1-2005 1-2007 1-2009 1-2011 1-2013 1-2015 1-2017 $100,000 $150,000 $200,000 $250,000 $300,000 $350,000 $400,000 Median Sales Price - Condo Rolling 12-Month Calculation Gallatin County Belgrade 1-2003 1-2005 1-2007 1-2009 1-2011 1-2013 1-2015 1-2017 $50,000 $100,000 $150,000 $200,000 $250,000 $300,000 Current as of May 10, 2018. All data from Big Sky Country Multiple Listing Service®. Report © 2018 ShowingTime.
  • 12. Local Market Update – April 2018 This is a research tool provided by the Big Sky Country MLS Greater Big Sky Single Family April Year to Date Key Metrics 2017 2018 % Change Thru 4-2017 Thru 4-2018 % Change New Listings 7 4 - 42.9% 30 36 + 20.0% Pending Sales 8 13 + 62.5% 25 45 + 80.0% Closed Sales 6 10 + 66.7% 18 27 + 50.0% Days on Market Until Sale 192 151 - 21.4% 172 157 - 8.7% Median Sales Price* $2,135,000 $1,518,000 - 28.9% $1,067,500 $1,471,500 + 37.8% Average Sales Price* $2,107,500 $2,210,356 + 4.9% $1,469,327 $1,830,341 + 24.6% Percent of List Price Received* 93.3% 94.9% + 1.7% 95.1% 97.3% + 2.3% Inventory of Homes for Sale 78 49 - 37.2% –– –– –– Months Supply of Inventory 12.3 6.0 - 51.2% –– –– –– Condo/Townhouse April Year to Date Key Metrics 2017 2018 % Change Thru 4-2017 Thru 4-2018 % Change New Listings 11 10 - 9.1% 65 62 - 4.6% Pending Sales 18 8 - 55.6% 73 73 0.0% Closed Sales 15 25 + 66.7% 51 62 + 21.6% Days on Market Until Sale 85 157 + 84.7% 166 122 - 26.5% Median Sales Price* $413,000 $460,000 + 11.4% $372,500 $387,900 + 4.1% Average Sales Price* $464,037 $582,531 + 25.5% $475,912 $487,195 + 2.4% Percent of List Price Received* 99.3% 96.5% - 2.8% 96.6% 96.7% + 0.1% Inventory of Homes for Sale 97 93 - 4.1% –– –– –– Months Supply of Inventory 6.3 6.5 + 3.2% –– –– –– * Does not account for sale concessions and/or downpayment assistance. | Percent changes are calculated using rounded figures and can sometimes look extreme due to small sample size. A rolling 12-month calculation represents the current month and the 11 months prior in a single data point. If no activity occurred during a month, the line extends to the next available data point. Median Sales Price - Single Family Rolling 12-Month Calculation Gallatin County Greater Big Sky 1-2003 1-2005 1-2007 1-2009 1-2011 1-2013 1-2015 1-2017 $0 $500,000 $1,000,000 $1,500,000 $2,000,000 Median Sales Price - Condo Rolling 12-Month Calculation Gallatin County Greater Big Sky 1-2003 1-2005 1-2007 1-2009 1-2011 1-2013 1-2015 1-2017 $0 $100,000 $200,000 $300,000 $400,000 $500,000 $600,000 Current as of May 10, 2018. All data from Big Sky Country Multiple Listing Service®. Report © 2018 ShowingTime.
  • 13. Local Market Update – April 2018 This is a research tool provided by the Big Sky Country MLS Livingston City Limits Single Family April Year to Date Key Metrics 2017 2018 % Change Thru 4-2017 Thru 4-2018 % Change New Listings 18 12 - 33.3% 54 42 - 22.2% Pending Sales 14 14 0.0% 59 40 - 32.2% Closed Sales 15 11 - 26.7% 39 36 - 7.7% Days on Market Until Sale 79 67 - 15.2% 77 46 - 40.3% Median Sales Price* $229,900 $278,000 + 20.9% $215,000 $265,000 + 23.3% Average Sales Price* $234,869 $295,060 + 25.6% $228,463 $267,815 + 17.2% Percent of List Price Received* 95.9% 97.1% + 1.3% 96.6% 96.9% + 0.3% Inventory of Homes for Sale 27 23 - 14.8% –– –– –– Months Supply of Inventory 2.3 2.0 - 13.0% –– –– –– Condo/Townhouse April Year to Date Key Metrics 2017 2018 % Change Thru 4-2017 Thru 4-2018 % Change New Listings 3 4 + 33.3% 6 10 + 66.7% Pending Sales 2 7 + 250.0% 3 13 + 333.3% Closed Sales 1 0 - 100.0% 2 9 + 350.0% Days on Market Until Sale 14 –– –– 45 38 - 15.6% Median Sales Price* $325,000 –– –– $236,500 $218,000 - 7.8% Average Sales Price* $325,000 –– –– $236,500 $217,878 - 7.9% Percent of List Price Received* 92.9% –– –– 94.8% 97.1% + 2.4% Inventory of Homes for Sale 4 3 - 25.0% –– –– –– Months Supply of Inventory 2.4 0.8 - 66.7% –– –– –– * Does not account for sale concessions and/or downpayment assistance. | Percent changes are calculated using rounded figures and can sometimes look extreme due to small sample size. A rolling 12-month calculation represents the current month and the 11 months prior in a single data point. If no activity occurred during a month, the line extends to the next available data point. Median Sales Price - Single Family Rolling 12-Month Calculation Gallatin County Livingston City Limits 1-2003 1-2005 1-2007 1-2009 1-2011 1-2013 1-2015 1-2017 $50,000 $100,000 $150,000 $200,000 $250,000 $300,000 $350,000 $400,000 Median Sales Price - Condo Rolling 12-Month Calculation Gallatin County Livingston City Limits 1-2003 1-2005 1-2007 1-2009 1-2011 1-2013 1-2015 1-2017 $50,000 $100,000 $150,000 $200,000 $250,000 $300,000 Current as of May 10, 2018. All data from Big Sky Country Multiple Listing Service®. Report © 2018 ShowingTime.