SlideShare a Scribd company logo
1 of 15
Download to read offline
June 2019 Activity Snapshot
One-Year Change in One-Year Change in
Closed Sales Median Sales Price
2
3
4
5
6
7
8
9
10
11
12
Monthly Indicators
- 6.2% + 10.0% + 1.7%
One-Year Change in
Current as of July 10, 2019. All data from the Greater Baton Rouge Association of REALTORS® MLS. Information deemed reliable but not guaranteed. Report © 2019 ShowingTime.
Pending Sales
Closed Sales
Days on Market Until Sale
Median Sales Price
Average Sales Price
Percent of List Price Received
As was widely expected, the Federal Reserve did not change the target range
for the federal funds rate – currently set at 2.25 to 2.5 percent – during their
June meeting. Although the economy is still performing well due to factors such
as low unemployment and solid retail sales, uncertainty remains regarding trade
tensions, slowed manufacturing and meek business investments.
New Listings were down 6.3 percent to 1,457. Pending Sales increased 5.9
percent to 1,113. Inventory grew 1.7 percent to 4,419 units.
Prices moved higher as Median Sales Price was up 10.0 percent to $220,000.
Days on Market increased 29.3 percent to 75 days. Months Supply of Inventory
was up 2.1 percent to 4.9 months, indicating that supply increased relative to
demand.
In terms of relative balance between buyer and seller interests, residential real
estate markets across the country are performing well within an economic
expansion that will become the longest in U.S. history in July. However, there
are signs of a slowing economy. The Federal Reserve considers 2.0 percent a
healthy inflation rate, but the U.S. is expected to remain below that this year.
The Fed has received pressure from the White House to cut rates in order to
spur further economic activity, and the possibility of a rate reduction in 2019 is
definitely in play following a string of increases over the last several years.
Homes for Sale
A research tool provided by the Greater Baton Rouge Association of
REALTORS®. Residential real estate activity composed of single-family
properties, townhomes and condominiums combined. Percent changes
are calculated using rounded figures.
Activity Overview
New Listings
Housing Affordability Index
Inventory of Homes for Sale
Months Supply of Inventory
Activity Overview
Key Metrics Historical Sparkbars 6-2018 6-2019 Percent Change YTD 2018 YTD 2019 Percent Change
Key metrics by report month and for year-to-date (YTD) starting from the first of the year.
New Listings 1,555 1,457 - 6.3% 8,398 - 2.3%
Pending Sales 1,051 1,113 + 5.9% 5,870 6,011 + 2.4%
8,595
+ 0.1%
Days on Market 58 75 + 29.3% 66 78 + 18.2%
Closed Sales 1,069 1,003 - 6.2% 5,369 5,372
+ 4.1%
Avg. Sales Price $227,392 $254,703 + 12.0% $222,976 $233,922 + 4.9%
Median Sales Price $200,000 $220,000 + 10.0% $197,000 $205,000
Homes for Sale 4,345 4,419 + 1.7% -- --
Months Supply 4.8 4.9 + 2.1% --
Current as of July 10, 2019. All data from the Greater Baton Rouge Association of REALTORS® MLS. Information deemed reliable but not guaranteed. Report © 2019 ShowingTime. | 2
0.0%
Affordability Index 131 123 - 6.1% 133 132 - 0.8%
Pct. of List Price Received 97.8% 98.0% + 0.2% 97.7% 97.7%
--
-- --
6-2016 6-2017 6-2018 6-2019
6-2016 6-2017 6-2018 6-2019
6-2016 6-2017 6-2018 6-2019
6-2016 6-2017 6-2018 6-2019
6-2016 6-2017 6-2018 6-2019
6-2016 6-2017 6-2018 6-2019
6-2016 6-2017 6-2018 6-2019
6-2016 6-2017 6-2018 6-2019
6-2016 6-2017 6-2018 6-2019
6-2016 6-2017 6-2018 6-2019
New Listings
Prior Year Percent Change
July 2018 1,409 1,468 -4.0%
August 2018 1,431 1,404 +1.9%
September 2018 1,052 1,247 -15.6%
October 2018 1,252 1,141 +9.7%
November 2018 1,020 981 +4.0%
December 2018 748 766 -2.3%
January 2019 1,284 1,136 +13.0%
February 2019 1,273 1,330 -4.3%
March 2019 1,421 1,495 -4.9%
April 2019 1,482 1,471 +0.7%
May 2019 1,481 1,608 -7.9%
June 2019 1,457 1,555 -6.3%
12-Month Avg 1,276 1,300 -1.8%
Historical New Listings by Month
Current as of July 10, 2019. All data from the Greater Baton Rouge Association of REALTORS® MLS. Information deemed reliable but not guaranteed. Report © 2019 ShowingTime. | 3
A count of the properties that have been newly listed on the market in a given month.
New Listings
1,404
1,555
1,457
2017 2018 2019
June
0
1,000
2,000
3,000
4,000
1-2003 1-2004 1-2005 1-2006 1-2007 1-2008 1-2009 1-2010 1-2011 1-2012 1-2013 1-2014 1-2015 1-2016 1-2017 1-2018 1-2019
7,921
8,595 8,398
2017 2018 2019
Year to Date
- 2.3%+ 10.8% - 6.3% + 8.5%+ 9.1% + 5.2%
Pending Sales
Prior Year Percent Change
July 2018 988 985 +0.3%
August 2018 928 968 -4.1%
September 2018 749 820 -8.7%
October 2018 765 860 -11.0%
November 2018 703 720 -2.4%
December 2018 595 576 +3.3%
January 2019 804 761 +5.7%
February 2019 885 890 -0.6%
March 2019 1,050 1,085 -3.2%
April 2019 1,099 1,036 +6.1%
May 2019 1,060 1,047 +1.2%
June 2019 1,113 1,051 +5.9%
12-Month Avg 895 900 -0.6%
Historical Pending Sales by Month
Current as of July 10, 2019. All data from the Greater Baton Rouge Association of REALTORS® MLS. Information deemed reliable but not guaranteed. Report © 2019 ShowingTime. | 4
A count of the properties on which offers have been accepted in a given month.
Pending Sales
1,028 1,051
1,113
2017 2018 2019
June
0
500
1,000
1,500
2,000
2,500
3,000
1-2003 1-2004 1-2005 1-2006 1-2007 1-2008 1-2009 1-2010 1-2011 1-2012 1-2013 1-2014 1-2015 1-2016 1-2017 1-2018 1-2019
5,983 5,870 6,011
2017 2018 2019
Year to Date
+ 2.4%+ 2.2% + 5.9% - 1.9%+ 10.7% + 4.9%
Closed Sales
Prior Year Percent Change
July 2018 1,125 1,051 +7.0%
August 2018 1,020 1,048 -2.7%
September 2018 884 900 -1.8%
October 2018 817 875 -6.6%
November 2018 758 832 -8.9%
December 2018 712 784 -9.2%
January 2019 569 625 -9.0%
February 2019 754 703 +7.3%
March 2019 890 982 -9.4%
April 2019 989 954 +3.7%
May 2019 1,167 1,036 +12.6%
June 2019 1,003 1,069 -6.2%
12-Month Avg 891 905 -1.5%
Historical Closed Sales by Month
Current as of July 10, 2019. All data from the Greater Baton Rouge Association of REALTORS® MLS. Information deemed reliable but not guaranteed. Report © 2019 ShowingTime. | 5
A count of the actual sales that closed in a given month.
Closed Sales
1,151
1,069
1,003
2017 2018 2019
June
0
500
1,000
1,500
2,000
1-2003 1-2004 1-2005 1-2006 1-2007 1-2008 1-2009 1-2010 1-2011 1-2012 1-2013 1-2014 1-2015 1-2016 1-2017 1-2018 1-2019
5,714
5,369 5,372
2017 2018 2019
Year to Date
+ 0.1%- 7.1% - 6.2% - 6.0%+ 10.1% + 10.6%
Days on Market Until Sale
Prior Year Percent Change
July 2018 62 50 +24.0%
August 2018 60 48 +25.0%
September 2018 64 56 +14.3%
October 2018 66 56 +17.9%
November 2018 64 58 +10.3%
December 2018 77 67 +14.9%
January 2019 78 67 +16.4%
February 2019 78 69 +13.0%
March 2019 85 75 +13.3%
April 2019 78 64 +21.9%
May 2019 74 65 +13.8%
June 2019 75 58 +29.3%
12-Month Avg* 71 61 +16.4%
Historical Days on Market Until Sale by Month
Current as of July 10, 2019. All data from the Greater Baton Rouge Association of REALTORS® MLS. Information deemed reliable but not guaranteed. Report © 2019 ShowingTime. | 6
Average number of days between when a property is listed and when an offer is accepted in a given month.
Days on Market
* Average Days on Market of all properties from July 2018 through June 2019. This
is not the average of the individual figures above.
58 58
75
2017 2018 2019
June
0
20
40
60
80
100
120
1-2003 1-2004 1-2005 1-2006 1-2007 1-2008 1-2009 1-2010 1-2011 1-2012 1-2013 1-2014 1-2015 1-2016 1-2017 1-2018 1-2019
58
66
78
2017 2018 2019
Year to Date
+ 18.2%0.0% + 29.3% + 13.8%- 13.4% - 21.6%
Median Sales Price
Prior Year Percent Change
July 2018 $201,950 $197,000 +2.5%
August 2018 $199,900 $190,133 +5.1%
September 2018 $208,918 $198,450 +5.3%
October 2018 $197,350 $198,000 -0.3%
November 2018 $203,900 $190,000 +7.3%
December 2018 $204,500 $204,137 +0.2%
January 2019 $205,000 $190,000 +7.9%
February 2019 $195,000 $195,000 0.0%
March 2019 $199,000 $194,000 +2.6%
April 2019 $200,000 $199,000 +0.5%
May 2019 $210,000 $200,000 +5.0%
June 2019 $220,000 $200,000 +10.0%
12-Month Med* $204,650 $196,900 +3.9%
Historical Median Sales Price by Month
Current as of July 10, 2019. All data from the Greater Baton Rouge Association of REALTORS® MLS. Information deemed reliable but not guaranteed. Report © 2019 ShowingTime. | 7
Point at which half of the sales sold for more and half sold for less, not accounting for seller concessions, in a given month.
Median Sales Price
* Median Sales Price of all properties from July 2018 through June 2019. This is not
the average of the individual figures above.
$199,900 $200,000
$220,000
2017 2018 2019
June
$0
$50,000
$100,000
$150,000
$200,000
$250,000
1-2003 1-2004 1-2005 1-2006 1-2007 1-2008 1-2009 1-2010 1-2011 1-2012 1-2013 1-2014 1-2015 1-2016 1-2017 1-2018 1-2019
$184,900
$197,000
$205,000
2017 2018 2019
Year to Date
+ 4.1%+ 0.1% + 10.0% + 6.5%+ 2.4% - 2.0%
Average Sales Price
Prior Year Percent Change
July 2018 $234,807 $223,544 +5.0%
August 2018 $231,149 $220,855 +4.7%
September 2018 $228,312 $217,091 +5.2%
October 2018 $219,499 $227,028 -3.3%
November 2018 $235,079 $216,946 +8.4%
December 2018 $229,188 $222,099 +3.2%
January 2019 $221,090 $214,819 +2.9%
February 2019 $222,260 $219,187 +1.4%
March 2019 $227,925 $219,837 +3.7%
April 2019 $230,145 $222,502 +3.4%
May 2019 $237,521 $229,326 +3.6%
June 2019 $254,703 $227,392 +12.0%
12-Month Avg* $231,952 $222,139 +4.4%
Historical Average Sales Price by Month
Current as of July 10, 2019. All data from the Greater Baton Rouge Association of REALTORS® MLS. Information deemed reliable but not guaranteed. Report © 2019 ShowingTime. | 8
Average sales price for all closed sales, not accounting for seller concessions, in a given month.
Avg. Sales Price
* Avg. Sales Price of all properties from July 2018 through June 2019. This is not
the average of the individual figures above.
$231,247 $227,392
$254,703
2017 2018 2019
June
$0
$50,000
$100,000
$150,000
$200,000
$250,000
$300,000
1-2003 1-2004 1-2005 1-2006 1-2007 1-2008 1-2009 1-2010 1-2011 1-2012 1-2013 1-2014 1-2015 1-2016 1-2017 1-2018 1-2019
$211,661
$222,976
$233,922
2017 2018 2019
Year to Date
+ 4.9%- 1.7% + 12.0% + 5.3%+ 3.7% - 3.6%
Percent of List Price Received
Prior Year Percent Change
July 2018 97.5% 98.0% -0.5%
August 2018 97.8% 97.5% +0.3%
September 2018 97.6% 97.3% +0.3%
October 2018 97.4% 97.3% +0.1%
November 2018 97.6% 97.6% 0.0%
December 2018 97.6% 97.7% -0.1%
January 2019 97.1% 97.5% -0.4%
February 2019 97.5% 97.5% 0.0%
March 2019 97.8% 97.7% +0.1%
April 2019 97.7% 97.7% 0.0%
May 2019 98.1% 97.9% +0.2%
June 2019 98.0% 97.8% +0.2%
12-Month Avg* 97.7% 97.6% +0.1%
Historical Percent of List Price Received by Month
Current as of July 10, 2019. All data from the Greater Baton Rouge Association of REALTORS® MLS. Information deemed reliable but not guaranteed. Report © 2019 ShowingTime. | 9
Percentage found when dividing a property’s sales price by its most recent list price, then taking the average for all properties sold in a
given month, not accounting for seller concessions.
Pct. of List Price Received
* Average Pct. of List Price Received for all properties from July 2018 through June
2019. This is not the average of the individual figures above.
97.7% 97.8% 98.0%
2017 2018 2019
June
95.0%
96.0%
97.0%
98.0%
99.0%
100.0%
101.0%
1-2003 1-2004 1-2005 1-2006 1-2007 1-2008 1-2009 1-2010 1-2011 1-2012 1-2013 1-2014 1-2015 1-2016 1-2017 1-2018 1-2019
97.1% 97.7% 97.7%
2017 2018 2019
Year to Date
0.0%+ 0.1% + 0.2% + 0.6%- 0.4% - 0.7%
Housing Affordability Index
Prior Year Percent Change
July 2018 130 141 -7.8%
August 2018 131 148 -11.5%
September 2018 121 142 -14.8%
October 2018 121 139 -12.9%
November 2018 120 147 -18.4%
December 2018 129 135 -4.4%
January 2019 129 141 -8.5%
February 2019 137 137 0.0%
March 2019 135 137 -1.5%
April 2019 136 131 +3.8%
May 2019 129 130 -0.8%
June 2019 123 131 -6.1%
12-Month Avg 128 128 0.0%
Historical Housing Affordability Index by Month
Current as of July 10, 2019. All data from the Greater Baton Rouge Association of REALTORS® MLS. Information deemed reliable but not guaranteed. Report © 2019 ShowingTime. | 10
This index measures housing affordability for the region. For example, an index of 120 means the median household income is 120% of
what is necessary to qualify for the median-priced home under prevailing interest rates. A higher number means greater affordability.
Affordability Index
139
131
123
2017 2018 2019
June
0
50
100
150
200
1-2003 1-2004 1-2005 1-2006 1-2007 1-2008 1-2009 1-2010 1-2011 1-2012 1-2013 1-2014 1-2015 1-2016 1-2017 1-2018 1-2019
150
133 132
2017 2018 2019
Year to Date
- 0.8%- 5.8% - 6.1% - 11.3%- 5.4% - 1.3%
Inventory of Homes for Sale
Prior Year Percent Change
July 2018 4,361 3,614 +20.7%
August 2018 4,448 3,697 +20.3%
September 2018 4,384 3,803 +15.3%
October 2018 4,491 3,760 +19.4%
November 2018 4,450 3,717 +19.7%
December 2018 4,199 3,617 +16.1%
January 2019 4,239 3,628 +16.8%
February 2019 4,270 3,758 +13.6%
March 2019 4,299 3,884 +10.7%
April 2019 4,360 4,009 +8.8%
May 2019 4,402 4,211 +4.5%
June 2019 4,419 4,345 +1.7%
12-Month Avg* 4,360 3,837 +13.6%
Historical Inventory of Homes for Sale by Month
Current as of July 10, 2019. All data from the Greater Baton Rouge Association of REALTORS® MLS. Information deemed reliable but not guaranteed. Report © 2019 ShowingTime. | 11
The number of properties available for sale in active status at the end of a given month.
Homes for Sale
3,454
4,345 4,419
2017 2018 2019
June
0
1,000
2,000
3,000
4,000
5,000
6,000
1-2003 1-2004 1-2005 1-2006 1-2007 1-2008 1-2009 1-2010 1-2011 1-2012 1-2013 1-2014 1-2015 1-2016 1-2017 1-2018 1-2019
+ 25.8% + 1.7%- 7.0%
Months Supply of Inventory
Prior Year Percent Change
July 2018 4.8 3.8 +26.3%
August 2018 5.0 3.8 +31.6%
September 2018 4.9 4.0 +22.5%
October 2018 5.1 4.0 +27.5%
November 2018 5.0 4.0 +25.0%
December 2018 4.8 4.0 +20.0%
January 2019 4.8 4.0 +20.0%
February 2019 4.8 4.2 +14.3%
March 2019 4.9 4.3 +14.0%
April 2019 4.9 4.4 +11.4%
May 2019 4.9 4.7 +4.3%
June 2019 4.9 4.8 +2.1%
12-Month Avg* 4.9 4.2 +16.7%
Historical Months Supply of Inventory by Month
Current as of July 10, 2019. All data from the Greater Baton Rouge Association of REALTORS® MLS. Information deemed reliable but not guaranteed. Report © 2019 ShowingTime. | 12
The inventory of homes for sale at the end of a given month, divided by the average monthly pending sales from the last 12 months.
Months Supply
* Months Supply for all properties from July 2018 through June 2019. This is not the
average of the individual figures above.
3.7
4.8 4.9
2017 2018 2019
June
0
2
4
6
8
10
12
1-2003 1-2004 1-2005 1-2006 1-2007 1-2008 1-2009 1-2010 1-2011 1-2012 1-2013 1-2014 1-2015 1-2016 1-2017 1-2018 1-2019
+ 29.7% + 2.1%- 14.0%
Key Metrics 2018 2019 Percent Change Thru 6-2018 Thru 6-2019 Percent Change
New Listings 832 727 - 12.6% 4,563 4,507 - 1.2%
Pending Sales 529 549 + 3.8% 3,102 3,181 + 2.5%
Closed Sales 577 553 - 4.2% 2,868 2,845 - 0.8%
Median Sales Price* $203,000 $229,950 + 13.3% $197,000 $205,000 + 4.1%
Percent of List Price Received* 97.7% 97.6% - 0.1% 97.4% 97.5% + 0.1%
Days on Market Until Sale 55 71 + 29.1% 63 73 + 15.9%
Inventory of Homes for Sale 2,274 2,336 + 2.7% -- -- --
Months Supply of Inventory 4.8 4.9 + 2.1% -- -- --
* Does not account for seller concessions and/or down payment assistance. | Activity for one month can sometimes look extreme due to small sample size.
June
Current as of July 10, 2019. All data from the Greater Baton Rouge Association of REALTORS® MLS. Report © 2019 ShowingTime. Percent changes are calculated using rounded figures.
All MLS —
East Baton Rouge Parish —
Local Market Update for June 2019
A Research Tool Provided by the Greater Baton Rouge Association of REALTORS®
East Baton Rouge Parish
June Year to Date
577 553
Closed Sales
832
727
New Listings
$160,000
$170,000
$180,000
$190,000
$200,000
$210,000
1-2009 1-2010 1-2011 1-2012 1-2013 1-2014 1-2015 1-2016 1-2017 1-2018 1-2019
Historical Median Sales Price Rolling 12-Month Calculation
- 12.6% - 4.2%
97.7% 97.6%
Pct. of List Price Received
- 0.1%
4.8 4.9
Months Supply
2018 2019
+ 2.1%
Key Metrics 2018 2019 Percent Change Thru 6-2018 Thru 6-2019 Percent Change
New Listings 284 245 - 13.7% 1,570 1,330 - 15.3%
Pending Sales 205 193 - 5.9% 1,081 1,078 - 0.3%
Closed Sales 183 163 - 10.9% 980 995 + 1.5%
Median Sales Price* $245,500 $233,060 - 5.1% $226,000 $235,000 + 4.0%
Percent of List Price Received* 98.6% 98.7% + 0.1% 98.6% 98.4% - 0.2%
Days on Market Until Sale 47 76 + 61.7% 55 81 + 47.3%
Inventory of Homes for Sale 726 632 - 12.9% -- -- --
Months Supply of Inventory 4.4 3.9 - 11.4% -- -- --
* Does not account for seller concessions and/or down payment assistance. | Activity for one month can sometimes look extreme due to small sample size.
June
Current as of July 10, 2019. All data from the Greater Baton Rouge Association of REALTORS® MLS. Report © 2019 ShowingTime. Percent changes are calculated using rounded figures.
All MLS —
Ascension Parish —
Local Market Update for June 2019
A Research Tool Provided by the Greater Baton Rouge Association of REALTORS®
Ascension Parish
June Year to Date
183
163
Closed Sales
284
245
New Listings
$160,000
$180,000
$200,000
$220,000
$240,000
1-2009 1-2010 1-2011 1-2012 1-2013 1-2014 1-2015 1-2016 1-2017 1-2018 1-2019
Historical Median Sales Price Rolling 12-Month Calculation
- 13.7% - 10.9%
98.6% 98.7%
Pct. of List Price Received
+ 0.1%
4.4
3.9
Months Supply
2018 2019
- 11.4%
Key Metrics 2018 2019 Percent Change Thru 6-2018 Thru 6-2019 Percent Change
New Listings 292 271 - 7.2% 1,630 1,609 - 1.3%
Pending Sales 210 250 + 19.0% 1,115 1,156 + 3.7%
Closed Sales 207 193 - 6.8% 1,002 1,010 + 0.8%
Median Sales Price* $171,158 $199,900 + 16.8% $170,315 $184,000 + 8.0%
Percent of List Price Received* 97.7% 99.0% + 1.3% 98.4% 98.3% - 0.1%
Days on Market Until Sale 68 84 + 23.5% 72 81 + 12.5%
Inventory of Homes for Sale 794 817 + 2.9% -- -- --
Months Supply of Inventory 4.7 4.8 + 2.1% -- -- --
* Does not account for seller concessions and/or down payment assistance. | Activity for one month can sometimes look extreme due to small sample size.
June
Current as of July 10, 2019. All data from the Greater Baton Rouge Association of REALTORS® MLS. Report © 2019 ShowingTime. Percent changes are calculated using rounded figures.
All MLS —
Livingston Parish —
Local Market Update for June 2019
A Research Tool Provided by the Greater Baton Rouge Association of REALTORS®
Livingston Parish
June Year to Date
207
193
Closed Sales
292
271
New Listings
$140,000
$150,000
$160,000
$170,000
$180,000
$190,000
$200,000
$210,000
1-2009 1-2010 1-2011 1-2012 1-2013 1-2014 1-2015 1-2016 1-2017 1-2018 1-2019
Historical Median Sales Price Rolling 12-Month Calculation
- 7.2% - 6.8%
97.7% 99.0%
Pct. of List Price Received
+ 1.3%
4.7 4.8
Months Supply
2018 2019
+ 2.1%

More Related Content

What's hot

San Francisco Market Focus Report December 2018
San Francisco Market Focus Report December 2018San Francisco Market Focus Report December 2018
San Francisco Market Focus Report December 2018Ronny Budiutama
 
San Francisco market report April 2020
San Francisco market report April 2020San Francisco market report April 2020
San Francisco market report April 2020Ronny Budiutama
 
July 2019 Gallatin Valley Market Reports
July 2019 Gallatin Valley Market ReportsJuly 2019 Gallatin Valley Market Reports
July 2019 Gallatin Valley Market ReportsReferred Realty Group
 
San Francisco Market Focus April 2018
San Francisco Market Focus April 2018San Francisco Market Focus April 2018
San Francisco Market Focus April 2018Ronny Budiutama
 
San Francisco market focus report June 2018
San Francisco market focus report June 2018San Francisco market focus report June 2018
San Francisco market focus report June 2018Ronny Budiutama
 
San Francisco market report June 2020
San Francisco market report June 2020San Francisco market report June 2020
San Francisco market report June 2020Ronny Budiutama
 
San Francisco market report July 2020
San Francisco market report July 2020San Francisco market report July 2020
San Francisco market report July 2020Ronny Budiutama
 
April 2019 Market Reports for the Gallatin Valley
April 2019 Market Reports for the Gallatin ValleyApril 2019 Market Reports for the Gallatin Valley
April 2019 Market Reports for the Gallatin ValleyReferred Realty Group
 
San Francisco Market Focus Report August 2019
San Francisco Market Focus Report August 2019San Francisco Market Focus Report August 2019
San Francisco Market Focus Report August 2019Ronny Budiutama
 
San Francisco market focus report December 2019
San Francisco market focus report December 2019San Francisco market focus report December 2019
San Francisco market focus report December 2019Ronny Budiutama
 
Georgia Housing Market Snapshot For September 2018
Georgia Housing Market Snapshot For September 2018Georgia Housing Market Snapshot For September 2018
Georgia Housing Market Snapshot For September 2018Arthur Prescott
 
Greater Boston Association of Realtors Monthly Market Insights Report July 2019
Greater Boston Association of Realtors Monthly Market Insights Report July 2019Greater Boston Association of Realtors Monthly Market Insights Report July 2019
Greater Boston Association of Realtors Monthly Market Insights Report July 2019Joe Schutt
 
San Francisco Market Focus Report Jan 2020
San Francisco Market Focus Report Jan 2020San Francisco Market Focus Report Jan 2020
San Francisco Market Focus Report Jan 2020Ronny Budiutama
 
San Francisco Market Focus Report September 2018
San Francisco Market Focus Report September 2018San Francisco Market Focus Report September 2018
San Francisco Market Focus Report September 2018Ronny Budiutama
 
San Francisco Market Focus Report Aug 2018
San Francisco Market Focus Report Aug 2018San Francisco Market Focus Report Aug 2018
San Francisco Market Focus Report Aug 2018Ronny Budiutama
 
Greater Baton Rouge Home Sales December 2017 Update provided by GBRAR.
Greater Baton Rouge Home Sales December 2017 Update provided by GBRAR. Greater Baton Rouge Home Sales December 2017 Update provided by GBRAR.
Greater Baton Rouge Home Sales December 2017 Update provided by GBRAR. Bill Cobb, Appraiser
 
January 2018 San Francisco Market Update
January 2018 San Francisco Market UpdateJanuary 2018 San Francisco Market Update
January 2018 San Francisco Market UpdateRonny Budiutama
 
2020 Feb Calgary Market Stats
2020 Feb Calgary Market Stats2020 Feb Calgary Market Stats
2020 Feb Calgary Market StatsJerry Charlton
 
San Francisco Market Focus Report July 2019
San Francisco Market Focus Report July 2019San Francisco Market Focus Report July 2019
San Francisco Market Focus Report July 2019Ronny Budiutama
 

What's hot (20)

San Francisco Market Focus Report December 2018
San Francisco Market Focus Report December 2018San Francisco Market Focus Report December 2018
San Francisco Market Focus Report December 2018
 
San Francisco market report April 2020
San Francisco market report April 2020San Francisco market report April 2020
San Francisco market report April 2020
 
July 2019 Gallatin Valley Market Reports
July 2019 Gallatin Valley Market ReportsJuly 2019 Gallatin Valley Market Reports
July 2019 Gallatin Valley Market Reports
 
San Francisco Market Focus April 2018
San Francisco Market Focus April 2018San Francisco Market Focus April 2018
San Francisco Market Focus April 2018
 
San Francisco market focus report June 2018
San Francisco market focus report June 2018San Francisco market focus report June 2018
San Francisco market focus report June 2018
 
San Francisco market report June 2020
San Francisco market report June 2020San Francisco market report June 2020
San Francisco market report June 2020
 
San Francisco market report July 2020
San Francisco market report July 2020San Francisco market report July 2020
San Francisco market report July 2020
 
April 2019 Market Reports for the Gallatin Valley
April 2019 Market Reports for the Gallatin ValleyApril 2019 Market Reports for the Gallatin Valley
April 2019 Market Reports for the Gallatin Valley
 
San Francisco Market Focus Report August 2019
San Francisco Market Focus Report August 2019San Francisco Market Focus Report August 2019
San Francisco Market Focus Report August 2019
 
San Francisco market focus report December 2019
San Francisco market focus report December 2019San Francisco market focus report December 2019
San Francisco market focus report December 2019
 
Georgia Housing Market Snapshot For September 2018
Georgia Housing Market Snapshot For September 2018Georgia Housing Market Snapshot For September 2018
Georgia Housing Market Snapshot For September 2018
 
March 2019 Market Report
March 2019 Market ReportMarch 2019 Market Report
March 2019 Market Report
 
Greater Boston Association of Realtors Monthly Market Insights Report July 2019
Greater Boston Association of Realtors Monthly Market Insights Report July 2019Greater Boston Association of Realtors Monthly Market Insights Report July 2019
Greater Boston Association of Realtors Monthly Market Insights Report July 2019
 
San Francisco Market Focus Report Jan 2020
San Francisco Market Focus Report Jan 2020San Francisco Market Focus Report Jan 2020
San Francisco Market Focus Report Jan 2020
 
San Francisco Market Focus Report September 2018
San Francisco Market Focus Report September 2018San Francisco Market Focus Report September 2018
San Francisco Market Focus Report September 2018
 
San Francisco Market Focus Report Aug 2018
San Francisco Market Focus Report Aug 2018San Francisco Market Focus Report Aug 2018
San Francisco Market Focus Report Aug 2018
 
Greater Baton Rouge Home Sales December 2017 Update provided by GBRAR.
Greater Baton Rouge Home Sales December 2017 Update provided by GBRAR. Greater Baton Rouge Home Sales December 2017 Update provided by GBRAR.
Greater Baton Rouge Home Sales December 2017 Update provided by GBRAR.
 
January 2018 San Francisco Market Update
January 2018 San Francisco Market UpdateJanuary 2018 San Francisco Market Update
January 2018 San Francisco Market Update
 
2020 Feb Calgary Market Stats
2020 Feb Calgary Market Stats2020 Feb Calgary Market Stats
2020 Feb Calgary Market Stats
 
San Francisco Market Focus Report July 2019
San Francisco Market Focus Report July 2019San Francisco Market Focus Report July 2019
San Francisco Market Focus Report July 2019
 

Similar to Greater Baton Rouge Home Sales June 2019

Massachusetts statewide closed sales for condos and single family homes
Massachusetts statewide closed sales for condos and single family homesMassachusetts statewide closed sales for condos and single family homes
Massachusetts statewide closed sales for condos and single family homesMichael Mahoney
 
San Francisco Market Focus Report April 2019
San Francisco Market Focus Report April 2019San Francisco Market Focus Report April 2019
San Francisco Market Focus Report April 2019Ronny Budiutama
 
San Francisco Market Focus Report Feb 2019
San Francisco Market Focus Report Feb 2019San Francisco Market Focus Report Feb 2019
San Francisco Market Focus Report Feb 2019Ronny Budiutama
 
Georgia Housing Market Snapshot: June 2018. Courtesy of the Georgia Associat...
Georgia Housing Market Snapshot: June 2018.  Courtesy of the Georgia Associat...Georgia Housing Market Snapshot: June 2018.  Courtesy of the Georgia Associat...
Georgia Housing Market Snapshot: June 2018. Courtesy of the Georgia Associat...Arthur Prescott
 
Greater Boston Association of Realtors Monthly Market Insights Report July 2019
Greater Boston Association of Realtors Monthly Market Insights Report July 2019Greater Boston Association of Realtors Monthly Market Insights Report July 2019
Greater Boston Association of Realtors Monthly Market Insights Report July 2019Joe Schutt
 
San Francisco Market Focus Report March 2019
San Francisco Market Focus Report March 2019San Francisco Market Focus Report March 2019
San Francisco Market Focus Report March 2019Ronny Budiutama
 
San Francisco Market Focus Report July
San Francisco Market Focus Report JulySan Francisco Market Focus Report July
San Francisco Market Focus Report JulyRonny Budiutama
 
Charlotte region -monthly indicators - feb 2018
Charlotte region -monthly indicators - feb 2018Charlotte region -monthly indicators - feb 2018
Charlotte region -monthly indicators - feb 2018Scott Browder
 
Charlotte, North Carolina Real Estate Update August
Charlotte, North Carolina Real Estate Update AugustCharlotte, North Carolina Real Estate Update August
Charlotte, North Carolina Real Estate Update AugustScott Browder
 
San Francisco Market Focus Report May
San Francisco Market Focus Report MaySan Francisco Market Focus Report May
San Francisco Market Focus Report MayRonny Budiutama
 
Gbar monthly-market-insight-report-jan20
Gbar monthly-market-insight-report-jan20Gbar monthly-market-insight-report-jan20
Gbar monthly-market-insight-report-jan20BryanPrendeville
 
Gbar monthly-market-insight-report-jan20
Gbar monthly-market-insight-report-jan20Gbar monthly-market-insight-report-jan20
Gbar monthly-market-insight-report-jan20Joe Schutt
 
Bozeman and Surrounding Communities June 2019 Market Report
Bozeman and Surrounding Communities June 2019 Market ReportBozeman and Surrounding Communities June 2019 Market Report
Bozeman and Surrounding Communities June 2019 Market ReportReferred Realty Group
 
May 2019 Gallatin Valley Market Reports
May 2019 Gallatin Valley Market ReportsMay 2019 Gallatin Valley Market Reports
May 2019 Gallatin Valley Market ReportsReferred Realty Group
 
Georgia Housing Market Snapshot For July. Gar mmi 2018-07
Georgia Housing Market Snapshot For July. Gar mmi 2018-07Georgia Housing Market Snapshot For July. Gar mmi 2018-07
Georgia Housing Market Snapshot For July. Gar mmi 2018-07Arthur Prescott
 
San Francisco Market Report for March 2020
San Francisco Market Report for March 2020San Francisco Market Report for March 2020
San Francisco Market Report for March 2020Ronny Budiutama
 
Greater Boston Association of Realtors Monthly Market Insights Report, August...
Greater Boston Association of Realtors Monthly Market Insights Report, August...Greater Boston Association of Realtors Monthly Market Insights Report, August...
Greater Boston Association of Realtors Monthly Market Insights Report, August...Joe Schutt
 
San Francisco Market Focus Report Feb 2020
San Francisco Market Focus Report Feb 2020San Francisco Market Focus Report Feb 2020
San Francisco Market Focus Report Feb 2020Ronny Budiutama
 

Similar to Greater Baton Rouge Home Sales June 2019 (18)

Massachusetts statewide closed sales for condos and single family homes
Massachusetts statewide closed sales for condos and single family homesMassachusetts statewide closed sales for condos and single family homes
Massachusetts statewide closed sales for condos and single family homes
 
San Francisco Market Focus Report April 2019
San Francisco Market Focus Report April 2019San Francisco Market Focus Report April 2019
San Francisco Market Focus Report April 2019
 
San Francisco Market Focus Report Feb 2019
San Francisco Market Focus Report Feb 2019San Francisco Market Focus Report Feb 2019
San Francisco Market Focus Report Feb 2019
 
Georgia Housing Market Snapshot: June 2018. Courtesy of the Georgia Associat...
Georgia Housing Market Snapshot: June 2018.  Courtesy of the Georgia Associat...Georgia Housing Market Snapshot: June 2018.  Courtesy of the Georgia Associat...
Georgia Housing Market Snapshot: June 2018. Courtesy of the Georgia Associat...
 
Greater Boston Association of Realtors Monthly Market Insights Report July 2019
Greater Boston Association of Realtors Monthly Market Insights Report July 2019Greater Boston Association of Realtors Monthly Market Insights Report July 2019
Greater Boston Association of Realtors Monthly Market Insights Report July 2019
 
San Francisco Market Focus Report March 2019
San Francisco Market Focus Report March 2019San Francisco Market Focus Report March 2019
San Francisco Market Focus Report March 2019
 
San Francisco Market Focus Report July
San Francisco Market Focus Report JulySan Francisco Market Focus Report July
San Francisco Market Focus Report July
 
Charlotte region -monthly indicators - feb 2018
Charlotte region -monthly indicators - feb 2018Charlotte region -monthly indicators - feb 2018
Charlotte region -monthly indicators - feb 2018
 
Charlotte, North Carolina Real Estate Update August
Charlotte, North Carolina Real Estate Update AugustCharlotte, North Carolina Real Estate Update August
Charlotte, North Carolina Real Estate Update August
 
San Francisco Market Focus Report May
San Francisco Market Focus Report MaySan Francisco Market Focus Report May
San Francisco Market Focus Report May
 
Gbar monthly-market-insight-report-jan20
Gbar monthly-market-insight-report-jan20Gbar monthly-market-insight-report-jan20
Gbar monthly-market-insight-report-jan20
 
Gbar monthly-market-insight-report-jan20
Gbar monthly-market-insight-report-jan20Gbar monthly-market-insight-report-jan20
Gbar monthly-market-insight-report-jan20
 
Bozeman and Surrounding Communities June 2019 Market Report
Bozeman and Surrounding Communities June 2019 Market ReportBozeman and Surrounding Communities June 2019 Market Report
Bozeman and Surrounding Communities June 2019 Market Report
 
May 2019 Gallatin Valley Market Reports
May 2019 Gallatin Valley Market ReportsMay 2019 Gallatin Valley Market Reports
May 2019 Gallatin Valley Market Reports
 
Georgia Housing Market Snapshot For July. Gar mmi 2018-07
Georgia Housing Market Snapshot For July. Gar mmi 2018-07Georgia Housing Market Snapshot For July. Gar mmi 2018-07
Georgia Housing Market Snapshot For July. Gar mmi 2018-07
 
San Francisco Market Report for March 2020
San Francisco Market Report for March 2020San Francisco Market Report for March 2020
San Francisco Market Report for March 2020
 
Greater Boston Association of Realtors Monthly Market Insights Report, August...
Greater Boston Association of Realtors Monthly Market Insights Report, August...Greater Boston Association of Realtors Monthly Market Insights Report, August...
Greater Boston Association of Realtors Monthly Market Insights Report, August...
 
San Francisco Market Focus Report Feb 2020
San Francisco Market Focus Report Feb 2020San Francisco Market Focus Report Feb 2020
San Francisco Market Focus Report Feb 2020
 

More from Bill Cobb, Appraiser

Greater Baton Rouge Home Price Changes By Zip Codes 2021-2023.pdf
Greater Baton Rouge Home Price Changes By Zip Codes 2021-2023.pdfGreater Baton Rouge Home Price Changes By Zip Codes 2021-2023.pdf
Greater Baton Rouge Home Price Changes By Zip Codes 2021-2023.pdfBill Cobb, Appraiser
 
Livingston Parish December 2023 Housing Market Update PDF.pdf
Livingston Parish December 2023 Housing Market Update PDF.pdfLivingston Parish December 2023 Housing Market Update PDF.pdf
Livingston Parish December 2023 Housing Market Update PDF.pdfBill Cobb, Appraiser
 
Greater Baton Rouge December 2023 Housing Market Update PDF.pdf
Greater Baton Rouge December 2023 Housing Market Update PDF.pdfGreater Baton Rouge December 2023 Housing Market Update PDF.pdf
Greater Baton Rouge December 2023 Housing Market Update PDF.pdfBill Cobb, Appraiser
 
East Baton Rouge Parish December 2023 Housing Market Update.pdf
East Baton Rouge Parish December 2023 Housing Market Update.pdfEast Baton Rouge Parish December 2023 Housing Market Update.pdf
East Baton Rouge Parish December 2023 Housing Market Update.pdfBill Cobb, Appraiser
 
Ascension Parish December 2023 Housing Market Update.pdf
Ascension Parish December 2023 Housing Market Update.pdfAscension Parish December 2023 Housing Market Update.pdf
Ascension Parish December 2023 Housing Market Update.pdfBill Cobb, Appraiser
 
Greater Baton Rouge December 2023 Housing Market Update
Greater Baton Rouge December 2023 Housing Market UpdateGreater Baton Rouge December 2023 Housing Market Update
Greater Baton Rouge December 2023 Housing Market UpdateBill Cobb, Appraiser
 
Greater Baton Rouge Home Sales July 2019
Greater Baton Rouge Home Sales July 2019 Greater Baton Rouge Home Sales July 2019
Greater Baton Rouge Home Sales July 2019 Bill Cobb, Appraiser
 
Top 10 Greater Baton Rouge Home Sales By Zip Code 3 2018 to 3 2019
Top 10 Greater Baton Rouge Home Sales By Zip Code 3 2018 to 3 2019Top 10 Greater Baton Rouge Home Sales By Zip Code 3 2018 to 3 2019
Top 10 Greater Baton Rouge Home Sales By Zip Code 3 2018 to 3 2019Bill Cobb, Appraiser
 
Northside Village Subdivision Denham Springs Home Sales 2015-2019
Northside Village Subdivision Denham Springs Home Sales 2015-2019Northside Village Subdivision Denham Springs Home Sales 2015-2019
Northside Village Subdivision Denham Springs Home Sales 2015-2019Bill Cobb, Appraiser
 
Southdowns Baton Rouge Home Sales Prices 2009-2018
Southdowns Baton Rouge Home Sales Prices 2009-2018Southdowns Baton Rouge Home Sales Prices 2009-2018
Southdowns Baton Rouge Home Sales Prices 2009-2018Bill Cobb, Appraiser
 
West River Oaks Baton Rouge Home Sales 2012 to 2018
West River Oaks Baton Rouge Home Sales 2012 to 2018West River Oaks Baton Rouge Home Sales 2012 to 2018
West River Oaks Baton Rouge Home Sales 2012 to 2018Bill Cobb, Appraiser
 
Grand View Subdivision Home Gonzales Louisiana Home Sales 70737
Grand View Subdivision Home Gonzales Louisiana Home Sales 70737Grand View Subdivision Home Gonzales Louisiana Home Sales 70737
Grand View Subdivision Home Gonzales Louisiana Home Sales 70737Bill Cobb, Appraiser
 
Hermitage Subdivision Baton Rouge Home Sales Prices Gardere Lane 70810
Hermitage Subdivision Baton Rouge Home Sales Prices Gardere Lane 70810Hermitage Subdivision Baton Rouge Home Sales Prices Gardere Lane 70810
Hermitage Subdivision Baton Rouge Home Sales Prices Gardere Lane 70810Bill Cobb, Appraiser
 
Shenandoah estates baton rouge home sales prices 2014 to 2019
Shenandoah estates baton rouge home sales prices 2014 to 2019Shenandoah estates baton rouge home sales prices 2014 to 2019
Shenandoah estates baton rouge home sales prices 2014 to 2019Bill Cobb, Appraiser
 
The Lakes At Stonegate Baton Rouge Home Sales Prices
The Lakes At Stonegate Baton Rouge Home Sales PricesThe Lakes At Stonegate Baton Rouge Home Sales Prices
The Lakes At Stonegate Baton Rouge Home Sales PricesBill Cobb, Appraiser
 
Azalea Lakes Subdivision Baton Rouge Home Sales 2012 to 2019
Azalea Lakes Subdivision Baton Rouge Home Sales 2012 to 2019Azalea Lakes Subdivision Baton Rouge Home Sales 2012 to 2019
Azalea Lakes Subdivision Baton Rouge Home Sales 2012 to 2019Bill Cobb, Appraiser
 
The Northwoods Subdivision Home Sales Baton Rouge Central Community 70739
The Northwoods Subdivision Home Sales Baton Rouge Central Community 70739The Northwoods Subdivision Home Sales Baton Rouge Central Community 70739
The Northwoods Subdivision Home Sales Baton Rouge Central Community 70739Bill Cobb, Appraiser
 
The Preserve At Harveston Home Sales Price Baton Rouge
The Preserve At Harveston Home Sales Price Baton RougeThe Preserve At Harveston Home Sales Price Baton Rouge
The Preserve At Harveston Home Sales Price Baton RougeBill Cobb, Appraiser
 
The Lakes At Stonegate Baton Rouge Home Sales Prices
The Lakes At Stonegate Baton Rouge Home Sales PricesThe Lakes At Stonegate Baton Rouge Home Sales Prices
The Lakes At Stonegate Baton Rouge Home Sales PricesBill Cobb, Appraiser
 
River Oaks Subdivision Baton Rouge 7 Years of Home Sales
River Oaks Subdivision Baton Rouge 7 Years of Home Sales River Oaks Subdivision Baton Rouge 7 Years of Home Sales
River Oaks Subdivision Baton Rouge 7 Years of Home Sales Bill Cobb, Appraiser
 

More from Bill Cobb, Appraiser (20)

Greater Baton Rouge Home Price Changes By Zip Codes 2021-2023.pdf
Greater Baton Rouge Home Price Changes By Zip Codes 2021-2023.pdfGreater Baton Rouge Home Price Changes By Zip Codes 2021-2023.pdf
Greater Baton Rouge Home Price Changes By Zip Codes 2021-2023.pdf
 
Livingston Parish December 2023 Housing Market Update PDF.pdf
Livingston Parish December 2023 Housing Market Update PDF.pdfLivingston Parish December 2023 Housing Market Update PDF.pdf
Livingston Parish December 2023 Housing Market Update PDF.pdf
 
Greater Baton Rouge December 2023 Housing Market Update PDF.pdf
Greater Baton Rouge December 2023 Housing Market Update PDF.pdfGreater Baton Rouge December 2023 Housing Market Update PDF.pdf
Greater Baton Rouge December 2023 Housing Market Update PDF.pdf
 
East Baton Rouge Parish December 2023 Housing Market Update.pdf
East Baton Rouge Parish December 2023 Housing Market Update.pdfEast Baton Rouge Parish December 2023 Housing Market Update.pdf
East Baton Rouge Parish December 2023 Housing Market Update.pdf
 
Ascension Parish December 2023 Housing Market Update.pdf
Ascension Parish December 2023 Housing Market Update.pdfAscension Parish December 2023 Housing Market Update.pdf
Ascension Parish December 2023 Housing Market Update.pdf
 
Greater Baton Rouge December 2023 Housing Market Update
Greater Baton Rouge December 2023 Housing Market UpdateGreater Baton Rouge December 2023 Housing Market Update
Greater Baton Rouge December 2023 Housing Market Update
 
Greater Baton Rouge Home Sales July 2019
Greater Baton Rouge Home Sales July 2019 Greater Baton Rouge Home Sales July 2019
Greater Baton Rouge Home Sales July 2019
 
Top 10 Greater Baton Rouge Home Sales By Zip Code 3 2018 to 3 2019
Top 10 Greater Baton Rouge Home Sales By Zip Code 3 2018 to 3 2019Top 10 Greater Baton Rouge Home Sales By Zip Code 3 2018 to 3 2019
Top 10 Greater Baton Rouge Home Sales By Zip Code 3 2018 to 3 2019
 
Northside Village Subdivision Denham Springs Home Sales 2015-2019
Northside Village Subdivision Denham Springs Home Sales 2015-2019Northside Village Subdivision Denham Springs Home Sales 2015-2019
Northside Village Subdivision Denham Springs Home Sales 2015-2019
 
Southdowns Baton Rouge Home Sales Prices 2009-2018
Southdowns Baton Rouge Home Sales Prices 2009-2018Southdowns Baton Rouge Home Sales Prices 2009-2018
Southdowns Baton Rouge Home Sales Prices 2009-2018
 
West River Oaks Baton Rouge Home Sales 2012 to 2018
West River Oaks Baton Rouge Home Sales 2012 to 2018West River Oaks Baton Rouge Home Sales 2012 to 2018
West River Oaks Baton Rouge Home Sales 2012 to 2018
 
Grand View Subdivision Home Gonzales Louisiana Home Sales 70737
Grand View Subdivision Home Gonzales Louisiana Home Sales 70737Grand View Subdivision Home Gonzales Louisiana Home Sales 70737
Grand View Subdivision Home Gonzales Louisiana Home Sales 70737
 
Hermitage Subdivision Baton Rouge Home Sales Prices Gardere Lane 70810
Hermitage Subdivision Baton Rouge Home Sales Prices Gardere Lane 70810Hermitage Subdivision Baton Rouge Home Sales Prices Gardere Lane 70810
Hermitage Subdivision Baton Rouge Home Sales Prices Gardere Lane 70810
 
Shenandoah estates baton rouge home sales prices 2014 to 2019
Shenandoah estates baton rouge home sales prices 2014 to 2019Shenandoah estates baton rouge home sales prices 2014 to 2019
Shenandoah estates baton rouge home sales prices 2014 to 2019
 
The Lakes At Stonegate Baton Rouge Home Sales Prices
The Lakes At Stonegate Baton Rouge Home Sales PricesThe Lakes At Stonegate Baton Rouge Home Sales Prices
The Lakes At Stonegate Baton Rouge Home Sales Prices
 
Azalea Lakes Subdivision Baton Rouge Home Sales 2012 to 2019
Azalea Lakes Subdivision Baton Rouge Home Sales 2012 to 2019Azalea Lakes Subdivision Baton Rouge Home Sales 2012 to 2019
Azalea Lakes Subdivision Baton Rouge Home Sales 2012 to 2019
 
The Northwoods Subdivision Home Sales Baton Rouge Central Community 70739
The Northwoods Subdivision Home Sales Baton Rouge Central Community 70739The Northwoods Subdivision Home Sales Baton Rouge Central Community 70739
The Northwoods Subdivision Home Sales Baton Rouge Central Community 70739
 
The Preserve At Harveston Home Sales Price Baton Rouge
The Preserve At Harveston Home Sales Price Baton RougeThe Preserve At Harveston Home Sales Price Baton Rouge
The Preserve At Harveston Home Sales Price Baton Rouge
 
The Lakes At Stonegate Baton Rouge Home Sales Prices
The Lakes At Stonegate Baton Rouge Home Sales PricesThe Lakes At Stonegate Baton Rouge Home Sales Prices
The Lakes At Stonegate Baton Rouge Home Sales Prices
 
River Oaks Subdivision Baton Rouge 7 Years of Home Sales
River Oaks Subdivision Baton Rouge 7 Years of Home Sales River Oaks Subdivision Baton Rouge 7 Years of Home Sales
River Oaks Subdivision Baton Rouge 7 Years of Home Sales
 

Recently uploaded

Call Girls In Mayur Vihar-1 Delhi ❤️8860477959 Good Looking Escorts In 24/7 D...
Call Girls In Mayur Vihar-1 Delhi ❤️8860477959 Good Looking Escorts In 24/7 D...Call Girls In Mayur Vihar-1 Delhi ❤️8860477959 Good Looking Escorts In 24/7 D...
Call Girls In Mayur Vihar-1 Delhi ❤️8860477959 Good Looking Escorts In 24/7 D...lizamodels9
 
Sobha Aranya Sector 80 Gurgaon E- Brochure.pdf
Sobha Aranya Sector 80 Gurgaon E- Brochure.pdfSobha Aranya Sector 80 Gurgaon E- Brochure.pdf
Sobha Aranya Sector 80 Gurgaon E- Brochure.pdffaheemali990101
 
Rustomjee The Panorama At Pali Hill, Bandra West, Mumbai - Brochure.pdf
Rustomjee The Panorama At Pali Hill, Bandra West, Mumbai - Brochure.pdfRustomjee The Panorama At Pali Hill, Bandra West, Mumbai - Brochure.pdf
Rustomjee The Panorama At Pali Hill, Bandra West, Mumbai - Brochure.pdfmonikasharma630
 
Call Girls In Sahibabad Ghaziabad ❤️8860477959 Low Rate Escorts Service In 24...
Call Girls In Sahibabad Ghaziabad ❤️8860477959 Low Rate Escorts Service In 24...Call Girls In Sahibabad Ghaziabad ❤️8860477959 Low Rate Escorts Service In 24...
Call Girls In Sahibabad Ghaziabad ❤️8860477959 Low Rate Escorts Service In 24...lizamodels9
 
How to Build Multifamily and Laneway Suites in Toronto!! (feat. Expert Archi...
How to Build Multifamily and Laneway Suites  in Toronto!! (feat. Expert Archi...How to Build Multifamily and Laneway Suites  in Toronto!! (feat. Expert Archi...
How to Build Multifamily and Laneway Suites in Toronto!! (feat. Expert Archi...Volition Properties
 
Call Girls in Nehru Place Delhi 💯Call Us 🔝8264348440🔝
Call Girls in Nehru Place Delhi 💯Call Us 🔝8264348440🔝Call Girls in Nehru Place Delhi 💯Call Us 🔝8264348440🔝
Call Girls in Nehru Place Delhi 💯Call Us 🔝8264348440🔝soniya singh
 
Low Rate Call Girls in Triveni Complex Delhi Call 9990771857
Low Rate Call Girls in Triveni Complex Delhi Call 9990771857Low Rate Call Girls in Triveni Complex Delhi Call 9990771857
Low Rate Call Girls in Triveni Complex Delhi Call 9990771857delhimodel235
 
Cashpay_Call Girls In Gaur City Mall Noida ❤️8860477959 Escorts Service In 24...
Cashpay_Call Girls In Gaur City Mall Noida ❤️8860477959 Escorts Service In 24...Cashpay_Call Girls In Gaur City Mall Noida ❤️8860477959 Escorts Service In 24...
Cashpay_Call Girls In Gaur City Mall Noida ❤️8860477959 Escorts Service In 24...lizamodels9
 
83770-87607 ۞Call Girls In Near The Park Hotel (Cp) Delhi
83770-87607 ۞Call Girls In Near The Park Hotel (Cp) Delhi83770-87607 ۞Call Girls In Near The Park Hotel (Cp) Delhi
83770-87607 ۞Call Girls In Near The Park Hotel (Cp) Delhidollysharma2066
 
9990771857 Call Girls in Noida Sector 06 Noida (Call Girls) Delhi
9990771857 Call Girls in Noida Sector 06 Noida (Call Girls) Delhi9990771857 Call Girls in Noida Sector 06 Noida (Call Girls) Delhi
9990771857 Call Girls in Noida Sector 06 Noida (Call Girls) Delhidelhimodel235
 
The Omaxe State Dwarka Delhi-broucher.pdf.pdf
The Omaxe State Dwarka Delhi-broucher.pdf.pdfThe Omaxe State Dwarka Delhi-broucher.pdf.pdf
The Omaxe State Dwarka Delhi-broucher.pdf.pdfkratirudram
 
Prestige Sector 94 at Noida E Brochure.pdf
Prestige Sector 94 at Noida E Brochure.pdfPrestige Sector 94 at Noida E Brochure.pdf
Prestige Sector 94 at Noida E Brochure.pdfsarak0han45400
 
Call Girls in Khan Market 9654467111 ESCORTS SERVICE
Call Girls in Khan Market 9654467111 ESCORTS SERVICECall Girls in Khan Market 9654467111 ESCORTS SERVICE
Call Girls in Khan Market 9654467111 ESCORTS SERVICESapana Sha
 
Call Girls in Sarai Kale Khan Delhi 💯Call Us 🔝8264348440🔝
Call Girls in Sarai Kale Khan Delhi 💯Call Us 🔝8264348440🔝Call Girls in Sarai Kale Khan Delhi 💯Call Us 🔝8264348440🔝
Call Girls in Sarai Kale Khan Delhi 💯Call Us 🔝8264348440🔝soniya singh
 
Nanke Area Estate commercial ( Dir. Kat Kuo)
Nanke Area Estate commercial ( Dir. Kat Kuo)Nanke Area Estate commercial ( Dir. Kat Kuo)
Nanke Area Estate commercial ( Dir. Kat Kuo)jessica288382
 
Namrata 7 Plumeria Drive Pimpri Chinchwad Pune Brochure.pdf
Namrata 7 Plumeria Drive Pimpri Chinchwad Pune Brochure.pdfNamrata 7 Plumeria Drive Pimpri Chinchwad Pune Brochure.pdf
Namrata 7 Plumeria Drive Pimpri Chinchwad Pune Brochure.pdfPrachiRudram
 
9990771857 Call Girls in Noida Sector 11 Noida (Call Girls) Delhi
9990771857 Call Girls in Noida Sector 11 Noida (Call Girls) Delhi9990771857 Call Girls in Noida Sector 11 Noida (Call Girls) Delhi
9990771857 Call Girls in Noida Sector 11 Noida (Call Girls) Delhidelhimodel235
 
Call Girls in Inderpuri Delhi 💯Call Us 🔝8264348440🔝
Call Girls in Inderpuri Delhi 💯Call Us 🔝8264348440🔝Call Girls in Inderpuri Delhi 💯Call Us 🔝8264348440🔝
Call Girls in Inderpuri Delhi 💯Call Us 🔝8264348440🔝soniya singh
 
Call Girls In Vasundhara Ghaziabad ❤️8860477959 Low Rate Escorts Service In 2...
Call Girls In Vasundhara Ghaziabad ❤️8860477959 Low Rate Escorts Service In 2...Call Girls In Vasundhara Ghaziabad ❤️8860477959 Low Rate Escorts Service In 2...
Call Girls In Vasundhara Ghaziabad ❤️8860477959 Low Rate Escorts Service In 2...lizamodels9
 
Low Rate Call Girls in Lajpat Nagar Delhi Call 9990771857
Low Rate Call Girls in Lajpat Nagar Delhi Call 9990771857Low Rate Call Girls in Lajpat Nagar Delhi Call 9990771857
Low Rate Call Girls in Lajpat Nagar Delhi Call 9990771857delhimodel235
 

Recently uploaded (20)

Call Girls In Mayur Vihar-1 Delhi ❤️8860477959 Good Looking Escorts In 24/7 D...
Call Girls In Mayur Vihar-1 Delhi ❤️8860477959 Good Looking Escorts In 24/7 D...Call Girls In Mayur Vihar-1 Delhi ❤️8860477959 Good Looking Escorts In 24/7 D...
Call Girls In Mayur Vihar-1 Delhi ❤️8860477959 Good Looking Escorts In 24/7 D...
 
Sobha Aranya Sector 80 Gurgaon E- Brochure.pdf
Sobha Aranya Sector 80 Gurgaon E- Brochure.pdfSobha Aranya Sector 80 Gurgaon E- Brochure.pdf
Sobha Aranya Sector 80 Gurgaon E- Brochure.pdf
 
Rustomjee The Panorama At Pali Hill, Bandra West, Mumbai - Brochure.pdf
Rustomjee The Panorama At Pali Hill, Bandra West, Mumbai - Brochure.pdfRustomjee The Panorama At Pali Hill, Bandra West, Mumbai - Brochure.pdf
Rustomjee The Panorama At Pali Hill, Bandra West, Mumbai - Brochure.pdf
 
Call Girls In Sahibabad Ghaziabad ❤️8860477959 Low Rate Escorts Service In 24...
Call Girls In Sahibabad Ghaziabad ❤️8860477959 Low Rate Escorts Service In 24...Call Girls In Sahibabad Ghaziabad ❤️8860477959 Low Rate Escorts Service In 24...
Call Girls In Sahibabad Ghaziabad ❤️8860477959 Low Rate Escorts Service In 24...
 
How to Build Multifamily and Laneway Suites in Toronto!! (feat. Expert Archi...
How to Build Multifamily and Laneway Suites  in Toronto!! (feat. Expert Archi...How to Build Multifamily and Laneway Suites  in Toronto!! (feat. Expert Archi...
How to Build Multifamily and Laneway Suites in Toronto!! (feat. Expert Archi...
 
Call Girls in Nehru Place Delhi 💯Call Us 🔝8264348440🔝
Call Girls in Nehru Place Delhi 💯Call Us 🔝8264348440🔝Call Girls in Nehru Place Delhi 💯Call Us 🔝8264348440🔝
Call Girls in Nehru Place Delhi 💯Call Us 🔝8264348440🔝
 
Low Rate Call Girls in Triveni Complex Delhi Call 9990771857
Low Rate Call Girls in Triveni Complex Delhi Call 9990771857Low Rate Call Girls in Triveni Complex Delhi Call 9990771857
Low Rate Call Girls in Triveni Complex Delhi Call 9990771857
 
Cashpay_Call Girls In Gaur City Mall Noida ❤️8860477959 Escorts Service In 24...
Cashpay_Call Girls In Gaur City Mall Noida ❤️8860477959 Escorts Service In 24...Cashpay_Call Girls In Gaur City Mall Noida ❤️8860477959 Escorts Service In 24...
Cashpay_Call Girls In Gaur City Mall Noida ❤️8860477959 Escorts Service In 24...
 
83770-87607 ۞Call Girls In Near The Park Hotel (Cp) Delhi
83770-87607 ۞Call Girls In Near The Park Hotel (Cp) Delhi83770-87607 ۞Call Girls In Near The Park Hotel (Cp) Delhi
83770-87607 ۞Call Girls In Near The Park Hotel (Cp) Delhi
 
9990771857 Call Girls in Noida Sector 06 Noida (Call Girls) Delhi
9990771857 Call Girls in Noida Sector 06 Noida (Call Girls) Delhi9990771857 Call Girls in Noida Sector 06 Noida (Call Girls) Delhi
9990771857 Call Girls in Noida Sector 06 Noida (Call Girls) Delhi
 
The Omaxe State Dwarka Delhi-broucher.pdf.pdf
The Omaxe State Dwarka Delhi-broucher.pdf.pdfThe Omaxe State Dwarka Delhi-broucher.pdf.pdf
The Omaxe State Dwarka Delhi-broucher.pdf.pdf
 
Prestige Sector 94 at Noida E Brochure.pdf
Prestige Sector 94 at Noida E Brochure.pdfPrestige Sector 94 at Noida E Brochure.pdf
Prestige Sector 94 at Noida E Brochure.pdf
 
Call Girls in Khan Market 9654467111 ESCORTS SERVICE
Call Girls in Khan Market 9654467111 ESCORTS SERVICECall Girls in Khan Market 9654467111 ESCORTS SERVICE
Call Girls in Khan Market 9654467111 ESCORTS SERVICE
 
Call Girls in Sarai Kale Khan Delhi 💯Call Us 🔝8264348440🔝
Call Girls in Sarai Kale Khan Delhi 💯Call Us 🔝8264348440🔝Call Girls in Sarai Kale Khan Delhi 💯Call Us 🔝8264348440🔝
Call Girls in Sarai Kale Khan Delhi 💯Call Us 🔝8264348440🔝
 
Nanke Area Estate commercial ( Dir. Kat Kuo)
Nanke Area Estate commercial ( Dir. Kat Kuo)Nanke Area Estate commercial ( Dir. Kat Kuo)
Nanke Area Estate commercial ( Dir. Kat Kuo)
 
Namrata 7 Plumeria Drive Pimpri Chinchwad Pune Brochure.pdf
Namrata 7 Plumeria Drive Pimpri Chinchwad Pune Brochure.pdfNamrata 7 Plumeria Drive Pimpri Chinchwad Pune Brochure.pdf
Namrata 7 Plumeria Drive Pimpri Chinchwad Pune Brochure.pdf
 
9990771857 Call Girls in Noida Sector 11 Noida (Call Girls) Delhi
9990771857 Call Girls in Noida Sector 11 Noida (Call Girls) Delhi9990771857 Call Girls in Noida Sector 11 Noida (Call Girls) Delhi
9990771857 Call Girls in Noida Sector 11 Noida (Call Girls) Delhi
 
Call Girls in Inderpuri Delhi 💯Call Us 🔝8264348440🔝
Call Girls in Inderpuri Delhi 💯Call Us 🔝8264348440🔝Call Girls in Inderpuri Delhi 💯Call Us 🔝8264348440🔝
Call Girls in Inderpuri Delhi 💯Call Us 🔝8264348440🔝
 
Call Girls In Vasundhara Ghaziabad ❤️8860477959 Low Rate Escorts Service In 2...
Call Girls In Vasundhara Ghaziabad ❤️8860477959 Low Rate Escorts Service In 2...Call Girls In Vasundhara Ghaziabad ❤️8860477959 Low Rate Escorts Service In 2...
Call Girls In Vasundhara Ghaziabad ❤️8860477959 Low Rate Escorts Service In 2...
 
Low Rate Call Girls in Lajpat Nagar Delhi Call 9990771857
Low Rate Call Girls in Lajpat Nagar Delhi Call 9990771857Low Rate Call Girls in Lajpat Nagar Delhi Call 9990771857
Low Rate Call Girls in Lajpat Nagar Delhi Call 9990771857
 

Greater Baton Rouge Home Sales June 2019

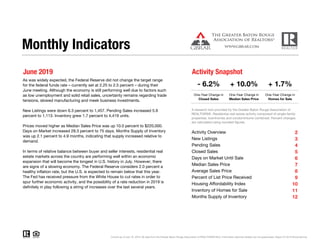
  • 1. June 2019 Activity Snapshot One-Year Change in One-Year Change in Closed Sales Median Sales Price 2 3 4 5 6 7 8 9 10 11 12 Monthly Indicators - 6.2% + 10.0% + 1.7% One-Year Change in Current as of July 10, 2019. All data from the Greater Baton Rouge Association of REALTORS® MLS. Information deemed reliable but not guaranteed. Report © 2019 ShowingTime. Pending Sales Closed Sales Days on Market Until Sale Median Sales Price Average Sales Price Percent of List Price Received As was widely expected, the Federal Reserve did not change the target range for the federal funds rate – currently set at 2.25 to 2.5 percent – during their June meeting. Although the economy is still performing well due to factors such as low unemployment and solid retail sales, uncertainty remains regarding trade tensions, slowed manufacturing and meek business investments. New Listings were down 6.3 percent to 1,457. Pending Sales increased 5.9 percent to 1,113. Inventory grew 1.7 percent to 4,419 units. Prices moved higher as Median Sales Price was up 10.0 percent to $220,000. Days on Market increased 29.3 percent to 75 days. Months Supply of Inventory was up 2.1 percent to 4.9 months, indicating that supply increased relative to demand. In terms of relative balance between buyer and seller interests, residential real estate markets across the country are performing well within an economic expansion that will become the longest in U.S. history in July. However, there are signs of a slowing economy. The Federal Reserve considers 2.0 percent a healthy inflation rate, but the U.S. is expected to remain below that this year. The Fed has received pressure from the White House to cut rates in order to spur further economic activity, and the possibility of a rate reduction in 2019 is definitely in play following a string of increases over the last several years. Homes for Sale A research tool provided by the Greater Baton Rouge Association of REALTORS®. Residential real estate activity composed of single-family properties, townhomes and condominiums combined. Percent changes are calculated using rounded figures. Activity Overview New Listings Housing Affordability Index Inventory of Homes for Sale Months Supply of Inventory
  • 2. Activity Overview Key Metrics Historical Sparkbars 6-2018 6-2019 Percent Change YTD 2018 YTD 2019 Percent Change Key metrics by report month and for year-to-date (YTD) starting from the first of the year. New Listings 1,555 1,457 - 6.3% 8,398 - 2.3% Pending Sales 1,051 1,113 + 5.9% 5,870 6,011 + 2.4% 8,595 + 0.1% Days on Market 58 75 + 29.3% 66 78 + 18.2% Closed Sales 1,069 1,003 - 6.2% 5,369 5,372 + 4.1% Avg. Sales Price $227,392 $254,703 + 12.0% $222,976 $233,922 + 4.9% Median Sales Price $200,000 $220,000 + 10.0% $197,000 $205,000 Homes for Sale 4,345 4,419 + 1.7% -- -- Months Supply 4.8 4.9 + 2.1% -- Current as of July 10, 2019. All data from the Greater Baton Rouge Association of REALTORS® MLS. Information deemed reliable but not guaranteed. Report © 2019 ShowingTime. | 2 0.0% Affordability Index 131 123 - 6.1% 133 132 - 0.8% Pct. of List Price Received 97.8% 98.0% + 0.2% 97.7% 97.7% -- -- -- 6-2016 6-2017 6-2018 6-2019 6-2016 6-2017 6-2018 6-2019 6-2016 6-2017 6-2018 6-2019 6-2016 6-2017 6-2018 6-2019 6-2016 6-2017 6-2018 6-2019 6-2016 6-2017 6-2018 6-2019 6-2016 6-2017 6-2018 6-2019 6-2016 6-2017 6-2018 6-2019 6-2016 6-2017 6-2018 6-2019 6-2016 6-2017 6-2018 6-2019
  • 3. New Listings Prior Year Percent Change July 2018 1,409 1,468 -4.0% August 2018 1,431 1,404 +1.9% September 2018 1,052 1,247 -15.6% October 2018 1,252 1,141 +9.7% November 2018 1,020 981 +4.0% December 2018 748 766 -2.3% January 2019 1,284 1,136 +13.0% February 2019 1,273 1,330 -4.3% March 2019 1,421 1,495 -4.9% April 2019 1,482 1,471 +0.7% May 2019 1,481 1,608 -7.9% June 2019 1,457 1,555 -6.3% 12-Month Avg 1,276 1,300 -1.8% Historical New Listings by Month Current as of July 10, 2019. All data from the Greater Baton Rouge Association of REALTORS® MLS. Information deemed reliable but not guaranteed. Report © 2019 ShowingTime. | 3 A count of the properties that have been newly listed on the market in a given month. New Listings 1,404 1,555 1,457 2017 2018 2019 June 0 1,000 2,000 3,000 4,000 1-2003 1-2004 1-2005 1-2006 1-2007 1-2008 1-2009 1-2010 1-2011 1-2012 1-2013 1-2014 1-2015 1-2016 1-2017 1-2018 1-2019 7,921 8,595 8,398 2017 2018 2019 Year to Date - 2.3%+ 10.8% - 6.3% + 8.5%+ 9.1% + 5.2%
  • 4. Pending Sales Prior Year Percent Change July 2018 988 985 +0.3% August 2018 928 968 -4.1% September 2018 749 820 -8.7% October 2018 765 860 -11.0% November 2018 703 720 -2.4% December 2018 595 576 +3.3% January 2019 804 761 +5.7% February 2019 885 890 -0.6% March 2019 1,050 1,085 -3.2% April 2019 1,099 1,036 +6.1% May 2019 1,060 1,047 +1.2% June 2019 1,113 1,051 +5.9% 12-Month Avg 895 900 -0.6% Historical Pending Sales by Month Current as of July 10, 2019. All data from the Greater Baton Rouge Association of REALTORS® MLS. Information deemed reliable but not guaranteed. Report © 2019 ShowingTime. | 4 A count of the properties on which offers have been accepted in a given month. Pending Sales 1,028 1,051 1,113 2017 2018 2019 June 0 500 1,000 1,500 2,000 2,500 3,000 1-2003 1-2004 1-2005 1-2006 1-2007 1-2008 1-2009 1-2010 1-2011 1-2012 1-2013 1-2014 1-2015 1-2016 1-2017 1-2018 1-2019 5,983 5,870 6,011 2017 2018 2019 Year to Date + 2.4%+ 2.2% + 5.9% - 1.9%+ 10.7% + 4.9%
  • 5. Closed Sales Prior Year Percent Change July 2018 1,125 1,051 +7.0% August 2018 1,020 1,048 -2.7% September 2018 884 900 -1.8% October 2018 817 875 -6.6% November 2018 758 832 -8.9% December 2018 712 784 -9.2% January 2019 569 625 -9.0% February 2019 754 703 +7.3% March 2019 890 982 -9.4% April 2019 989 954 +3.7% May 2019 1,167 1,036 +12.6% June 2019 1,003 1,069 -6.2% 12-Month Avg 891 905 -1.5% Historical Closed Sales by Month Current as of July 10, 2019. All data from the Greater Baton Rouge Association of REALTORS® MLS. Information deemed reliable but not guaranteed. Report © 2019 ShowingTime. | 5 A count of the actual sales that closed in a given month. Closed Sales 1,151 1,069 1,003 2017 2018 2019 June 0 500 1,000 1,500 2,000 1-2003 1-2004 1-2005 1-2006 1-2007 1-2008 1-2009 1-2010 1-2011 1-2012 1-2013 1-2014 1-2015 1-2016 1-2017 1-2018 1-2019 5,714 5,369 5,372 2017 2018 2019 Year to Date + 0.1%- 7.1% - 6.2% - 6.0%+ 10.1% + 10.6%
  • 6. Days on Market Until Sale Prior Year Percent Change July 2018 62 50 +24.0% August 2018 60 48 +25.0% September 2018 64 56 +14.3% October 2018 66 56 +17.9% November 2018 64 58 +10.3% December 2018 77 67 +14.9% January 2019 78 67 +16.4% February 2019 78 69 +13.0% March 2019 85 75 +13.3% April 2019 78 64 +21.9% May 2019 74 65 +13.8% June 2019 75 58 +29.3% 12-Month Avg* 71 61 +16.4% Historical Days on Market Until Sale by Month Current as of July 10, 2019. All data from the Greater Baton Rouge Association of REALTORS® MLS. Information deemed reliable but not guaranteed. Report © 2019 ShowingTime. | 6 Average number of days between when a property is listed and when an offer is accepted in a given month. Days on Market * Average Days on Market of all properties from July 2018 through June 2019. This is not the average of the individual figures above. 58 58 75 2017 2018 2019 June 0 20 40 60 80 100 120 1-2003 1-2004 1-2005 1-2006 1-2007 1-2008 1-2009 1-2010 1-2011 1-2012 1-2013 1-2014 1-2015 1-2016 1-2017 1-2018 1-2019 58 66 78 2017 2018 2019 Year to Date + 18.2%0.0% + 29.3% + 13.8%- 13.4% - 21.6%
  • 7. Median Sales Price Prior Year Percent Change July 2018 $201,950 $197,000 +2.5% August 2018 $199,900 $190,133 +5.1% September 2018 $208,918 $198,450 +5.3% October 2018 $197,350 $198,000 -0.3% November 2018 $203,900 $190,000 +7.3% December 2018 $204,500 $204,137 +0.2% January 2019 $205,000 $190,000 +7.9% February 2019 $195,000 $195,000 0.0% March 2019 $199,000 $194,000 +2.6% April 2019 $200,000 $199,000 +0.5% May 2019 $210,000 $200,000 +5.0% June 2019 $220,000 $200,000 +10.0% 12-Month Med* $204,650 $196,900 +3.9% Historical Median Sales Price by Month Current as of July 10, 2019. All data from the Greater Baton Rouge Association of REALTORS® MLS. Information deemed reliable but not guaranteed. Report © 2019 ShowingTime. | 7 Point at which half of the sales sold for more and half sold for less, not accounting for seller concessions, in a given month. Median Sales Price * Median Sales Price of all properties from July 2018 through June 2019. This is not the average of the individual figures above. $199,900 $200,000 $220,000 2017 2018 2019 June $0 $50,000 $100,000 $150,000 $200,000 $250,000 1-2003 1-2004 1-2005 1-2006 1-2007 1-2008 1-2009 1-2010 1-2011 1-2012 1-2013 1-2014 1-2015 1-2016 1-2017 1-2018 1-2019 $184,900 $197,000 $205,000 2017 2018 2019 Year to Date + 4.1%+ 0.1% + 10.0% + 6.5%+ 2.4% - 2.0%
  • 8. Average Sales Price Prior Year Percent Change July 2018 $234,807 $223,544 +5.0% August 2018 $231,149 $220,855 +4.7% September 2018 $228,312 $217,091 +5.2% October 2018 $219,499 $227,028 -3.3% November 2018 $235,079 $216,946 +8.4% December 2018 $229,188 $222,099 +3.2% January 2019 $221,090 $214,819 +2.9% February 2019 $222,260 $219,187 +1.4% March 2019 $227,925 $219,837 +3.7% April 2019 $230,145 $222,502 +3.4% May 2019 $237,521 $229,326 +3.6% June 2019 $254,703 $227,392 +12.0% 12-Month Avg* $231,952 $222,139 +4.4% Historical Average Sales Price by Month Current as of July 10, 2019. All data from the Greater Baton Rouge Association of REALTORS® MLS. Information deemed reliable but not guaranteed. Report © 2019 ShowingTime. | 8 Average sales price for all closed sales, not accounting for seller concessions, in a given month. Avg. Sales Price * Avg. Sales Price of all properties from July 2018 through June 2019. This is not the average of the individual figures above. $231,247 $227,392 $254,703 2017 2018 2019 June $0 $50,000 $100,000 $150,000 $200,000 $250,000 $300,000 1-2003 1-2004 1-2005 1-2006 1-2007 1-2008 1-2009 1-2010 1-2011 1-2012 1-2013 1-2014 1-2015 1-2016 1-2017 1-2018 1-2019 $211,661 $222,976 $233,922 2017 2018 2019 Year to Date + 4.9%- 1.7% + 12.0% + 5.3%+ 3.7% - 3.6%
  • 9. Percent of List Price Received Prior Year Percent Change July 2018 97.5% 98.0% -0.5% August 2018 97.8% 97.5% +0.3% September 2018 97.6% 97.3% +0.3% October 2018 97.4% 97.3% +0.1% November 2018 97.6% 97.6% 0.0% December 2018 97.6% 97.7% -0.1% January 2019 97.1% 97.5% -0.4% February 2019 97.5% 97.5% 0.0% March 2019 97.8% 97.7% +0.1% April 2019 97.7% 97.7% 0.0% May 2019 98.1% 97.9% +0.2% June 2019 98.0% 97.8% +0.2% 12-Month Avg* 97.7% 97.6% +0.1% Historical Percent of List Price Received by Month Current as of July 10, 2019. All data from the Greater Baton Rouge Association of REALTORS® MLS. Information deemed reliable but not guaranteed. Report © 2019 ShowingTime. | 9 Percentage found when dividing a property’s sales price by its most recent list price, then taking the average for all properties sold in a given month, not accounting for seller concessions. Pct. of List Price Received * Average Pct. of List Price Received for all properties from July 2018 through June 2019. This is not the average of the individual figures above. 97.7% 97.8% 98.0% 2017 2018 2019 June 95.0% 96.0% 97.0% 98.0% 99.0% 100.0% 101.0% 1-2003 1-2004 1-2005 1-2006 1-2007 1-2008 1-2009 1-2010 1-2011 1-2012 1-2013 1-2014 1-2015 1-2016 1-2017 1-2018 1-2019 97.1% 97.7% 97.7% 2017 2018 2019 Year to Date 0.0%+ 0.1% + 0.2% + 0.6%- 0.4% - 0.7%
  • 10. Housing Affordability Index Prior Year Percent Change July 2018 130 141 -7.8% August 2018 131 148 -11.5% September 2018 121 142 -14.8% October 2018 121 139 -12.9% November 2018 120 147 -18.4% December 2018 129 135 -4.4% January 2019 129 141 -8.5% February 2019 137 137 0.0% March 2019 135 137 -1.5% April 2019 136 131 +3.8% May 2019 129 130 -0.8% June 2019 123 131 -6.1% 12-Month Avg 128 128 0.0% Historical Housing Affordability Index by Month Current as of July 10, 2019. All data from the Greater Baton Rouge Association of REALTORS® MLS. Information deemed reliable but not guaranteed. Report © 2019 ShowingTime. | 10 This index measures housing affordability for the region. For example, an index of 120 means the median household income is 120% of what is necessary to qualify for the median-priced home under prevailing interest rates. A higher number means greater affordability. Affordability Index 139 131 123 2017 2018 2019 June 0 50 100 150 200 1-2003 1-2004 1-2005 1-2006 1-2007 1-2008 1-2009 1-2010 1-2011 1-2012 1-2013 1-2014 1-2015 1-2016 1-2017 1-2018 1-2019 150 133 132 2017 2018 2019 Year to Date - 0.8%- 5.8% - 6.1% - 11.3%- 5.4% - 1.3%
  • 11. Inventory of Homes for Sale Prior Year Percent Change July 2018 4,361 3,614 +20.7% August 2018 4,448 3,697 +20.3% September 2018 4,384 3,803 +15.3% October 2018 4,491 3,760 +19.4% November 2018 4,450 3,717 +19.7% December 2018 4,199 3,617 +16.1% January 2019 4,239 3,628 +16.8% February 2019 4,270 3,758 +13.6% March 2019 4,299 3,884 +10.7% April 2019 4,360 4,009 +8.8% May 2019 4,402 4,211 +4.5% June 2019 4,419 4,345 +1.7% 12-Month Avg* 4,360 3,837 +13.6% Historical Inventory of Homes for Sale by Month Current as of July 10, 2019. All data from the Greater Baton Rouge Association of REALTORS® MLS. Information deemed reliable but not guaranteed. Report © 2019 ShowingTime. | 11 The number of properties available for sale in active status at the end of a given month. Homes for Sale 3,454 4,345 4,419 2017 2018 2019 June 0 1,000 2,000 3,000 4,000 5,000 6,000 1-2003 1-2004 1-2005 1-2006 1-2007 1-2008 1-2009 1-2010 1-2011 1-2012 1-2013 1-2014 1-2015 1-2016 1-2017 1-2018 1-2019 + 25.8% + 1.7%- 7.0%
  • 12. Months Supply of Inventory Prior Year Percent Change July 2018 4.8 3.8 +26.3% August 2018 5.0 3.8 +31.6% September 2018 4.9 4.0 +22.5% October 2018 5.1 4.0 +27.5% November 2018 5.0 4.0 +25.0% December 2018 4.8 4.0 +20.0% January 2019 4.8 4.0 +20.0% February 2019 4.8 4.2 +14.3% March 2019 4.9 4.3 +14.0% April 2019 4.9 4.4 +11.4% May 2019 4.9 4.7 +4.3% June 2019 4.9 4.8 +2.1% 12-Month Avg* 4.9 4.2 +16.7% Historical Months Supply of Inventory by Month Current as of July 10, 2019. All data from the Greater Baton Rouge Association of REALTORS® MLS. Information deemed reliable but not guaranteed. Report © 2019 ShowingTime. | 12 The inventory of homes for sale at the end of a given month, divided by the average monthly pending sales from the last 12 months. Months Supply * Months Supply for all properties from July 2018 through June 2019. This is not the average of the individual figures above. 3.7 4.8 4.9 2017 2018 2019 June 0 2 4 6 8 10 12 1-2003 1-2004 1-2005 1-2006 1-2007 1-2008 1-2009 1-2010 1-2011 1-2012 1-2013 1-2014 1-2015 1-2016 1-2017 1-2018 1-2019 + 29.7% + 2.1%- 14.0%
  • 13. Key Metrics 2018 2019 Percent Change Thru 6-2018 Thru 6-2019 Percent Change New Listings 832 727 - 12.6% 4,563 4,507 - 1.2% Pending Sales 529 549 + 3.8% 3,102 3,181 + 2.5% Closed Sales 577 553 - 4.2% 2,868 2,845 - 0.8% Median Sales Price* $203,000 $229,950 + 13.3% $197,000 $205,000 + 4.1% Percent of List Price Received* 97.7% 97.6% - 0.1% 97.4% 97.5% + 0.1% Days on Market Until Sale 55 71 + 29.1% 63 73 + 15.9% Inventory of Homes for Sale 2,274 2,336 + 2.7% -- -- -- Months Supply of Inventory 4.8 4.9 + 2.1% -- -- -- * Does not account for seller concessions and/or down payment assistance. | Activity for one month can sometimes look extreme due to small sample size. June Current as of July 10, 2019. All data from the Greater Baton Rouge Association of REALTORS® MLS. Report © 2019 ShowingTime. Percent changes are calculated using rounded figures. All MLS — East Baton Rouge Parish — Local Market Update for June 2019 A Research Tool Provided by the Greater Baton Rouge Association of REALTORS® East Baton Rouge Parish June Year to Date 577 553 Closed Sales 832 727 New Listings $160,000 $170,000 $180,000 $190,000 $200,000 $210,000 1-2009 1-2010 1-2011 1-2012 1-2013 1-2014 1-2015 1-2016 1-2017 1-2018 1-2019 Historical Median Sales Price Rolling 12-Month Calculation - 12.6% - 4.2% 97.7% 97.6% Pct. of List Price Received - 0.1% 4.8 4.9 Months Supply 2018 2019 + 2.1%
  • 14. Key Metrics 2018 2019 Percent Change Thru 6-2018 Thru 6-2019 Percent Change New Listings 284 245 - 13.7% 1,570 1,330 - 15.3% Pending Sales 205 193 - 5.9% 1,081 1,078 - 0.3% Closed Sales 183 163 - 10.9% 980 995 + 1.5% Median Sales Price* $245,500 $233,060 - 5.1% $226,000 $235,000 + 4.0% Percent of List Price Received* 98.6% 98.7% + 0.1% 98.6% 98.4% - 0.2% Days on Market Until Sale 47 76 + 61.7% 55 81 + 47.3% Inventory of Homes for Sale 726 632 - 12.9% -- -- -- Months Supply of Inventory 4.4 3.9 - 11.4% -- -- -- * Does not account for seller concessions and/or down payment assistance. | Activity for one month can sometimes look extreme due to small sample size. June Current as of July 10, 2019. All data from the Greater Baton Rouge Association of REALTORS® MLS. Report © 2019 ShowingTime. Percent changes are calculated using rounded figures. All MLS — Ascension Parish — Local Market Update for June 2019 A Research Tool Provided by the Greater Baton Rouge Association of REALTORS® Ascension Parish June Year to Date 183 163 Closed Sales 284 245 New Listings $160,000 $180,000 $200,000 $220,000 $240,000 1-2009 1-2010 1-2011 1-2012 1-2013 1-2014 1-2015 1-2016 1-2017 1-2018 1-2019 Historical Median Sales Price Rolling 12-Month Calculation - 13.7% - 10.9% 98.6% 98.7% Pct. of List Price Received + 0.1% 4.4 3.9 Months Supply 2018 2019 - 11.4%
  • 15. Key Metrics 2018 2019 Percent Change Thru 6-2018 Thru 6-2019 Percent Change New Listings 292 271 - 7.2% 1,630 1,609 - 1.3% Pending Sales 210 250 + 19.0% 1,115 1,156 + 3.7% Closed Sales 207 193 - 6.8% 1,002 1,010 + 0.8% Median Sales Price* $171,158 $199,900 + 16.8% $170,315 $184,000 + 8.0% Percent of List Price Received* 97.7% 99.0% + 1.3% 98.4% 98.3% - 0.1% Days on Market Until Sale 68 84 + 23.5% 72 81 + 12.5% Inventory of Homes for Sale 794 817 + 2.9% -- -- -- Months Supply of Inventory 4.7 4.8 + 2.1% -- -- -- * Does not account for seller concessions and/or down payment assistance. | Activity for one month can sometimes look extreme due to small sample size. June Current as of July 10, 2019. All data from the Greater Baton Rouge Association of REALTORS® MLS. Report © 2019 ShowingTime. Percent changes are calculated using rounded figures. All MLS — Livingston Parish — Local Market Update for June 2019 A Research Tool Provided by the Greater Baton Rouge Association of REALTORS® Livingston Parish June Year to Date 207 193 Closed Sales 292 271 New Listings $140,000 $150,000 $160,000 $170,000 $180,000 $190,000 $200,000 $210,000 1-2009 1-2010 1-2011 1-2012 1-2013 1-2014 1-2015 1-2016 1-2017 1-2018 1-2019 Historical Median Sales Price Rolling 12-Month Calculation - 7.2% - 6.8% 97.7% 99.0% Pct. of List Price Received + 1.3% 4.7 4.8 Months Supply 2018 2019 + 2.1%