SlideShare a Scribd company logo
1 of 13
Download to read offline
A RESEARCH TOOL PROVIDED BY THE MASSACHUSETTS ASSOCIATION OF REALTORS®
6,153
Single-Family Only
+ 3.3% + 1.3%
Year-Over-Year Change
Median Sales Price
$423,250
Single-Family Only
+ 7.2% + 7.8%
Year-Over-Year Change
Homes for Sale
14,332
Single-Family Only
- 15.2% - 20.3%
Year-Over-Year Change
New Listings
6,874
Single-Family Only
+ 6.7% + 1.5%
Year-Over-Year Change
Data is refreshed regularly to capture changes in market activity so figures shown may be different than previously reported. Current as of August 7, 2018.
Quick Facts
3,721
$398,950
All data from the Berkshire County Multiple Listing Service, Cape Cod & Islands Association of REALTORS®, Inc. and MLS Property Information Network, Inc. Provided by MAR. Report © 2018 ShowingTime.
Monthly Indicators
July 2018
Closed SalesHousing price bubble chatter has increased this summer, as market observers
attempt to predict the next residential real estate shift. It is too early to predict a
change from higher prices and lower inventory, but the common markers that
caused the last housing cooldown are present. Wages are up but not at the same
pace as home prices, leading to the kind of affordability concerns that can cause
fewer sales at lower prices. At the same time, demand is still outpacing what is
available for sale in many markets.
New Listings were up 6.7 percent for single-family homes and 1.5 percent for
condominium properties. Closed Sales increased 3.3 percent for single-family
homes and 1.3 percent for condominium properties.
The Median Sales Price was up 7.2 percent to $423,250 for single-family homes
and 7.8 percent to $398,950 for condominium properties. Months Supply of
Inventory decreased 14.3 percent for single-family units and 20.0 percent for
condominium units.
Consumer spending on home goods and renovations are up, and more people
are entering the workforce. Employed people spending money is good for the
housing market. Meanwhile, GDP growth was 4.1% in the second quarter, the
strongest showing since 2014. Housing starts are down, but that is more
reflective of low supply than anything else. With a growing economy, solid
lending practices and the potential for improved inventory from new listing and
building activity, market balance is more likely than a bubble.
Condominium Only
Year-Over-Year Change
Condominium Only
Year-Over-Year Change
Condominium Only
Year-Over-Year Change
Condominium Only
2,299
2,283
Michael Mahoney
Realtor
eXp Realty Boston
617-615-9435 - www.RealtorMikeMahoney.com
Single-Family Market Overview
Historical Sparkbars 7-2017 7-2018 + / – YTD 2017 YTD 2018 + / –
All data from the Berkshire County Multiple Listing Service, Cape Cod & Islands Association of REALTORS®, Inc. and MLS Property Information Network, Inc. Provided by MAR. Report © 2018 ShowingTime. | 2
+ 0.8%New Listings 6,444 6,874 + 6.7% 46,990 47,375
- 14.1%
Pct. of Orig. Price Received 98.6% 99.1% + 0.5% 97.5% 98.2% + 0.7%
Cumulative Days on Market 51 45 - 11.8% 71 61
--
Final Days on Market 40 34 - 15.0% 56 48 - 14.3%
Months Supply 3.5 3.0 - 14.3% -- --
- 12.1%
Homes for Sale 16,903 14,332 - 15.2% -- -- --
Affordability Index 102 88 - 13.7% 107 94
30,981 - 1.6%
Median Sales Price $395,000 $423,250 + 7.2% $375,000 $399,000 + 6.4%
31,491
Key market metrics for the current month and year-to-date figures for Single-Family Homes Only.
Closed Sales 5,956 6,153 + 3.3%
Key Metrics
select the desired metric to jump to that page
7-2015 7-2016 7-2017 7-2018
7-2015 7-2016 7-2017 7-2018
7-2015 7-2016 7-2017 7-2018
7-2015 7-2016 7-2017 7-2018
7-2015 7-2016 7-2017 7-2018
7-2015 7-2016 7-2017 7-2018
7-2015 7-2016 7-2017 7-2018
7-2015 7-2016 7-2017 7-2018
7-2015 7-2016 7-2017 7-2018
Condominium Market Overview
Historical Sparkbars 7-2017 7-2018 + / – YTD 2017 YTD 2018 + / –Key Metrics
select the desired metric to jump to that page
Key market metrics for the current month and year-to-date figures for Condominium Properties Only.
12,494 - 0.0%
$384,900 + 9.3%
12,498Closed Sales 2,253 2,283 + 1.3%
Median Sales Price $370,000 $398,950 + 7.8% $352,000
Affordability Index 109 94 - 13.8% 114 97 - 14.9%
--
-- --
Homes for Sale 4,671 3,721 - 20.3% -- --
Months Supply 2.5 2.0 - 20.0% --
Final Days on Market 36 30 - 16.7% 45
Cumulative Days on Market 46 41 - 10.9% 56
+ 0.1% 99.5% 99.9%
- 15.6%
49 - 12.5%
38
All data from the Berkshire County Multiple Listing Service, Cape Cod & Islands Association of REALTORS®, Inc. and MLS Property Information Network, Inc. Provided by MAR. Report © 2018 ShowingTime. | 3
+ 0.4%
New Listings 2,265 2,299 + 1.5% 17,354 17,412 + 0.3%
Pct. of Orig. Price Received 100.2% 100.3%
7-2015 7-2016 7-2017 7-2018
7-2015 7-2016 7-2017 7-2018
7-2015 7-2016 7-2017 7-2018
7-2015 7-2016 7-2017 7-2018
7-2015 7-2016 7-2017 7-2018
7-2015 7-2016 7-2017 7-2018
7-2015 7-2016 7-2017 7-2018
7-2015 7-2016 7-2017 7-2018
7-2015 7-2016 7-2017 7-2018
Closed Sales
Single-Family
YoY
Change Condominium
YoY
Change
August 2017 6,424 + 0.0% 2,394 + 0.4%
September 2017 5,115 - 3.9% 1,929 - 5.0%
October 2017 5,041 + 7.9% 1,818 + 8.0%
November 2017 5,008 + 2.6% 1,993 + 12.8%
December 2017 4,545 - 6.6% 1,699 - 5.0%
January 2018 3,466 + 0.3% 1,268 - 3.9%
February 2018 2,444 - 4.1% 1,011 + 3.9%
March 2018 3,409 - 7.4% 1,488 - 10.1%
April 2018 3,851 + 1.3% 1,720 + 15.8%
May 2018 4,939 - 2.9% 2,105 - 0.2%
June 2018 6,719 - 3.5% 2,619 - 3.1%
July 2018 6,153 + 3.3% 2,283 + 1.3%
Total 57,114 - 0.9% 22,327 + 0.8%
Historical Closed Sales by Month
Data is refreshed regularly to capture changes in market activity so figures show
All data from the Berkshire County Multiple Listing Service, Cape Cod & Islands Association of REALTORS®, Inc. and MLS Property Information Network, Inc. Provided by MAR. Report © 2018 ShowingTime. | 4
A count of the actual sales that closed in a given month.
0
1,000
2,000
3,000
4,000
5,000
6,000
7,000
1-2003 1-2004 1-2005 1-2006 1-2007 1-2008 1-2009 1-2010 1-2011 1-2012 1-2013 1-2014 1-2015 1-2016 1-2017 1-2018
Single-Family Condominium
5,912
2,139
5,956
2,253
6,153
2,283
Single-Family Condominium
July
31,593
12,275
31,491
12,498
30,981
12,494
Single-Family Condominium
Year to Date
2016 2017 2018
+ 1.3%+ 5.3%+ 3.3%+ 0.7% + 1.8%- 1.6%- 0.3% - 0.0%- 12.3% + 12.0% + 6.9%- 16.2%
2016 2017 2018 2016 2017 2018 2016 2017 2018
Median Sales Price
Point at which half of the sales sold for more and half sold for less, not accounting for seller concessions, in a given month.
Single-Family
YoY
Change Condominium
YoY
Change
August 2017 $392,000 + 4.5% $349,000 + 1.2%
September 2017 $375,000 + 7.1% $350,000 + 4.5%
October 2017 $370,000 + 5.4% $339,000 + 4.3%
November 2017 $380,000 + 4.1% $369,900 + 8.8%
December 2017 $380,000 + 7.1% $359,779 + 5.5%
January 2018 $367,250 + 3.5% $355,000 + 6.1%
February 2018 $350,000 + 7.0% $357,950 + 13.6%
March 2018 $368,250 + 5.2% $395,000 + 17.9%
April 2018 $384,700 + 6.9% $378,500 + 9.7%
May 2018 $405,000 + 5.8% $385,000 + 4.1%
June 2018 $430,000 + 6.7% $393,000 + 8.9%
July 2018 $423,250 + 7.2% $398,950 + 7.8%
Median $389,900 + 5.7% $369,990 + 7.2%
Historical Median Sales Price by Month
Data is refreshed regularly to capture changes in market activity so figures show
All data from the Berkshire County Multiple Listing Service, Cape Cod & Islands Association of REALTORS®, Inc. and MLS Property Information Network, Inc. Provided by MAR. Report © 2018 ShowingTime. | 5
$376,000
$355,000
$395,000
$370,000
$423,250
$398,950
Single-Family Condominium
July
$200,000
$250,000
$300,000
$350,000
$400,000
$450,000
1-2003 1-2004 1-2005 1-2006 1-2007 1-2008 1-2009 1-2010 1-2011 1-2012 1-2013 1-2014 1-2015 1-2016 1-2017 1-2018
Single-Family Condominium
$352,000
$330,000
$375,000
$352,000
$399,000
$384,900
Single-Family Condominium
Year to Date
+ 7.8%+ 4.2%+ 7.2%+ 5.1% + 6.7%+ 6.4%+ 6.5% + 9.3%+ 3.4% + 2.0% + 2.3%+ 4.4%
2016 2017 2018 2016 2017 2018 2016 2017 2018 2016 2017 2018
Housing Affordability Index
Single-Family
YoY
Change Condominium
YoY
Change
August 2017 103 - 7.2% 116 - 3.3%
September 2017 108 - 8.5% 116 - 5.7%
October 2017 108 - 9.2% 117 - 9.3%
November 2017 106 - 2.8% 109 - 6.8%
December 2017 105 - 2.8% 111 - 1.8%
January 2018 103 - 3.7% 107 - 6.1%
February 2018 108 - 9.2% 106 - 14.5%
March 2018 102 - 8.1% 96 - 17.2%
April 2018 96 - 12.7% 98 - 14.8%
May 2018 92 - 12.4% 96 - 11.1%
June 2018 87 - 12.1% 95 - 14.4%
July 2018 88 - 13.7% 94 - 13.8%
Average 101 - 8.5% 105 - 10.0%
Historical Housing Affordability Index by Month
Data is refreshed re
This index measures housing affordability for the region. For example, an index of 120 means the median household income is 120% of what is
necessary to qualify for the median-priced home under prevailing interest rates. A higher number means greater affordability.
All data from the Berkshire County Multiple Listing Service, Cape Cod & Islands Association of REALTORS®, Inc. and MLS Property Information Network, Inc. Provided by MAR. Report © 2018 ShowingTime. | 6
110
117
102
109
88
94
Single-Family Condominium
July
60
80
100
120
140
160
180
1-2003 1-2004 1-2005 1-2006 1-2007 1-2008 1-2009 1-2010 1-2011 1-2012 1-2013 1-2014 1-2015 1-2016 1-2017 1-2018
Single-Family Condominium
118
125
107
114
94 97
Single-Family Condominium
Year to Date
- 13.8%- 6.8%- 13.7%- 7.3% - 8.8%- 12.1%- 9.3% - 14.9%0.0% + 1.7% + 0.8%0.0%
2016 2017 2018 2016 2017 2018 2016 2017 2018 2016 2017 2018
Inventory of Homes for Sale
Single-Family
YoY
Change Condominium
YoY
Change
August 2017 16,775 - 16.7% 4,510 - 11.2%
September 2017 17,446 - 15.4% 4,902 - 10.2%
October 2017 16,622 - 14.3% 4,651 - 11.2%
November 2017 14,706 - 14.5% 4,250 - 10.8%
December 2017 11,790 - 15.2% 3,235 - 16.5%
January 2018 10,964 - 18.0% 3,190 - 17.9%
February 2018 11,091 - 15.5% 3,282 - 15.4%
March 2018 11,107 - 19.7% 3,265 - 21.0%
April 2018 12,566 - 17.0% 3,875 - 11.1%
May 2018 14,523 - 11.7% 4,175 - 10.0%
June 2018 15,034 - 10.8% 4,127 - 11.5%
July 2018 14,332 - 15.2% 3,721 - 20.3%
Average 13,913 - 15.2% 3,932 - 13.7%
Historical Inventory of Homes for Sale by Month
Data is refreshed regularly to capture changes in market activity so figures show
All data from the Berkshire County Multiple Listing Service, Cape Cod & Islands Association of REALTORS®, Inc. and MLS Property Information Network, Inc. Provided by MAR. Report © 2018 ShowingTime. | 7
The number of properties available for sale in an active status at the end of a given month.
20,748
5,357
16,903
4,671
14,332
3,721
Single-Family Condominium
July
0
10,000
20,000
30,000
40,000
1-2003 1-2004 1-2005 1-2006 1-2007 1-2008 1-2009 1-2010 1-2011 1-2012 1-2013 1-2014 1-2015 1-2016 1-2017 1-2018
Single-Family Condominium
2016 2017 2018
- 20.3%- 12.8%- 15.2%- 18.5%
2016 2017 2018
- 17.3% - 11.9%
Months Supply of Inventory
The inventory of homes for sale at the end of a given month, divided by the average monthly pending sales from the last 12 months.
Single-Family
YoY
Change Condominium
YoY
Change
August 2017 3.5 - 16.7% 2.5 - 10.7%
September 2017 3.7 - 14.0% 2.7 - 10.0%
October 2017 3.5 - 12.5% 2.5 - 13.8%
November 2017 3.1 - 13.9% 2.3 - 11.5%
December 2017 2.5 - 13.8% 1.7 - 19.0%
January 2018 2.3 - 17.9% 1.7 - 19.0%
February 2018 2.3 - 14.8% 1.8 - 14.3%
March 2018 2.3 - 20.7% 1.8 - 18.2%
April 2018 2.6 - 18.8% 2.1 - 12.5%
May 2018 3.1 - 11.4% 2.2 - 12.0%
June 2018 3.2 - 8.6% 2.2 - 12.0%
July 2018 3.0 - 14.3% 2.0 - 20.0%
Average 2.9 - 14.9% 2.1 - 15.2%
Historical Months Supply of Inventory by Month
Data is refreshed regularly to capture changes in market activity so figures show
All data from the Berkshire County Multiple Listing Service, Cape Cod & Islands Association of REALTORS®, Inc. and MLS Property Information Network, Inc. Provided by MAR. Report © 2018 ShowingTime. | 8
4.3
3.0
3.5
2.5
3.0
2.0
Single-Family Condominium
July
0
2
4
6
8
10
12
14
16
1-2003 1-2004 1-2005 1-2006 1-2007 1-2008 1-2009 1-2010 1-2011 1-2012 1-2013 1-2014 1-2015 1-2016 1-2017 1-2018
Single-Family Condominium
2016 2017 2018
- 20.0%- 16.7%- 14.3%- 18.6%
2016 2017 2018
- 25.9% - 16.7%
Final Days on Market
Single-Family
YoY
Change Condominium
YoY
Change
August 2017 44 - 13.7% 38 - 15.6%
September 2017 49 - 15.5% 42 - 4.5%
October 2017 49 - 18.3% 40 - 18.4%
November 2017 53 - 10.2% 39 - 15.2%
December 2017 55 - 11.3% 44 - 6.4%
January 2018 60 - 10.4% 52 - 13.3%
February 2018 68 - 13.9% 50 - 9.1%
March 2018 63 - 13.7% 47 - 9.6%
April 2018 53 - 19.7% 39 - 17.0%
May 2018 46 - 16.4% 37 - 14.0%
June 2018 38 - 13.6% 31 - 11.4%
July 2018 34 - 15.0% 30 - 16.7%
Average 49 - 14.3% 39 - 13.1%
Historical Final Days on Market by Month
Data is refreshed regularly to capture changes in market activity so figures show
Average number of days between when a property is last listed and when the final offer is accepted in a given month.
All data from the Berkshire County Multiple Listing Service, Cape Cod & Islands Association of REALTORS®, Inc. and MLS Property Information Network, Inc. Provided by MAR. Report © 2018 ShowingTime. | 9
50
3940
36
34
30
Single-Family Condominium
July
20
40
60
80
100
120
140
1-2003 1-2004 1-2005 1-2006 1-2007 1-2008 1-2009 1-2010 1-2011 1-2012 1-2013 1-2014 1-2015 1-2016 1-2017 1-2018
Single-Family Condominium
66
50
56
45
48
38
Single-Family Condominium
Year to Date
- 16.7%- 7.7%- 15.0%- 20.0% - 10.0%- 14.3%- 15.2% - 15.6%0.0% - 5.7% - 7.4%- 11.4%
2016 2017 2018 2016 2017 2018 2016 2017 2018 2016 2017 2018
Cumulative Days on Market
Single-Family
YoY
Change Condominium
YoY
Change
August 2017 55 - 27.6% 47 - 25.4%
September 2017 62 - 18.4% 51 - 15.0%
October 2017 62 - 19.5% 50 - 16.7%
November 2017 66 - 13.2% 48 - 18.6%
December 2017 69 - 12.7% 54 - 11.5%
January 2018 72 - 12.2% 62 - 15.1%
February 2018 84 - 12.5% 63 - 7.4%
March 2018 79 - 13.2% 58 - 12.1%
April 2018 67 - 19.3% 50 - 18.0%
May 2018 59 - 16.9% 47 - 11.3%
June 2018 48 - 15.8% 41 - 12.8%
July 2018 45 - 11.8% 41 - 10.9%
Average 61 - 16.6% 50 - 15.1%
Historical Cumulative Days on Market by Month
Data is refreshed regularly to capture changes in market activity so figures show
Average number of days between when a property is first listed and when the final offer is accepted before closing in a given month.
All data from the Berkshire County Multiple Listing Service, Cape Cod & Islands Association of REALTORS®, Inc. and MLS Property Information Network, Inc. Provided by MAR. Report © 2018 ShowingTime. | 10
78
59
51
4645
41
Single-Family Condominium
July
40
60
80
100
120
140
160
180
1-2003 1-2004 1-2005 1-2006 1-2007 1-2008 1-2009 1-2010 1-2011 1-2012 1-2013 1-2014 1-2015 1-2016 1-2017 1-2018
Single-Family Condominium
97
7371
56
61
49
Single-Family Condominium
Year to Date
- 10.9%- 22.0%- 11.8%- 34.6% - 23.3%- 14.1%- 26.8% - 12.5%0.0% - 4.9% - 5.2%- 10.6%
2016 2017 2018 2016 2017 2018 2016 2017 2018 2016 2017 2018
Percent of Original List Price Received
Single-Family
YoY
Change Condominium
YoY
Change
August 2017 98.0% + 0.8% 99.4% + 0.3%
September 2017 97.3% + 0.9% 99.3% + 0.9%
October 2017 97.3% + 1.1% 99.2% + 0.9%
November 2017 96.6% + 0.4% 98.8% + 0.6%
December 2017 96.1% + 0.4% 98.5% + 1.0%
January 2018 96.1% + 0.9% 97.6% + 0.6%
February 2018 96.0% + 0.8% 98.6% + 0.9%
March 2018 97.1% + 0.7% 99.5% + 0.6%
April 2018 98.3% + 1.1% 100.3% + 1.0%
May 2018 98.7% + 0.6% 100.7% + 0.5%
June 2018 99.2% + 0.5% 100.6% + 0.1%
July 2018 99.1% + 0.5% 100.3% + 0.1%
Average 97.7% + 0.7% 99.6% + 0.6%
Historical Percent of Original List Price Received by Month
Data is refreshed regularly to capture changes in market activity so figures show
Percentage found when dividing a property’s sales price by its original list price, then taking the average for all properties sold
in a given month, not accounting for seller concessions.
All data from the Berkshire County Multiple Listing Service, Cape Cod & Islands Association of REALTORS®, Inc. and MLS Property Information Network, Inc. Provided by MAR. Report © 2018 ShowingTime. | 11
97.6% 99.5%98.6% 100.2%99.1% 100.3%
Single-Family Condominium
July
88%
90%
92%
94%
96%
98%
100%
102%
1-2003 1-2004 1-2005 1-2006 1-2007 1-2008 1-2009 1-2010 1-2011 1-2012 1-2013 1-2014 1-2015 1-2016 1-2017 1-2018
Single-Family Condominium
96.3% 98.7%97.5% 99.5%98.2% 99.9%
Single-Family Condominium
Year to Date
+ 0.1%+ 0.7%+ 0.5%+ 1.0% + 0.8%+ 0.7%+ 1.2% + 0.4%+ 0.5% + 0.6% + 0.4%+ 0.4%
2016 2017 2018 2016 2017 2018 2016 2017 2018 2016 2017 2018
New Listings
Single-Family
YoY
Change Condominium
YoY
Change
August 2017 6,565 + 2.3% 2,138 + 0.4%
September 2017 7,314 - 0.2% 2,704 - 1.8%
October 2017 6,025 + 5.9% 2,255 + 6.3%
November 2017 4,239 + 4.9% 1,704 + 5.8%
December 2017 2,398 - 1.4% 805 - 15.4%
January 2018 3,537 - 14.9% 1,554 - 15.1%
February 2018 4,671 + 8.0% 1,909 + 11.8%
March 2018 5,864 - 18.0% 2,375 - 15.1%
April 2018 8,109 + 5.6% 3,164 + 18.7%
May 2018 9,894 + 8.5% 3,274 + 2.9%
June 2018 8,426 + 3.8% 2,837 - 2.3%
July 2018 6,874 + 6.7% 2,299 + 1.5%
Total 73,916 + 1.4% 27,018 + 0.4%
Historical New Listings by Month
Data is refreshed re
A count of the properties that have been newly listed on the market in a given month.
All data from the Berkshire County Multiple Listing Service, Cape Cod & Islands Association of REALTORS®, Inc. and MLS Property Information Network, Inc. Provided by MAR. Report © 2018 ShowingTime. | 12
6,396
2,305
6,444
2,265
6,874
2,299
Single-Family Condominium
July
49,491
17,511
46,990
17,354
47,375
17,412
Single-Family Condominium
Year to Date
+ 1.5%- 1.7%+ 6.7%+ 0.8% - 0.9%+ 0.8%- 5.1% + 0.3%- 14.8% - 2.2% - 0.8%- 4.2%
0
2,000
4,000
6,000
8,000
10,000
12,000
1-2003 1-2004 1-2005 1-2006 1-2007 1-2008 1-2009 1-2010 1-2011 1-2012 1-2013 1-2014 1-2015 1-2016 1-2017 1-2018
Single-Family Condominium
2016 2017 2018 2016 2017 2018 2016 2017 2018 2016 2017 2018
Glossary of Terms
Closed Sales
Median Sales Price
Housing Affordability Index
Inventory of Homes for Sale
Months Supply of Inventory
Final Days on Market Until Sale
Cumulative Days on Market Until Sale
Percent of Original List Price Received
New Listings
All data from the Berkshire County Multiple Listing Service, Cape Cod & Islands Association of REALTORS®, Inc. and MLS Property Information Network, Inc. Provided by MAR. Report © 2018 ShowingTime. | 13
A measure of the number of homes available for sale at a given time. Once a listing goes pending, sold or is taken off the market, it is no
longer considered “active.” The availability of homes for sale has a big effect on supply-demand dynamics and home prices.
The inventory of homes for sale (at the end of a given month) divided by the average monthly pending sales from the last 12 months.
A measure of how many calendar days pass between when a listing becomes active (not pending) for the last time to the last time it goes
pending directly before it is sold. A pending sale is defined as something classified as Pending, Active with a Flag, Contingent or Under
Agreement.
A measure of the average number of calendar days that pass from when a listing is first listed to when a property goes into the last pending
status before it is sold.
This is calculated as Total Sold Dollars (all sold prices added together) divided by Total Original Price (all original list prices added together).
A measure of how much new supply is coming onto the market from sellers. It is calculated by counting all listings with a list date in the
reporting period.
A measure of how affordable a region’s housing is to its consumers. A higher number means greater affordability. The index is based on
interest rates, median sales price and average income by county.
A research tool provided by the Massachusetts Association of REALTORS®
A measure of home sales that were closed to completion during the report period.
A measure of home values in a market area where 50% of activity was higher and 50% was lower than this price point.

More Related Content

What's hot

Charlotte Region Weekly Real Estate Market Activity Report
Charlotte Region Weekly Real Estate Market Activity ReportCharlotte Region Weekly Real Estate Market Activity Report
Charlotte Region Weekly Real Estate Market Activity ReportScott Browder
 
San Francisco Market Focus Report Aug 2018
San Francisco Market Focus Report Aug 2018San Francisco Market Focus Report Aug 2018
San Francisco Market Focus Report Aug 2018Ronny Budiutama
 
Charlotte Region Weekly Market Activity Report
Charlotte Region Weekly Market Activity ReportCharlotte Region Weekly Market Activity Report
Charlotte Region Weekly Market Activity ReportScott Browder
 
January 2015 Greater Boston Real Estate Market Trends Report
January 2015 Greater Boston Real Estate Market Trends ReportJanuary 2015 Greater Boston Real Estate Market Trends Report
January 2015 Greater Boston Real Estate Market Trends ReportUnit Realty Group
 
Jacksonville real estate market report June 2017
Jacksonville real estate market report June 2017Jacksonville real estate market report June 2017
Jacksonville real estate market report June 2017Brad Officer Group
 
March 2018 Market Reports for the Gallatin Valley
March 2018 Market Reports for the Gallatin ValleyMarch 2018 Market Reports for the Gallatin Valley
March 2018 Market Reports for the Gallatin ValleyReferred Realty Group
 
Georgia Housing Market Snapshot For February 2019
Georgia Housing Market Snapshot For February 2019Georgia Housing Market Snapshot For February 2019
Georgia Housing Market Snapshot For February 2019Arthur Prescott
 
Real Estate Market Watch 2015
Real Estate Market Watch 2015Real Estate Market Watch 2015
Real Estate Market Watch 2015Scott Browder
 
San Francisco Market Focus Report September 2018
San Francisco Market Focus Report September 2018San Francisco Market Focus Report September 2018
San Francisco Market Focus Report September 2018Ronny Budiutama
 
San Francisco Market Focus Report November 2018
San Francisco Market Focus Report November 2018San Francisco Market Focus Report November 2018
San Francisco Market Focus Report November 2018Ronny Budiutama
 
San Francisco Market Focus Report July
San Francisco Market Focus Report JulySan Francisco Market Focus Report July
San Francisco Market Focus Report JulyRonny Budiutama
 
October 2015 Greater Boston Real Estate Market Trends Report
October 2015 Greater Boston Real Estate Market Trends ReportOctober 2015 Greater Boston Real Estate Market Trends Report
October 2015 Greater Boston Real Estate Market Trends ReportUnit Realty Group
 
August 2015 Greater Boston Real Estate Market Trends Report
August 2015 Greater Boston Real Estate Market Trends ReportAugust 2015 Greater Boston Real Estate Market Trends Report
August 2015 Greater Boston Real Estate Market Trends ReportUnit Realty Group
 
Georgia Real Estate Market Trends
Georgia Real Estate Market TrendsGeorgia Real Estate Market Trends
Georgia Real Estate Market TrendsArthur Prescott
 
San Francisco Market Focus February 2018
San Francisco Market Focus February 2018San Francisco Market Focus February 2018
San Francisco Market Focus February 2018Ronny Budiutama
 
San Francisco market focus report June 2018
San Francisco market focus report June 2018San Francisco market focus report June 2018
San Francisco market focus report June 2018Ronny Budiutama
 
San Francisco Market Focus April 2018
San Francisco Market Focus April 2018San Francisco Market Focus April 2018
San Francisco Market Focus April 2018Ronny Budiutama
 
January 2018 San Francisco Market Update
January 2018 San Francisco Market UpdateJanuary 2018 San Francisco Market Update
January 2018 San Francisco Market UpdateRonny Budiutama
 
The Georgia Association Of Realtors Monthly Indicators For April 2014
The Georgia Association Of Realtors Monthly Indicators For April 2014The Georgia Association Of Realtors Monthly Indicators For April 2014
The Georgia Association Of Realtors Monthly Indicators For April 2014Arthur Prescott
 
Georgia Housing Market Snapshot For March 2019
Georgia Housing Market Snapshot For March 2019Georgia Housing Market Snapshot For March 2019
Georgia Housing Market Snapshot For March 2019Arthur Prescott
 

What's hot (20)

Charlotte Region Weekly Real Estate Market Activity Report
Charlotte Region Weekly Real Estate Market Activity ReportCharlotte Region Weekly Real Estate Market Activity Report
Charlotte Region Weekly Real Estate Market Activity Report
 
San Francisco Market Focus Report Aug 2018
San Francisco Market Focus Report Aug 2018San Francisco Market Focus Report Aug 2018
San Francisco Market Focus Report Aug 2018
 
Charlotte Region Weekly Market Activity Report
Charlotte Region Weekly Market Activity ReportCharlotte Region Weekly Market Activity Report
Charlotte Region Weekly Market Activity Report
 
January 2015 Greater Boston Real Estate Market Trends Report
January 2015 Greater Boston Real Estate Market Trends ReportJanuary 2015 Greater Boston Real Estate Market Trends Report
January 2015 Greater Boston Real Estate Market Trends Report
 
Jacksonville real estate market report June 2017
Jacksonville real estate market report June 2017Jacksonville real estate market report June 2017
Jacksonville real estate market report June 2017
 
March 2018 Market Reports for the Gallatin Valley
March 2018 Market Reports for the Gallatin ValleyMarch 2018 Market Reports for the Gallatin Valley
March 2018 Market Reports for the Gallatin Valley
 
Georgia Housing Market Snapshot For February 2019
Georgia Housing Market Snapshot For February 2019Georgia Housing Market Snapshot For February 2019
Georgia Housing Market Snapshot For February 2019
 
Real Estate Market Watch 2015
Real Estate Market Watch 2015Real Estate Market Watch 2015
Real Estate Market Watch 2015
 
San Francisco Market Focus Report September 2018
San Francisco Market Focus Report September 2018San Francisco Market Focus Report September 2018
San Francisco Market Focus Report September 2018
 
San Francisco Market Focus Report November 2018
San Francisco Market Focus Report November 2018San Francisco Market Focus Report November 2018
San Francisco Market Focus Report November 2018
 
San Francisco Market Focus Report July
San Francisco Market Focus Report JulySan Francisco Market Focus Report July
San Francisco Market Focus Report July
 
October 2015 Greater Boston Real Estate Market Trends Report
October 2015 Greater Boston Real Estate Market Trends ReportOctober 2015 Greater Boston Real Estate Market Trends Report
October 2015 Greater Boston Real Estate Market Trends Report
 
August 2015 Greater Boston Real Estate Market Trends Report
August 2015 Greater Boston Real Estate Market Trends ReportAugust 2015 Greater Boston Real Estate Market Trends Report
August 2015 Greater Boston Real Estate Market Trends Report
 
Georgia Real Estate Market Trends
Georgia Real Estate Market TrendsGeorgia Real Estate Market Trends
Georgia Real Estate Market Trends
 
San Francisco Market Focus February 2018
San Francisco Market Focus February 2018San Francisco Market Focus February 2018
San Francisco Market Focus February 2018
 
San Francisco market focus report June 2018
San Francisco market focus report June 2018San Francisco market focus report June 2018
San Francisco market focus report June 2018
 
San Francisco Market Focus April 2018
San Francisco Market Focus April 2018San Francisco Market Focus April 2018
San Francisco Market Focus April 2018
 
January 2018 San Francisco Market Update
January 2018 San Francisco Market UpdateJanuary 2018 San Francisco Market Update
January 2018 San Francisco Market Update
 
The Georgia Association Of Realtors Monthly Indicators For April 2014
The Georgia Association Of Realtors Monthly Indicators For April 2014The Georgia Association Of Realtors Monthly Indicators For April 2014
The Georgia Association Of Realtors Monthly Indicators For April 2014
 
Georgia Housing Market Snapshot For March 2019
Georgia Housing Market Snapshot For March 2019Georgia Housing Market Snapshot For March 2019
Georgia Housing Market Snapshot For March 2019
 

Similar to Massachusetts statewide closed sales for condos and single family homes

San Francisco Market Focus Report May
San Francisco Market Focus Report MaySan Francisco Market Focus Report May
San Francisco Market Focus Report MayRonny Budiutama
 
June 2018 Gallatin Valley Market Reports
June 2018 Gallatin Valley Market ReportsJune 2018 Gallatin Valley Market Reports
June 2018 Gallatin Valley Market ReportsReferred Realty Group
 
Greater Baton Rouge Home Sales June 2019
Greater Baton Rouge Home Sales June 2019Greater Baton Rouge Home Sales June 2019
Greater Baton Rouge Home Sales June 2019Bill Cobb, Appraiser
 
San Francisco Market Focus Report December 2018
San Francisco Market Focus Report December 2018San Francisco Market Focus Report December 2018
San Francisco Market Focus Report December 2018Ronny Budiutama
 
Real Estate Weekly Market Activity Report
Real Estate Weekly Market Activity ReportReal Estate Weekly Market Activity Report
Real Estate Weekly Market Activity ReportScott Browder
 
San Francisco Market Focus Report October 2018
San Francisco Market Focus Report October 2018San Francisco Market Focus Report October 2018
San Francisco Market Focus Report October 2018Ronny Budiutama
 
August 2018 Bozeman Home Sales Market Data
August 2018 Bozeman Home Sales Market DataAugust 2018 Bozeman Home Sales Market Data
August 2018 Bozeman Home Sales Market DataReferred Realty Group
 
San Francisco Market Focus March 2018
San Francisco Market Focus March 2018San Francisco Market Focus March 2018
San Francisco Market Focus March 2018Ronny Budiutama
 
Greater Baton Rouge Home Sales December 2017 Update provided by GBRAR.
Greater Baton Rouge Home Sales December 2017 Update provided by GBRAR. Greater Baton Rouge Home Sales December 2017 Update provided by GBRAR.
Greater Baton Rouge Home Sales December 2017 Update provided by GBRAR. Bill Cobb, Appraiser
 
July 2018 Gallatin Valley Market Reports
July 2018 Gallatin Valley Market ReportsJuly 2018 Gallatin Valley Market Reports
July 2018 Gallatin Valley Market ReportsReferred Realty Group
 
Charlotte Real Estate Market Overview
Charlotte Real Estate Market OverviewCharlotte Real Estate Market Overview
Charlotte Real Estate Market OverviewScott Browder
 
San Francisco Market Focus Sept 2017
San Francisco Market Focus Sept 2017San Francisco Market Focus Sept 2017
San Francisco Market Focus Sept 2017Ronny Budiutama
 
January 2014 Greater Boston Real Estate Market Trends Report
January 2014 Greater Boston Real Estate Market Trends ReportJanuary 2014 Greater Boston Real Estate Market Trends Report
January 2014 Greater Boston Real Estate Market Trends ReportUnit Realty Group
 
Jan 2018 Gallatin Valley market reports
Jan 2018 Gallatin Valley market reportsJan 2018 Gallatin Valley market reports
Jan 2018 Gallatin Valley market reportsReferred Realty Group
 

Similar to Massachusetts statewide closed sales for condos and single family homes (15)

San Francisco Market Focus Report May
San Francisco Market Focus Report MaySan Francisco Market Focus Report May
San Francisco Market Focus Report May
 
June 2018 Gallatin Valley Market Reports
June 2018 Gallatin Valley Market ReportsJune 2018 Gallatin Valley Market Reports
June 2018 Gallatin Valley Market Reports
 
Greater Baton Rouge Home Sales June 2019
Greater Baton Rouge Home Sales June 2019Greater Baton Rouge Home Sales June 2019
Greater Baton Rouge Home Sales June 2019
 
San Francisco Market Focus Report December 2018
San Francisco Market Focus Report December 2018San Francisco Market Focus Report December 2018
San Francisco Market Focus Report December 2018
 
May 2018 Market Reports
May 2018 Market ReportsMay 2018 Market Reports
May 2018 Market Reports
 
Real Estate Weekly Market Activity Report
Real Estate Weekly Market Activity ReportReal Estate Weekly Market Activity Report
Real Estate Weekly Market Activity Report
 
San Francisco Market Focus Report October 2018
San Francisco Market Focus Report October 2018San Francisco Market Focus Report October 2018
San Francisco Market Focus Report October 2018
 
August 2018 Bozeman Home Sales Market Data
August 2018 Bozeman Home Sales Market DataAugust 2018 Bozeman Home Sales Market Data
August 2018 Bozeman Home Sales Market Data
 
San Francisco Market Focus March 2018
San Francisco Market Focus March 2018San Francisco Market Focus March 2018
San Francisco Market Focus March 2018
 
Greater Baton Rouge Home Sales December 2017 Update provided by GBRAR.
Greater Baton Rouge Home Sales December 2017 Update provided by GBRAR. Greater Baton Rouge Home Sales December 2017 Update provided by GBRAR.
Greater Baton Rouge Home Sales December 2017 Update provided by GBRAR.
 
July 2018 Gallatin Valley Market Reports
July 2018 Gallatin Valley Market ReportsJuly 2018 Gallatin Valley Market Reports
July 2018 Gallatin Valley Market Reports
 
Charlotte Real Estate Market Overview
Charlotte Real Estate Market OverviewCharlotte Real Estate Market Overview
Charlotte Real Estate Market Overview
 
San Francisco Market Focus Sept 2017
San Francisco Market Focus Sept 2017San Francisco Market Focus Sept 2017
San Francisco Market Focus Sept 2017
 
January 2014 Greater Boston Real Estate Market Trends Report
January 2014 Greater Boston Real Estate Market Trends ReportJanuary 2014 Greater Boston Real Estate Market Trends Report
January 2014 Greater Boston Real Estate Market Trends Report
 
Jan 2018 Gallatin Valley market reports
Jan 2018 Gallatin Valley market reportsJan 2018 Gallatin Valley market reports
Jan 2018 Gallatin Valley market reports
 

More from Michael Mahoney

Realtors Guide to Smoke and Carbon Monoxide Detectors in Massachusetts by Cen...
Realtors Guide to Smoke and Carbon Monoxide Detectors in Massachusetts by Cen...Realtors Guide to Smoke and Carbon Monoxide Detectors in Massachusetts by Cen...
Realtors Guide to Smoke and Carbon Monoxide Detectors in Massachusetts by Cen...Michael Mahoney
 
Riverwalk Commons Condominiums Walpole MA
Riverwalk Commons Condominiums Walpole MA Riverwalk Commons Condominiums Walpole MA
Riverwalk Commons Condominiums Walpole MA Michael Mahoney
 
Hartshorn Village Condos in Walpole MA
Hartshorn Village Condos in Walpole MAHartshorn Village Condos in Walpole MA
Hartshorn Village Condos in Walpole MAMichael Mahoney
 
Medway Massachusetts Realtor
Medway Massachusetts RealtorMedway Massachusetts Realtor
Medway Massachusetts RealtorMichael Mahoney
 
Why Agents are Joining eXp Realty in Boston
Why Agents are Joining eXp Realty in BostonWhy Agents are Joining eXp Realty in Boston
Why Agents are Joining eXp Realty in BostonMichael Mahoney
 
44 Lake Street in Abington Massachusetts Open House Flyer
44 Lake Street in Abington Massachusetts Open House Flyer44 Lake Street in Abington Massachusetts Open House Flyer
44 Lake Street in Abington Massachusetts Open House FlyerMichael Mahoney
 
Benjamins Landing Condominium Report Franklin MA
Benjamins Landing Condominium Report Franklin MABenjamins Landing Condominium Report Franklin MA
Benjamins Landing Condominium Report Franklin MAMichael Mahoney
 
The Village at Crown Colony Report by Michael Mahoney Realtor
The Village at Crown Colony Report by Michael Mahoney RealtorThe Village at Crown Colony Report by Michael Mahoney Realtor
The Village at Crown Colony Report by Michael Mahoney RealtorMichael Mahoney
 
Norfolk County Real Estate Report
Norfolk County Real Estate ReportNorfolk County Real Estate Report
Norfolk County Real Estate ReportMichael Mahoney
 
Neighborhood Real Estate Report by Michael Mahoney Realtor
Neighborhood Real Estate Report by Michael Mahoney RealtorNeighborhood Real Estate Report by Michael Mahoney Realtor
Neighborhood Real Estate Report by Michael Mahoney RealtorMichael Mahoney
 
Millhaus condos mansfield massachusetts
Millhaus condos mansfield massachusettsMillhaus condos mansfield massachusetts
Millhaus condos mansfield massachusettsMichael Mahoney
 
Natick Mass Real Estate Market by Realtor Michael Mahoney of Keller Williams
Natick Mass Real Estate Market by Realtor Michael Mahoney of Keller WilliamsNatick Mass Real Estate Market by Realtor Michael Mahoney of Keller Williams
Natick Mass Real Estate Market by Realtor Michael Mahoney of Keller WilliamsMichael Mahoney
 
Forge Hill Condos Franklin Ma Sold in last 12 Months Comprehensive Report
Forge Hill Condos Franklin Ma Sold in last 12 Months Comprehensive ReportForge Hill Condos Franklin Ma Sold in last 12 Months Comprehensive Report
Forge Hill Condos Franklin Ma Sold in last 12 Months Comprehensive ReportMichael Mahoney
 
Boydes Crossing Norfolk MA Public Lottery Package
Boydes Crossing Norfolk MA Public Lottery Package Boydes Crossing Norfolk MA Public Lottery Package
Boydes Crossing Norfolk MA Public Lottery Package Michael Mahoney
 
Forge Hill Condos Franklin MA 02038
Forge Hill Condos Franklin MA 02038Forge Hill Condos Franklin MA 02038
Forge Hill Condos Franklin MA 02038Michael Mahoney
 
Recent Sales at Swan Pond Condos in Walpole MA
Recent Sales at Swan Pond Condos in Walpole MARecent Sales at Swan Pond Condos in Walpole MA
Recent Sales at Swan Pond Condos in Walpole MAMichael Mahoney
 
Condos for Sale at Cannon Forge Foxboro MA
Condos for Sale at Cannon Forge Foxboro MA Condos for Sale at Cannon Forge Foxboro MA
Condos for Sale at Cannon Forge Foxboro MA Michael Mahoney
 
Open Houses in West Roxbury, Roslindale, Jamaica Plain and Hyde Park this wee...
Open Houses in West Roxbury, Roslindale, Jamaica Plain and Hyde Park this wee...Open Houses in West Roxbury, Roslindale, Jamaica Plain and Hyde Park this wee...
Open Houses in West Roxbury, Roslindale, Jamaica Plain and Hyde Park this wee...Michael Mahoney
 
Home Prices in Walpole Ma by Keller Williams Realtor Michael Mahoney
Home Prices in Walpole Ma by Keller Williams Realtor Michael MahoneyHome Prices in Walpole Ma by Keller Williams Realtor Michael Mahoney
Home Prices in Walpole Ma by Keller Williams Realtor Michael MahoneyMichael Mahoney
 

More from Michael Mahoney (20)

Fall 2023 Selling Guide
Fall 2023 Selling GuideFall 2023 Selling Guide
Fall 2023 Selling Guide
 
Realtors Guide to Smoke and Carbon Monoxide Detectors in Massachusetts by Cen...
Realtors Guide to Smoke and Carbon Monoxide Detectors in Massachusetts by Cen...Realtors Guide to Smoke and Carbon Monoxide Detectors in Massachusetts by Cen...
Realtors Guide to Smoke and Carbon Monoxide Detectors in Massachusetts by Cen...
 
Riverwalk Commons Condominiums Walpole MA
Riverwalk Commons Condominiums Walpole MA Riverwalk Commons Condominiums Walpole MA
Riverwalk Commons Condominiums Walpole MA
 
Hartshorn Village Condos in Walpole MA
Hartshorn Village Condos in Walpole MAHartshorn Village Condos in Walpole MA
Hartshorn Village Condos in Walpole MA
 
Medway Massachusetts Realtor
Medway Massachusetts RealtorMedway Massachusetts Realtor
Medway Massachusetts Realtor
 
Why Agents are Joining eXp Realty in Boston
Why Agents are Joining eXp Realty in BostonWhy Agents are Joining eXp Realty in Boston
Why Agents are Joining eXp Realty in Boston
 
44 Lake Street in Abington Massachusetts Open House Flyer
44 Lake Street in Abington Massachusetts Open House Flyer44 Lake Street in Abington Massachusetts Open House Flyer
44 Lake Street in Abington Massachusetts Open House Flyer
 
Benjamins Landing Condominium Report Franklin MA
Benjamins Landing Condominium Report Franklin MABenjamins Landing Condominium Report Franklin MA
Benjamins Landing Condominium Report Franklin MA
 
The Village at Crown Colony Report by Michael Mahoney Realtor
The Village at Crown Colony Report by Michael Mahoney RealtorThe Village at Crown Colony Report by Michael Mahoney Realtor
The Village at Crown Colony Report by Michael Mahoney Realtor
 
Norfolk County Real Estate Report
Norfolk County Real Estate ReportNorfolk County Real Estate Report
Norfolk County Real Estate Report
 
Neighborhood Real Estate Report by Michael Mahoney Realtor
Neighborhood Real Estate Report by Michael Mahoney RealtorNeighborhood Real Estate Report by Michael Mahoney Realtor
Neighborhood Real Estate Report by Michael Mahoney Realtor
 
Millhaus condos mansfield massachusetts
Millhaus condos mansfield massachusettsMillhaus condos mansfield massachusetts
Millhaus condos mansfield massachusetts
 
Natick Mass Real Estate Market by Realtor Michael Mahoney of Keller Williams
Natick Mass Real Estate Market by Realtor Michael Mahoney of Keller WilliamsNatick Mass Real Estate Market by Realtor Michael Mahoney of Keller Williams
Natick Mass Real Estate Market by Realtor Michael Mahoney of Keller Williams
 
Forge Hill Condos Franklin Ma Sold in last 12 Months Comprehensive Report
Forge Hill Condos Franklin Ma Sold in last 12 Months Comprehensive ReportForge Hill Condos Franklin Ma Sold in last 12 Months Comprehensive Report
Forge Hill Condos Franklin Ma Sold in last 12 Months Comprehensive Report
 
Boydes Crossing Norfolk MA Public Lottery Package
Boydes Crossing Norfolk MA Public Lottery Package Boydes Crossing Norfolk MA Public Lottery Package
Boydes Crossing Norfolk MA Public Lottery Package
 
Forge Hill Condos Franklin MA 02038
Forge Hill Condos Franklin MA 02038Forge Hill Condos Franklin MA 02038
Forge Hill Condos Franklin MA 02038
 
Recent Sales at Swan Pond Condos in Walpole MA
Recent Sales at Swan Pond Condos in Walpole MARecent Sales at Swan Pond Condos in Walpole MA
Recent Sales at Swan Pond Condos in Walpole MA
 
Condos for Sale at Cannon Forge Foxboro MA
Condos for Sale at Cannon Forge Foxboro MA Condos for Sale at Cannon Forge Foxboro MA
Condos for Sale at Cannon Forge Foxboro MA
 
Open Houses in West Roxbury, Roslindale, Jamaica Plain and Hyde Park this wee...
Open Houses in West Roxbury, Roslindale, Jamaica Plain and Hyde Park this wee...Open Houses in West Roxbury, Roslindale, Jamaica Plain and Hyde Park this wee...
Open Houses in West Roxbury, Roslindale, Jamaica Plain and Hyde Park this wee...
 
Home Prices in Walpole Ma by Keller Williams Realtor Michael Mahoney
Home Prices in Walpole Ma by Keller Williams Realtor Michael MahoneyHome Prices in Walpole Ma by Keller Williams Realtor Michael Mahoney
Home Prices in Walpole Ma by Keller Williams Realtor Michael Mahoney
 

Recently uploaded

Magarpatta Nova Elegance Mundhwa Pune E-Brochure.pdf
Magarpatta Nova Elegance Mundhwa Pune  E-Brochure.pdfMagarpatta Nova Elegance Mundhwa Pune  E-Brochure.pdf
Magarpatta Nova Elegance Mundhwa Pune E-Brochure.pdfManishSaxena95
 
Omaxe Dwarka In Delhi E Brochure Pdf
Omaxe Dwarka In Delhi E Brochure     PdfOmaxe Dwarka In Delhi E Brochure     Pdf
Omaxe Dwarka In Delhi E Brochure Pdfashiyadav24
 
Call Girls in Noida Sector 77 Noida 💯Call Us 🔝 9582086666 🔝 South Delhi Escor...
Call Girls in Noida Sector 77 Noida 💯Call Us 🔝 9582086666 🔝 South Delhi Escor...Call Girls in Noida Sector 77 Noida 💯Call Us 🔝 9582086666 🔝 South Delhi Escor...
Call Girls in Noida Sector 77 Noida 💯Call Us 🔝 9582086666 🔝 South Delhi Escor...delhimodel235
 
Call Girls In Vasant Vihar Delhi 💯Call Us 🔝8264348440🔝
Call Girls In Vasant Vihar Delhi 💯Call Us 🔝8264348440🔝Call Girls In Vasant Vihar Delhi 💯Call Us 🔝8264348440🔝
Call Girls In Vasant Vihar Delhi 💯Call Us 🔝8264348440🔝soniya singh
 
Call Girls Janta Market {Delhi//8447779280)) ₹↬Short 2000 Full Night 5500 ↫Es...
Call Girls Janta Market {Delhi//8447779280)) ₹↬Short 2000 Full Night 5500 ↫Es...Call Girls Janta Market {Delhi//8447779280)) ₹↬Short 2000 Full Night 5500 ↫Es...
Call Girls Janta Market {Delhi//8447779280)) ₹↬Short 2000 Full Night 5500 ↫Es...asmaqueen5
 
call girls in ganesh nagar Delhi 8264348440 ✅ call girls ❤️
call girls in ganesh nagar Delhi 8264348440 ✅ call girls ❤️call girls in ganesh nagar Delhi 8264348440 ✅ call girls ❤️
call girls in ganesh nagar Delhi 8264348440 ✅ call girls ❤️soniya singh
 
Listing Turkey Sylvana Istanbul - Bahcesehir
Listing Turkey Sylvana Istanbul - BahcesehirListing Turkey Sylvana Istanbul - Bahcesehir
Listing Turkey Sylvana Istanbul - BahcesehirListing Turkey
 
Call Girls in Kashmiri Gate Delhi 💯Call Us 🔝8264348440🔝
Call Girls in Kashmiri Gate Delhi 💯Call Us 🔝8264348440🔝Call Girls in Kashmiri Gate Delhi 💯Call Us 🔝8264348440🔝
Call Girls in Kashmiri Gate Delhi 💯Call Us 🔝8264348440🔝soniya singh
 
Model Call Girl in Shastri Nagar Delhi reach out to us at 🔝8264348440🔝
Model Call Girl in Shastri Nagar Delhi reach out to us at 🔝8264348440🔝Model Call Girl in Shastri Nagar Delhi reach out to us at 🔝8264348440🔝
Model Call Girl in Shastri Nagar Delhi reach out to us at 🔝8264348440🔝soniya singh
 
Building Dreams: Newman Leech's Visionary Approach to Real Estate Investment
Building Dreams: Newman Leech's Visionary Approach to Real Estate InvestmentBuilding Dreams: Newman Leech's Visionary Approach to Real Estate Investment
Building Dreams: Newman Leech's Visionary Approach to Real Estate InvestmentNewman George Leech
 
Call Girls In Mayur Vihar Delhi ☆↫8447779280 ❤Escorts Service In Delhi
Call Girls In Mayur Vihar Delhi ☆↫8447779280 ❤Escorts Service In DelhiCall Girls In Mayur Vihar Delhi ☆↫8447779280 ❤Escorts Service In Delhi
Call Girls In Mayur Vihar Delhi ☆↫8447779280 ❤Escorts Service In Delhiasmaqueen5
 
Call Girls in Nehru Place Delhi 💯Call Us 🔝8264348440🔝
Call Girls in Nehru Place Delhi 💯Call Us 🔝8264348440🔝Call Girls in Nehru Place Delhi 💯Call Us 🔝8264348440🔝
Call Girls in Nehru Place Delhi 💯Call Us 🔝8264348440🔝soniya singh
 
Sankla East World Hadapsar Pune E-Brochure.pdf
Sankla East World Hadapsar Pune  E-Brochure.pdfSankla East World Hadapsar Pune  E-Brochure.pdf
Sankla East World Hadapsar Pune E-Brochure.pdfManishSaxena95
 
Shapoorji Pallonji Parkwest Sequoia Tower Bangalore.pdf
Shapoorji Pallonji Parkwest Sequoia Tower Bangalore.pdfShapoorji Pallonji Parkwest Sequoia Tower Bangalore.pdf
Shapoorji Pallonji Parkwest Sequoia Tower Bangalore.pdfashiyadav24
 
Purva Palm Hills Devanahalli, Bangalore E- Brochure.pdf
Purva Palm Hills Devanahalli, Bangalore E- Brochure.pdfPurva Palm Hills Devanahalli, Bangalore E- Brochure.pdf
Purva Palm Hills Devanahalli, Bangalore E- Brochure.pdffaheemali990101
 
FULL ENJOY 🔝 8264348440 🔝 Call Girls in DLF phase 3 | Gurgaon
FULL ENJOY 🔝 8264348440 🔝 Call Girls in DLF phase 3 | GurgaonFULL ENJOY 🔝 8264348440 🔝 Call Girls in DLF phase 3 | Gurgaon
FULL ENJOY 🔝 8264348440 🔝 Call Girls in DLF phase 3 | Gurgaonsoniya singh
 
Aparna Greenscapes Kompally Hyderabad E - Brochure.pdf
Aparna Greenscapes Kompally Hyderabad E - Brochure.pdfAparna Greenscapes Kompally Hyderabad E - Brochure.pdf
Aparna Greenscapes Kompally Hyderabad E - Brochure.pdffaheemali990101
 
Eco-Efficient Living: Redefining Sustainability through Leech's Green Design ...
Eco-Efficient Living: Redefining Sustainability through Leech's Green Design ...Eco-Efficient Living: Redefining Sustainability through Leech's Green Design ...
Eco-Efficient Living: Redefining Sustainability through Leech's Green Design ...Newman George Leech
 
Call Girls in Noida Sector 12 Noida 💯Call Us 🔝 9582086666 🔝 South Delhi Escor...
Call Girls in Noida Sector 12 Noida 💯Call Us 🔝 9582086666 🔝 South Delhi Escor...Call Girls in Noida Sector 12 Noida 💯Call Us 🔝 9582086666 🔝 South Delhi Escor...
Call Girls in Noida Sector 12 Noida 💯Call Us 🔝 9582086666 🔝 South Delhi Escor...delhimodel235
 

Recently uploaded (20)

Magarpatta Nova Elegance Mundhwa Pune E-Brochure.pdf
Magarpatta Nova Elegance Mundhwa Pune  E-Brochure.pdfMagarpatta Nova Elegance Mundhwa Pune  E-Brochure.pdf
Magarpatta Nova Elegance Mundhwa Pune E-Brochure.pdf
 
Omaxe Dwarka In Delhi E Brochure Pdf
Omaxe Dwarka In Delhi E Brochure     PdfOmaxe Dwarka In Delhi E Brochure     Pdf
Omaxe Dwarka In Delhi E Brochure Pdf
 
Call Girls in Noida Sector 77 Noida 💯Call Us 🔝 9582086666 🔝 South Delhi Escor...
Call Girls in Noida Sector 77 Noida 💯Call Us 🔝 9582086666 🔝 South Delhi Escor...Call Girls in Noida Sector 77 Noida 💯Call Us 🔝 9582086666 🔝 South Delhi Escor...
Call Girls in Noida Sector 77 Noida 💯Call Us 🔝 9582086666 🔝 South Delhi Escor...
 
Call Girls In Vasant Vihar Delhi 💯Call Us 🔝8264348440🔝
Call Girls In Vasant Vihar Delhi 💯Call Us 🔝8264348440🔝Call Girls In Vasant Vihar Delhi 💯Call Us 🔝8264348440🔝
Call Girls In Vasant Vihar Delhi 💯Call Us 🔝8264348440🔝
 
Call Girls Janta Market {Delhi//8447779280)) ₹↬Short 2000 Full Night 5500 ↫Es...
Call Girls Janta Market {Delhi//8447779280)) ₹↬Short 2000 Full Night 5500 ↫Es...Call Girls Janta Market {Delhi//8447779280)) ₹↬Short 2000 Full Night 5500 ↫Es...
Call Girls Janta Market {Delhi//8447779280)) ₹↬Short 2000 Full Night 5500 ↫Es...
 
call girls in ganesh nagar Delhi 8264348440 ✅ call girls ❤️
call girls in ganesh nagar Delhi 8264348440 ✅ call girls ❤️call girls in ganesh nagar Delhi 8264348440 ✅ call girls ❤️
call girls in ganesh nagar Delhi 8264348440 ✅ call girls ❤️
 
Listing Turkey Sylvana Istanbul - Bahcesehir
Listing Turkey Sylvana Istanbul - BahcesehirListing Turkey Sylvana Istanbul - Bahcesehir
Listing Turkey Sylvana Istanbul - Bahcesehir
 
Call Girls in Kashmiri Gate Delhi 💯Call Us 🔝8264348440🔝
Call Girls in Kashmiri Gate Delhi 💯Call Us 🔝8264348440🔝Call Girls in Kashmiri Gate Delhi 💯Call Us 🔝8264348440🔝
Call Girls in Kashmiri Gate Delhi 💯Call Us 🔝8264348440🔝
 
Model Call Girl in Shastri Nagar Delhi reach out to us at 🔝8264348440🔝
Model Call Girl in Shastri Nagar Delhi reach out to us at 🔝8264348440🔝Model Call Girl in Shastri Nagar Delhi reach out to us at 🔝8264348440🔝
Model Call Girl in Shastri Nagar Delhi reach out to us at 🔝8264348440🔝
 
Building Dreams: Newman Leech's Visionary Approach to Real Estate Investment
Building Dreams: Newman Leech's Visionary Approach to Real Estate InvestmentBuilding Dreams: Newman Leech's Visionary Approach to Real Estate Investment
Building Dreams: Newman Leech's Visionary Approach to Real Estate Investment
 
Call Girls In Mayur Vihar Delhi ☆↫8447779280 ❤Escorts Service In Delhi
Call Girls In Mayur Vihar Delhi ☆↫8447779280 ❤Escorts Service In DelhiCall Girls In Mayur Vihar Delhi ☆↫8447779280 ❤Escorts Service In Delhi
Call Girls In Mayur Vihar Delhi ☆↫8447779280 ❤Escorts Service In Delhi
 
Call Girls in Nehru Place Delhi 💯Call Us 🔝8264348440🔝
Call Girls in Nehru Place Delhi 💯Call Us 🔝8264348440🔝Call Girls in Nehru Place Delhi 💯Call Us 🔝8264348440🔝
Call Girls in Nehru Place Delhi 💯Call Us 🔝8264348440🔝
 
Sankla East World Hadapsar Pune E-Brochure.pdf
Sankla East World Hadapsar Pune  E-Brochure.pdfSankla East World Hadapsar Pune  E-Brochure.pdf
Sankla East World Hadapsar Pune E-Brochure.pdf
 
Shapoorji Pallonji Parkwest Sequoia Tower Bangalore.pdf
Shapoorji Pallonji Parkwest Sequoia Tower Bangalore.pdfShapoorji Pallonji Parkwest Sequoia Tower Bangalore.pdf
Shapoorji Pallonji Parkwest Sequoia Tower Bangalore.pdf
 
VIP Escorts in Delhi:🔝9953056974🔝 Hot Qutub Minar Delhi Escorts Service
VIP Escorts in Delhi:🔝9953056974🔝 Hot Qutub Minar Delhi Escorts ServiceVIP Escorts in Delhi:🔝9953056974🔝 Hot Qutub Minar Delhi Escorts Service
VIP Escorts in Delhi:🔝9953056974🔝 Hot Qutub Minar Delhi Escorts Service
 
Purva Palm Hills Devanahalli, Bangalore E- Brochure.pdf
Purva Palm Hills Devanahalli, Bangalore E- Brochure.pdfPurva Palm Hills Devanahalli, Bangalore E- Brochure.pdf
Purva Palm Hills Devanahalli, Bangalore E- Brochure.pdf
 
FULL ENJOY 🔝 8264348440 🔝 Call Girls in DLF phase 3 | Gurgaon
FULL ENJOY 🔝 8264348440 🔝 Call Girls in DLF phase 3 | GurgaonFULL ENJOY 🔝 8264348440 🔝 Call Girls in DLF phase 3 | Gurgaon
FULL ENJOY 🔝 8264348440 🔝 Call Girls in DLF phase 3 | Gurgaon
 
Aparna Greenscapes Kompally Hyderabad E - Brochure.pdf
Aparna Greenscapes Kompally Hyderabad E - Brochure.pdfAparna Greenscapes Kompally Hyderabad E - Brochure.pdf
Aparna Greenscapes Kompally Hyderabad E - Brochure.pdf
 
Eco-Efficient Living: Redefining Sustainability through Leech's Green Design ...
Eco-Efficient Living: Redefining Sustainability through Leech's Green Design ...Eco-Efficient Living: Redefining Sustainability through Leech's Green Design ...
Eco-Efficient Living: Redefining Sustainability through Leech's Green Design ...
 
Call Girls in Noida Sector 12 Noida 💯Call Us 🔝 9582086666 🔝 South Delhi Escor...
Call Girls in Noida Sector 12 Noida 💯Call Us 🔝 9582086666 🔝 South Delhi Escor...Call Girls in Noida Sector 12 Noida 💯Call Us 🔝 9582086666 🔝 South Delhi Escor...
Call Girls in Noida Sector 12 Noida 💯Call Us 🔝 9582086666 🔝 South Delhi Escor...
 

Massachusetts statewide closed sales for condos and single family homes

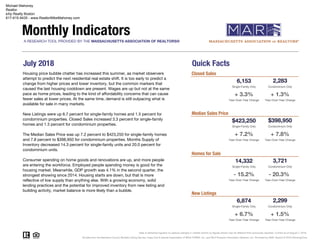
  • 1. A RESEARCH TOOL PROVIDED BY THE MASSACHUSETTS ASSOCIATION OF REALTORS® 6,153 Single-Family Only + 3.3% + 1.3% Year-Over-Year Change Median Sales Price $423,250 Single-Family Only + 7.2% + 7.8% Year-Over-Year Change Homes for Sale 14,332 Single-Family Only - 15.2% - 20.3% Year-Over-Year Change New Listings 6,874 Single-Family Only + 6.7% + 1.5% Year-Over-Year Change Data is refreshed regularly to capture changes in market activity so figures shown may be different than previously reported. Current as of August 7, 2018. Quick Facts 3,721 $398,950 All data from the Berkshire County Multiple Listing Service, Cape Cod & Islands Association of REALTORS®, Inc. and MLS Property Information Network, Inc. Provided by MAR. Report © 2018 ShowingTime. Monthly Indicators July 2018 Closed SalesHousing price bubble chatter has increased this summer, as market observers attempt to predict the next residential real estate shift. It is too early to predict a change from higher prices and lower inventory, but the common markers that caused the last housing cooldown are present. Wages are up but not at the same pace as home prices, leading to the kind of affordability concerns that can cause fewer sales at lower prices. At the same time, demand is still outpacing what is available for sale in many markets. New Listings were up 6.7 percent for single-family homes and 1.5 percent for condominium properties. Closed Sales increased 3.3 percent for single-family homes and 1.3 percent for condominium properties. The Median Sales Price was up 7.2 percent to $423,250 for single-family homes and 7.8 percent to $398,950 for condominium properties. Months Supply of Inventory decreased 14.3 percent for single-family units and 20.0 percent for condominium units. Consumer spending on home goods and renovations are up, and more people are entering the workforce. Employed people spending money is good for the housing market. Meanwhile, GDP growth was 4.1% in the second quarter, the strongest showing since 2014. Housing starts are down, but that is more reflective of low supply than anything else. With a growing economy, solid lending practices and the potential for improved inventory from new listing and building activity, market balance is more likely than a bubble. Condominium Only Year-Over-Year Change Condominium Only Year-Over-Year Change Year-Over-Year Change Condominium Only Year-Over-Year Change Condominium Only 2,299 2,283 Michael Mahoney Realtor eXp Realty Boston 617-615-9435 - www.RealtorMikeMahoney.com
  • 2. Single-Family Market Overview Historical Sparkbars 7-2017 7-2018 + / – YTD 2017 YTD 2018 + / – All data from the Berkshire County Multiple Listing Service, Cape Cod & Islands Association of REALTORS®, Inc. and MLS Property Information Network, Inc. Provided by MAR. Report © 2018 ShowingTime. | 2 + 0.8%New Listings 6,444 6,874 + 6.7% 46,990 47,375 - 14.1% Pct. of Orig. Price Received 98.6% 99.1% + 0.5% 97.5% 98.2% + 0.7% Cumulative Days on Market 51 45 - 11.8% 71 61 -- Final Days on Market 40 34 - 15.0% 56 48 - 14.3% Months Supply 3.5 3.0 - 14.3% -- -- - 12.1% Homes for Sale 16,903 14,332 - 15.2% -- -- -- Affordability Index 102 88 - 13.7% 107 94 30,981 - 1.6% Median Sales Price $395,000 $423,250 + 7.2% $375,000 $399,000 + 6.4% 31,491 Key market metrics for the current month and year-to-date figures for Single-Family Homes Only. Closed Sales 5,956 6,153 + 3.3% Key Metrics select the desired metric to jump to that page 7-2015 7-2016 7-2017 7-2018 7-2015 7-2016 7-2017 7-2018 7-2015 7-2016 7-2017 7-2018 7-2015 7-2016 7-2017 7-2018 7-2015 7-2016 7-2017 7-2018 7-2015 7-2016 7-2017 7-2018 7-2015 7-2016 7-2017 7-2018 7-2015 7-2016 7-2017 7-2018 7-2015 7-2016 7-2017 7-2018
  • 3. Condominium Market Overview Historical Sparkbars 7-2017 7-2018 + / – YTD 2017 YTD 2018 + / –Key Metrics select the desired metric to jump to that page Key market metrics for the current month and year-to-date figures for Condominium Properties Only. 12,494 - 0.0% $384,900 + 9.3% 12,498Closed Sales 2,253 2,283 + 1.3% Median Sales Price $370,000 $398,950 + 7.8% $352,000 Affordability Index 109 94 - 13.8% 114 97 - 14.9% -- -- -- Homes for Sale 4,671 3,721 - 20.3% -- -- Months Supply 2.5 2.0 - 20.0% -- Final Days on Market 36 30 - 16.7% 45 Cumulative Days on Market 46 41 - 10.9% 56 + 0.1% 99.5% 99.9% - 15.6% 49 - 12.5% 38 All data from the Berkshire County Multiple Listing Service, Cape Cod & Islands Association of REALTORS®, Inc. and MLS Property Information Network, Inc. Provided by MAR. Report © 2018 ShowingTime. | 3 + 0.4% New Listings 2,265 2,299 + 1.5% 17,354 17,412 + 0.3% Pct. of Orig. Price Received 100.2% 100.3% 7-2015 7-2016 7-2017 7-2018 7-2015 7-2016 7-2017 7-2018 7-2015 7-2016 7-2017 7-2018 7-2015 7-2016 7-2017 7-2018 7-2015 7-2016 7-2017 7-2018 7-2015 7-2016 7-2017 7-2018 7-2015 7-2016 7-2017 7-2018 7-2015 7-2016 7-2017 7-2018 7-2015 7-2016 7-2017 7-2018
  • 4. Closed Sales Single-Family YoY Change Condominium YoY Change August 2017 6,424 + 0.0% 2,394 + 0.4% September 2017 5,115 - 3.9% 1,929 - 5.0% October 2017 5,041 + 7.9% 1,818 + 8.0% November 2017 5,008 + 2.6% 1,993 + 12.8% December 2017 4,545 - 6.6% 1,699 - 5.0% January 2018 3,466 + 0.3% 1,268 - 3.9% February 2018 2,444 - 4.1% 1,011 + 3.9% March 2018 3,409 - 7.4% 1,488 - 10.1% April 2018 3,851 + 1.3% 1,720 + 15.8% May 2018 4,939 - 2.9% 2,105 - 0.2% June 2018 6,719 - 3.5% 2,619 - 3.1% July 2018 6,153 + 3.3% 2,283 + 1.3% Total 57,114 - 0.9% 22,327 + 0.8% Historical Closed Sales by Month Data is refreshed regularly to capture changes in market activity so figures show All data from the Berkshire County Multiple Listing Service, Cape Cod & Islands Association of REALTORS®, Inc. and MLS Property Information Network, Inc. Provided by MAR. Report © 2018 ShowingTime. | 4 A count of the actual sales that closed in a given month. 0 1,000 2,000 3,000 4,000 5,000 6,000 7,000 1-2003 1-2004 1-2005 1-2006 1-2007 1-2008 1-2009 1-2010 1-2011 1-2012 1-2013 1-2014 1-2015 1-2016 1-2017 1-2018 Single-Family Condominium 5,912 2,139 5,956 2,253 6,153 2,283 Single-Family Condominium July 31,593 12,275 31,491 12,498 30,981 12,494 Single-Family Condominium Year to Date 2016 2017 2018 + 1.3%+ 5.3%+ 3.3%+ 0.7% + 1.8%- 1.6%- 0.3% - 0.0%- 12.3% + 12.0% + 6.9%- 16.2% 2016 2017 2018 2016 2017 2018 2016 2017 2018
  • 5. Median Sales Price Point at which half of the sales sold for more and half sold for less, not accounting for seller concessions, in a given month. Single-Family YoY Change Condominium YoY Change August 2017 $392,000 + 4.5% $349,000 + 1.2% September 2017 $375,000 + 7.1% $350,000 + 4.5% October 2017 $370,000 + 5.4% $339,000 + 4.3% November 2017 $380,000 + 4.1% $369,900 + 8.8% December 2017 $380,000 + 7.1% $359,779 + 5.5% January 2018 $367,250 + 3.5% $355,000 + 6.1% February 2018 $350,000 + 7.0% $357,950 + 13.6% March 2018 $368,250 + 5.2% $395,000 + 17.9% April 2018 $384,700 + 6.9% $378,500 + 9.7% May 2018 $405,000 + 5.8% $385,000 + 4.1% June 2018 $430,000 + 6.7% $393,000 + 8.9% July 2018 $423,250 + 7.2% $398,950 + 7.8% Median $389,900 + 5.7% $369,990 + 7.2% Historical Median Sales Price by Month Data is refreshed regularly to capture changes in market activity so figures show All data from the Berkshire County Multiple Listing Service, Cape Cod & Islands Association of REALTORS®, Inc. and MLS Property Information Network, Inc. Provided by MAR. Report © 2018 ShowingTime. | 5 $376,000 $355,000 $395,000 $370,000 $423,250 $398,950 Single-Family Condominium July $200,000 $250,000 $300,000 $350,000 $400,000 $450,000 1-2003 1-2004 1-2005 1-2006 1-2007 1-2008 1-2009 1-2010 1-2011 1-2012 1-2013 1-2014 1-2015 1-2016 1-2017 1-2018 Single-Family Condominium $352,000 $330,000 $375,000 $352,000 $399,000 $384,900 Single-Family Condominium Year to Date + 7.8%+ 4.2%+ 7.2%+ 5.1% + 6.7%+ 6.4%+ 6.5% + 9.3%+ 3.4% + 2.0% + 2.3%+ 4.4% 2016 2017 2018 2016 2017 2018 2016 2017 2018 2016 2017 2018
  • 6. Housing Affordability Index Single-Family YoY Change Condominium YoY Change August 2017 103 - 7.2% 116 - 3.3% September 2017 108 - 8.5% 116 - 5.7% October 2017 108 - 9.2% 117 - 9.3% November 2017 106 - 2.8% 109 - 6.8% December 2017 105 - 2.8% 111 - 1.8% January 2018 103 - 3.7% 107 - 6.1% February 2018 108 - 9.2% 106 - 14.5% March 2018 102 - 8.1% 96 - 17.2% April 2018 96 - 12.7% 98 - 14.8% May 2018 92 - 12.4% 96 - 11.1% June 2018 87 - 12.1% 95 - 14.4% July 2018 88 - 13.7% 94 - 13.8% Average 101 - 8.5% 105 - 10.0% Historical Housing Affordability Index by Month Data is refreshed re This index measures housing affordability for the region. For example, an index of 120 means the median household income is 120% of what is necessary to qualify for the median-priced home under prevailing interest rates. A higher number means greater affordability. All data from the Berkshire County Multiple Listing Service, Cape Cod & Islands Association of REALTORS®, Inc. and MLS Property Information Network, Inc. Provided by MAR. Report © 2018 ShowingTime. | 6 110 117 102 109 88 94 Single-Family Condominium July 60 80 100 120 140 160 180 1-2003 1-2004 1-2005 1-2006 1-2007 1-2008 1-2009 1-2010 1-2011 1-2012 1-2013 1-2014 1-2015 1-2016 1-2017 1-2018 Single-Family Condominium 118 125 107 114 94 97 Single-Family Condominium Year to Date - 13.8%- 6.8%- 13.7%- 7.3% - 8.8%- 12.1%- 9.3% - 14.9%0.0% + 1.7% + 0.8%0.0% 2016 2017 2018 2016 2017 2018 2016 2017 2018 2016 2017 2018
  • 7. Inventory of Homes for Sale Single-Family YoY Change Condominium YoY Change August 2017 16,775 - 16.7% 4,510 - 11.2% September 2017 17,446 - 15.4% 4,902 - 10.2% October 2017 16,622 - 14.3% 4,651 - 11.2% November 2017 14,706 - 14.5% 4,250 - 10.8% December 2017 11,790 - 15.2% 3,235 - 16.5% January 2018 10,964 - 18.0% 3,190 - 17.9% February 2018 11,091 - 15.5% 3,282 - 15.4% March 2018 11,107 - 19.7% 3,265 - 21.0% April 2018 12,566 - 17.0% 3,875 - 11.1% May 2018 14,523 - 11.7% 4,175 - 10.0% June 2018 15,034 - 10.8% 4,127 - 11.5% July 2018 14,332 - 15.2% 3,721 - 20.3% Average 13,913 - 15.2% 3,932 - 13.7% Historical Inventory of Homes for Sale by Month Data is refreshed regularly to capture changes in market activity so figures show All data from the Berkshire County Multiple Listing Service, Cape Cod & Islands Association of REALTORS®, Inc. and MLS Property Information Network, Inc. Provided by MAR. Report © 2018 ShowingTime. | 7 The number of properties available for sale in an active status at the end of a given month. 20,748 5,357 16,903 4,671 14,332 3,721 Single-Family Condominium July 0 10,000 20,000 30,000 40,000 1-2003 1-2004 1-2005 1-2006 1-2007 1-2008 1-2009 1-2010 1-2011 1-2012 1-2013 1-2014 1-2015 1-2016 1-2017 1-2018 Single-Family Condominium 2016 2017 2018 - 20.3%- 12.8%- 15.2%- 18.5% 2016 2017 2018 - 17.3% - 11.9%
  • 8. Months Supply of Inventory The inventory of homes for sale at the end of a given month, divided by the average monthly pending sales from the last 12 months. Single-Family YoY Change Condominium YoY Change August 2017 3.5 - 16.7% 2.5 - 10.7% September 2017 3.7 - 14.0% 2.7 - 10.0% October 2017 3.5 - 12.5% 2.5 - 13.8% November 2017 3.1 - 13.9% 2.3 - 11.5% December 2017 2.5 - 13.8% 1.7 - 19.0% January 2018 2.3 - 17.9% 1.7 - 19.0% February 2018 2.3 - 14.8% 1.8 - 14.3% March 2018 2.3 - 20.7% 1.8 - 18.2% April 2018 2.6 - 18.8% 2.1 - 12.5% May 2018 3.1 - 11.4% 2.2 - 12.0% June 2018 3.2 - 8.6% 2.2 - 12.0% July 2018 3.0 - 14.3% 2.0 - 20.0% Average 2.9 - 14.9% 2.1 - 15.2% Historical Months Supply of Inventory by Month Data is refreshed regularly to capture changes in market activity so figures show All data from the Berkshire County Multiple Listing Service, Cape Cod & Islands Association of REALTORS®, Inc. and MLS Property Information Network, Inc. Provided by MAR. Report © 2018 ShowingTime. | 8 4.3 3.0 3.5 2.5 3.0 2.0 Single-Family Condominium July 0 2 4 6 8 10 12 14 16 1-2003 1-2004 1-2005 1-2006 1-2007 1-2008 1-2009 1-2010 1-2011 1-2012 1-2013 1-2014 1-2015 1-2016 1-2017 1-2018 Single-Family Condominium 2016 2017 2018 - 20.0%- 16.7%- 14.3%- 18.6% 2016 2017 2018 - 25.9% - 16.7%
  • 9. Final Days on Market Single-Family YoY Change Condominium YoY Change August 2017 44 - 13.7% 38 - 15.6% September 2017 49 - 15.5% 42 - 4.5% October 2017 49 - 18.3% 40 - 18.4% November 2017 53 - 10.2% 39 - 15.2% December 2017 55 - 11.3% 44 - 6.4% January 2018 60 - 10.4% 52 - 13.3% February 2018 68 - 13.9% 50 - 9.1% March 2018 63 - 13.7% 47 - 9.6% April 2018 53 - 19.7% 39 - 17.0% May 2018 46 - 16.4% 37 - 14.0% June 2018 38 - 13.6% 31 - 11.4% July 2018 34 - 15.0% 30 - 16.7% Average 49 - 14.3% 39 - 13.1% Historical Final Days on Market by Month Data is refreshed regularly to capture changes in market activity so figures show Average number of days between when a property is last listed and when the final offer is accepted in a given month. All data from the Berkshire County Multiple Listing Service, Cape Cod & Islands Association of REALTORS®, Inc. and MLS Property Information Network, Inc. Provided by MAR. Report © 2018 ShowingTime. | 9 50 3940 36 34 30 Single-Family Condominium July 20 40 60 80 100 120 140 1-2003 1-2004 1-2005 1-2006 1-2007 1-2008 1-2009 1-2010 1-2011 1-2012 1-2013 1-2014 1-2015 1-2016 1-2017 1-2018 Single-Family Condominium 66 50 56 45 48 38 Single-Family Condominium Year to Date - 16.7%- 7.7%- 15.0%- 20.0% - 10.0%- 14.3%- 15.2% - 15.6%0.0% - 5.7% - 7.4%- 11.4% 2016 2017 2018 2016 2017 2018 2016 2017 2018 2016 2017 2018
  • 10. Cumulative Days on Market Single-Family YoY Change Condominium YoY Change August 2017 55 - 27.6% 47 - 25.4% September 2017 62 - 18.4% 51 - 15.0% October 2017 62 - 19.5% 50 - 16.7% November 2017 66 - 13.2% 48 - 18.6% December 2017 69 - 12.7% 54 - 11.5% January 2018 72 - 12.2% 62 - 15.1% February 2018 84 - 12.5% 63 - 7.4% March 2018 79 - 13.2% 58 - 12.1% April 2018 67 - 19.3% 50 - 18.0% May 2018 59 - 16.9% 47 - 11.3% June 2018 48 - 15.8% 41 - 12.8% July 2018 45 - 11.8% 41 - 10.9% Average 61 - 16.6% 50 - 15.1% Historical Cumulative Days on Market by Month Data is refreshed regularly to capture changes in market activity so figures show Average number of days between when a property is first listed and when the final offer is accepted before closing in a given month. All data from the Berkshire County Multiple Listing Service, Cape Cod & Islands Association of REALTORS®, Inc. and MLS Property Information Network, Inc. Provided by MAR. Report © 2018 ShowingTime. | 10 78 59 51 4645 41 Single-Family Condominium July 40 60 80 100 120 140 160 180 1-2003 1-2004 1-2005 1-2006 1-2007 1-2008 1-2009 1-2010 1-2011 1-2012 1-2013 1-2014 1-2015 1-2016 1-2017 1-2018 Single-Family Condominium 97 7371 56 61 49 Single-Family Condominium Year to Date - 10.9%- 22.0%- 11.8%- 34.6% - 23.3%- 14.1%- 26.8% - 12.5%0.0% - 4.9% - 5.2%- 10.6% 2016 2017 2018 2016 2017 2018 2016 2017 2018 2016 2017 2018
  • 11. Percent of Original List Price Received Single-Family YoY Change Condominium YoY Change August 2017 98.0% + 0.8% 99.4% + 0.3% September 2017 97.3% + 0.9% 99.3% + 0.9% October 2017 97.3% + 1.1% 99.2% + 0.9% November 2017 96.6% + 0.4% 98.8% + 0.6% December 2017 96.1% + 0.4% 98.5% + 1.0% January 2018 96.1% + 0.9% 97.6% + 0.6% February 2018 96.0% + 0.8% 98.6% + 0.9% March 2018 97.1% + 0.7% 99.5% + 0.6% April 2018 98.3% + 1.1% 100.3% + 1.0% May 2018 98.7% + 0.6% 100.7% + 0.5% June 2018 99.2% + 0.5% 100.6% + 0.1% July 2018 99.1% + 0.5% 100.3% + 0.1% Average 97.7% + 0.7% 99.6% + 0.6% Historical Percent of Original List Price Received by Month Data is refreshed regularly to capture changes in market activity so figures show Percentage found when dividing a property’s sales price by its original list price, then taking the average for all properties sold in a given month, not accounting for seller concessions. All data from the Berkshire County Multiple Listing Service, Cape Cod & Islands Association of REALTORS®, Inc. and MLS Property Information Network, Inc. Provided by MAR. Report © 2018 ShowingTime. | 11 97.6% 99.5%98.6% 100.2%99.1% 100.3% Single-Family Condominium July 88% 90% 92% 94% 96% 98% 100% 102% 1-2003 1-2004 1-2005 1-2006 1-2007 1-2008 1-2009 1-2010 1-2011 1-2012 1-2013 1-2014 1-2015 1-2016 1-2017 1-2018 Single-Family Condominium 96.3% 98.7%97.5% 99.5%98.2% 99.9% Single-Family Condominium Year to Date + 0.1%+ 0.7%+ 0.5%+ 1.0% + 0.8%+ 0.7%+ 1.2% + 0.4%+ 0.5% + 0.6% + 0.4%+ 0.4% 2016 2017 2018 2016 2017 2018 2016 2017 2018 2016 2017 2018
  • 12. New Listings Single-Family YoY Change Condominium YoY Change August 2017 6,565 + 2.3% 2,138 + 0.4% September 2017 7,314 - 0.2% 2,704 - 1.8% October 2017 6,025 + 5.9% 2,255 + 6.3% November 2017 4,239 + 4.9% 1,704 + 5.8% December 2017 2,398 - 1.4% 805 - 15.4% January 2018 3,537 - 14.9% 1,554 - 15.1% February 2018 4,671 + 8.0% 1,909 + 11.8% March 2018 5,864 - 18.0% 2,375 - 15.1% April 2018 8,109 + 5.6% 3,164 + 18.7% May 2018 9,894 + 8.5% 3,274 + 2.9% June 2018 8,426 + 3.8% 2,837 - 2.3% July 2018 6,874 + 6.7% 2,299 + 1.5% Total 73,916 + 1.4% 27,018 + 0.4% Historical New Listings by Month Data is refreshed re A count of the properties that have been newly listed on the market in a given month. All data from the Berkshire County Multiple Listing Service, Cape Cod & Islands Association of REALTORS®, Inc. and MLS Property Information Network, Inc. Provided by MAR. Report © 2018 ShowingTime. | 12 6,396 2,305 6,444 2,265 6,874 2,299 Single-Family Condominium July 49,491 17,511 46,990 17,354 47,375 17,412 Single-Family Condominium Year to Date + 1.5%- 1.7%+ 6.7%+ 0.8% - 0.9%+ 0.8%- 5.1% + 0.3%- 14.8% - 2.2% - 0.8%- 4.2% 0 2,000 4,000 6,000 8,000 10,000 12,000 1-2003 1-2004 1-2005 1-2006 1-2007 1-2008 1-2009 1-2010 1-2011 1-2012 1-2013 1-2014 1-2015 1-2016 1-2017 1-2018 Single-Family Condominium 2016 2017 2018 2016 2017 2018 2016 2017 2018 2016 2017 2018
  • 13. Glossary of Terms Closed Sales Median Sales Price Housing Affordability Index Inventory of Homes for Sale Months Supply of Inventory Final Days on Market Until Sale Cumulative Days on Market Until Sale Percent of Original List Price Received New Listings All data from the Berkshire County Multiple Listing Service, Cape Cod & Islands Association of REALTORS®, Inc. and MLS Property Information Network, Inc. Provided by MAR. Report © 2018 ShowingTime. | 13 A measure of the number of homes available for sale at a given time. Once a listing goes pending, sold or is taken off the market, it is no longer considered “active.” The availability of homes for sale has a big effect on supply-demand dynamics and home prices. The inventory of homes for sale (at the end of a given month) divided by the average monthly pending sales from the last 12 months. A measure of how many calendar days pass between when a listing becomes active (not pending) for the last time to the last time it goes pending directly before it is sold. A pending sale is defined as something classified as Pending, Active with a Flag, Contingent or Under Agreement. A measure of the average number of calendar days that pass from when a listing is first listed to when a property goes into the last pending status before it is sold. This is calculated as Total Sold Dollars (all sold prices added together) divided by Total Original Price (all original list prices added together). A measure of how much new supply is coming onto the market from sellers. It is calculated by counting all listings with a list date in the reporting period. A measure of how affordable a region’s housing is to its consumers. A higher number means greater affordability. The index is based on interest rates, median sales price and average income by county. A research tool provided by the Massachusetts Association of REALTORS® A measure of home sales that were closed to completion during the report period. A measure of home values in a market area where 50% of activity was higher and 50% was lower than this price point.