SlideShare a Scribd company logo
1 of 13
Download to read offline
Office: (832) 326-5787
Courtney@CourtneyFoster.com
www.ReferredRealtyMT.com
Courtney Foster
Referred Realty Group
Each data point is one month of activity. Data is from April 5, 2018.
All data from Big Sky Country MLS, a subsidiary of the Gallatin Association of REALTORS®. InfoSparks © 2018 ShowingTime.
March Homes for Sale
Bozeman & Belgrade & Three Forks & Big Sky
0
100
200
300
400
500
2016 2017 2018
418
328
283
-21.5% -13.7%
72
53 54
-26.4% +1.9%
21
34
19
+61.9% -44.1%
257
213
165
-17.1% -22.5%
Bozeman Belgrade Three Forks Big Sky
Office: (832) 326-5787
Courtney@CourtneyFoster.com
www.ReferredRealtyMT.com
Courtney Foster
Referred Realty Group
Each data point is one month of activity. Data is from April 5, 2018.
All data from Big Sky Country MLS, a subsidiary of the Gallatin Association of REALTORS®. InfoSparks © 2018 ShowingTime.
March New Listings
Bozeman & Belgrade & Three Forks & Big Sky
0
50
100
150
200
250
2016 2017 2018
187
178 178
-4.8% 0.0%
44
52 49
+18.2% -5.8%
10 12
6
+20.0% -50.0%
32
41
24
+28.1% -41.5%
Bozeman Belgrade Three Forks Big Sky
Office: (832) 326-5787
Courtney@CourtneyFoster.com
www.ReferredRealtyMT.com
Courtney Foster
Referred Realty Group
Each data point is one month of activity. Data is from April 5, 2018.
All data from Big Sky Country MLS, a subsidiary of the Gallatin Association of REALTORS®. InfoSparks © 2018 ShowingTime.
March Pending Sales
Bozeman & Belgrade & Three Forks & Big Sky
0
50
100
150
200
250
2016 2017 2018
185
149
156
-19.5% +4.7%
36
52 48
+44.4% -7.7%
11 7 7
-36.4% 0.0%
22
31
42
+40.9% +35.5%
Bozeman Belgrade Three Forks Big Sky
Office: (832) 326-5787
Courtney@CourtneyFoster.com
www.ReferredRealtyMT.com
Courtney Foster
Referred Realty Group
Each data point is one month of activity. Data is from April 5, 2018.
All data from Big Sky Country MLS, a subsidiary of the Gallatin Association of REALTORS®. InfoSparks © 2018 ShowingTime.
March Closed Sales
Bozeman & Belgrade & Three Forks & Big Sky
0
20
40
60
80
100
120
140
2016 2017 2018
108
112 111
+3.7% -0.9%
29
39
32
+34.5% -17.9%
2 4 4
+100.0% 0.0%
19
27 27
+42.1% 0.0%
Bozeman Belgrade Three Forks Big Sky
Office: (832) 326-5787
Courtney@CourtneyFoster.com
www.ReferredRealtyMT.com
Courtney Foster
Referred Realty Group
Each data point is activity year to date. Data is from April 6, 2018.
All data from Big Sky Country MLS, a subsidiary of the Gallatin Association of REALTORS®. InfoSparks © 2018 ShowingTime.
March Closed Sales
Bozeman & Belgrade & Three Forks & Big Sky
0
50
100
150
200
250
300
350
2016 2017 2018
269
280 278
+4.1% -0.7%
73
89
77
+21.9% -13.5%
4 5
15
+25.0% +200.0%
48
54 56
+12.5% +3.7%
Bozeman Belgrade Three Forks Big Sky
Office: (832) 326-5787
Courtney@CourtneyFoster.com
www.ReferredRealtyMT.com
Courtney Foster
Referred Realty Group
Each data point is one month of activity. Data is from April 5, 2018.
All data from Big Sky Country MLS, a subsidiary of the Gallatin Association of REALTORS®. InfoSparks © 2018 ShowingTime.
March Average Sales Price
Bozeman & Belgrade & Three Forks & Big Sky
$0
$0.2M
$0.4M
$0.6M
$0.8M
$1.0M
$1.2M
2016 2017 2018
$377,148
$415,179 $424,445
+10.1% +2.2%
$235,366
$274,808
$285,613
+16.8% +3.9%
$240,000
$152,225
$194,625
-36.6% +27.9%
$844,928
$799,107
$978,067
-5.4% +22.4%
Bozeman Belgrade Three Forks Big Sky
Office: (832) 326-5787
Courtney@CourtneyFoster.com
www.ReferredRealtyMT.com
Courtney Foster
Referred Realty Group
Each data point is one month of activity. Data is from April 5, 2018.
All data from Big Sky Country MLS, a subsidiary of the Gallatin Association of REALTORS®. InfoSparks © 2018 ShowingTime.
March Months Supply of Homes for Sale
Bozeman & Belgrade & Three Forks & Big Sky
0.0
5.0
2.5
7.5
10.0
12.5
15.0
17.5
2016 2017 2018
3.2
2.5
2.2
-21.9% -12.0%
2.2
1.4 1.4
-36.4% 0.0%
4.1
5.9
2.6
+43.9% -55.9%
14.0
10.0
6.8
-28.6% -32.0%
Bozeman Belgrade Three Forks Big Sky
Office: (832) 326-5787
Courtney@CourtneyFoster.com
www.ReferredRealtyMT.com
Courtney Foster
Referred Realty Group
Each data point is one month of activity. Data is from April 5, 2018.
All data from Big Sky Country MLS, a subsidiary of the Gallatin Association of REALTORS®. InfoSparks © 2018 ShowingTime.
March Median Days on Market
Bozeman & Belgrade & Three Forks & Big Sky
0
50
25
75
100
125
150
175
2016 2017 2018
57
37
23
-35.1% -37.8%
25 27 27
+8.0% 0.0%
98
129
19
+31.6% -85.3%
152 153
90
+0.7% -41.2%
Bozeman Belgrade Three Forks Big Sky
Office: (832) 326-5787
Courtney@CourtneyFoster.com
www.ReferredRealtyMT.com
Courtney Foster
Referred Realty Group
Each data point is one month of activity. Data is from April 5, 2018.
All data from Big Sky Country MLS, a subsidiary of the Gallatin Association of REALTORS®. InfoSparks © 2018 ShowingTime.
March Median Price Per Square Foot
Bozeman & Belgrade & Three Forks & Big Sky
$0
$100
$200
$300
$400
2016 2017 2018
$164
$174
$198
+6.1% +13.8%
$123
$144
$177
+17.1% +22.9%
$122
$99
$150
-18.9% +51.5%
$262
$319
$351
+21.8% +10.0%
Bozeman Belgrade Three Forks Big Sky
Local Market Update – February 2018
This is a research tool provided by the Big Sky Country MLS
Bozeman City Limits
Single Family February Year to Date
Key Metrics 2017 2018 % Change Thru 2-2017 Thru 2-2018 % Change
New Listings 51 40 - 21.6% 94 91 - 3.2%
Pending Sales 32 47 + 46.9% 71 88 + 23.9%
Closed Sales 17 38 + 123.5% 55 70 + 27.3%
Days on Market Until Sale 104 56 - 46.2% 86 57 - 33.7%
Median Sales Price* $348,400 $456,000 + 30.9% $355,000 $432,475 + 21.8%
Average Sales Price* $425,216 $490,714 + 15.4% $424,754 $478,339 + 12.6%
Percent of List Price Received* 100.1% 99.2% - 0.9% 99.8% 99.3% - 0.5%
Inventory of Homes for Sale 116 85 - 26.7% –– –– ––
Months Supply of Inventory 2.4 1.8 - 25.0% –– –– ––
Condo/Townhouse February Year to Date
Key Metrics 2017 2018 % Change Thru 2-2017 Thru 2-2018 % Change
New Listings 34 29 - 14.7% 82 54 - 34.1%
Pending Sales 29 32 + 10.3% 71 68 - 4.2%
Closed Sales 24 19 - 20.8% 51 45 - 11.8%
Days on Market Until Sale 139 49 - 64.7% 187 50 - 73.3%
Median Sales Price* $267,640 $320,000 + 19.6% $297,000 $293,075 - 1.3%
Average Sales Price* $324,746 $360,923 + 11.1% $368,598 $363,225 - 1.5%
Percent of List Price Received* 100.3% 98.6% - 1.7% 100.0% 99.2% - 0.8%
Inventory of Homes for Sale 54 70 + 29.6% –– –– ––
Months Supply of Inventory 1.4 1.9 + 35.7% –– –– ––
* Does not account for sale concessions and/or downpayment assistance. | Percent changes are calculated using rounded figures and can sometimes look extreme due to small sample size.
A rolling 12-month calculation represents the current month and the 11 months prior in a single data point. If no activity occurred during a month, the line extends to the next available data point.
Median Sales Price - Single Family
Rolling 12-Month Calculation Gallatin County
Bozeman City Limits
1-2003 1-2005 1-2007 1-2009 1-2011 1-2013 1-2015 1-2017
$150,000
$200,000
$250,000
$300,000
$350,000
$400,000
Median Sales Price - Condo
Rolling 12-Month Calculation Gallatin County
Bozeman City Limits
1-2003 1-2005 1-2007 1-2009 1-2011 1-2013 1-2015 1-2017
$100,000
$150,000
$200,000
$250,000
$300,000
Current as of March 10, 2018. All data from Big Sky Country Multiple Listing Service®. Report © 2018 ShowingTime.
Local Market Update – February 2018
This is a research tool provided by the Big Sky Country MLS
Belgrade
Single Family February Year to Date
Key Metrics 2017 2018 % Change Thru 2-2017 Thru 2-2018 % Change
New Listings 26 25 - 3.8% 50 52 + 4.0%
Pending Sales 24 31 + 29.2% 51 52 + 2.0%
Closed Sales 18 23 + 27.8% 36 33 - 8.3%
Days on Market Until Sale 106 65 - 38.7% 80 61 - 23.8%
Median Sales Price* $269,250 $320,000 + 18.8% $262,450 $284,000 + 8.2%
Average Sales Price* $329,639 $389,833 + 18.3% $294,840 $357,292 + 21.2%
Percent of List Price Received* 97.0% 99.4% + 2.5% 98.1% 99.2% + 1.1%
Inventory of Homes for Sale 43 39 - 9.3% –– –– ––
Months Supply of Inventory 1.7 1.3 - 23.5% –– –– ––
Condo/Townhouse February Year to Date
Key Metrics 2017 2018 % Change Thru 2-2017 Thru 2-2018 % Change
New Listings 7 7 0.0% 13 12 - 7.7%
Pending Sales 5 7 + 40.0% 11 14 + 27.3%
Closed Sales 3 2 - 33.3% 6 4 - 33.3%
Days on Market Until Sale 119 19 - 84.0% 62 36 - 41.9%
Median Sales Price* $162,500 $212,500 + 30.8% $156,250 $212,500 + 36.0%
Average Sales Price* $160,833 $212,500 + 32.1% $157,867 $225,125 + 42.6%
Percent of List Price Received* 99.5% 98.1% - 1.4% 100.0% 98.5% - 1.5%
Inventory of Homes for Sale 8 8 0.0% –– –– ––
Months Supply of Inventory 1.1 1.1 0.0% –– –– ––
* Does not account for sale concessions and/or downpayment assistance. | Percent changes are calculated using rounded figures and can sometimes look extreme due to small sample size.
A rolling 12-month calculation represents the current month and the 11 months prior in a single data point. If no activity occurred during a month, the line extends to the next available data point.
Median Sales Price - Single Family
Rolling 12-Month Calculation Gallatin County
Belgrade
1-2003 1-2005 1-2007 1-2009 1-2011 1-2013 1-2015 1-2017
$100,000
$150,000
$200,000
$250,000
$300,000
$350,000
$400,000
Median Sales Price - Condo
Rolling 12-Month Calculation Gallatin County
Belgrade
1-2003 1-2005 1-2007 1-2009 1-2011 1-2013 1-2015 1-2017
$50,000
$100,000
$150,000
$200,000
$250,000
$300,000
Current as of March 10, 2018. All data from Big Sky Country Multiple Listing Service®. Report © 2018 ShowingTime.
Local Market Update – February 2018
This is a research tool provided by the Big Sky Country MLS
Greater Big Sky
Single Family February Year to Date
Key Metrics 2017 2018 % Change Thru 2-2017 Thru 2-2018 % Change
New Listings 10 16 + 60.0% 12 23 + 91.7%
Pending Sales 3 16 + 433.3% 8 22 + 175.0%
Closed Sales 3 5 + 66.7% 4 5 + 25.0%
Days on Market Until Sale 206 201 - 2.4% 200 201 + 0.5%
Median Sales Price* $1,995,000 $1,995,000 0.0% $1,722,500 $1,995,000 + 15.8%
Average Sales Price* $2,148,333 $1,879,332 - 12.5% $1,737,500 $1,879,332 + 8.2%
Percent of List Price Received* 95.7% 99.3% + 3.8% 95.6% 99.3% + 3.9%
Inventory of Homes for Sale 83 67 - 19.3% –– –– ––
Months Supply of Inventory 15.2 8.7 - 42.8% –– –– ––
Condo/Townhouse February Year to Date
Key Metrics 2017 2018 % Change Thru 2-2017 Thru 2-2018 % Change
New Listings 19 11 - 42.1% 27 34 + 25.9%
Pending Sales 17 20 + 17.6% 37 38 + 2.7%
Closed Sales 14 9 - 35.7% 21 21 0.0%
Days on Market Until Sale 158 121 - 23.4% 171 104 - 39.2%
Median Sales Price* $367,500 $290,000 - 21.1% $365,000 $300,000 - 17.8%
Average Sales Price* $414,068 $371,056 - 10.4% $390,140 $383,286 - 1.8%
Percent of List Price Received* 96.3% 96.9% + 0.6% 95.3% 96.4% + 1.2%
Inventory of Homes for Sale 104 112 + 7.7% –– –– ––
Months Supply of Inventory 7.1 7.8 + 9.9% –– –– ––
* Does not account for sale concessions and/or downpayment assistance. | Percent changes are calculated using rounded figures and can sometimes look extreme due to small sample size.
A rolling 12-month calculation represents the current month and the 11 months prior in a single data point. If no activity occurred during a month, the line extends to the next available data point.
Median Sales Price - Single Family
Rolling 12-Month Calculation Gallatin County
Greater Big Sky
1-2003 1-2005 1-2007 1-2009 1-2011 1-2013 1-2015 1-2017
$0
$500,000
$1,000,000
$1,500,000
$2,000,000
Median Sales Price - Condo
Rolling 12-Month Calculation Gallatin County
Greater Big Sky
1-2003 1-2005 1-2007 1-2009 1-2011 1-2013 1-2015 1-2017
$0
$100,000
$200,000
$300,000
$400,000
$500,000
$600,000
Current as of March 10, 2018. All data from Big Sky Country Multiple Listing Service®. Report © 2018 ShowingTime.
Local Market Update – February 2018
This is a research tool provided by the Big Sky Country MLS
Livingston City Limits
Single Family February Year to Date
Key Metrics 2017 2018 % Change Thru 2-2017 Thru 2-2018 % Change
New Listings 14 5 - 64.3% 21 14 - 33.3%
Pending Sales 15 6 - 60.0% 28 12 - 57.1%
Closed Sales 8 1 - 87.5% 14 10 - 28.6%
Days on Market Until Sale 85 0 - 100.0% 78 31 - 60.3%
Median Sales Price* $252,250 $265,000 + 5.1% $209,000 $246,600 + 18.0%
Average Sales Price* $256,416 $265,000 + 3.3% $226,359 $243,020 + 7.4%
Percent of List Price Received* 97.6% 98.5% + 0.9% 97.0% 94.4% - 2.7%
Inventory of Homes for Sale 29 23 - 20.7% –– –– ––
Months Supply of Inventory 2.4 1.9 - 20.8% –– –– ––
Condo/Townhouse February Year to Date
Key Metrics 2017 2018 % Change Thru 2-2017 Thru 2-2018 % Change
New Listings 1 2 + 100.0% 1 5 + 400.0%
Pending Sales 0 3 –– 0 6 ––
Closed Sales 0 3 –– 1 5 + 400.0%
Days on Market Until Sale –– 84 –– 76 51 - 32.9%
Median Sales Price* –– $205,000 –– $148,000 $211,000 + 42.6%
Average Sales Price* –– $197,000 –– $148,000 $205,400 + 38.8%
Percent of List Price Received* –– 92.5% –– 96.7% 95.5% - 1.2%
Inventory of Homes for Sale 7 5 - 28.6% –– –– ––
Months Supply of Inventory 4.2 1.6 - 61.9% –– –– ––
* Does not account for sale concessions and/or downpayment assistance. | Percent changes are calculated using rounded figures and can sometimes look extreme due to small sample size.
A rolling 12-month calculation represents the current month and the 11 months prior in a single data point. If no activity occurred during a month, the line extends to the next available data point.
Median Sales Price - Single Family
Rolling 12-Month Calculation Gallatin County
Livingston City Limits
1-2003 1-2005 1-2007 1-2009 1-2011 1-2013 1-2015 1-2017
$50,000
$100,000
$150,000
$200,000
$250,000
$300,000
$350,000
$400,000
Median Sales Price - Condo
Rolling 12-Month Calculation Gallatin County
Livingston City Limits
1-2003 1-2005 1-2007 1-2009 1-2011 1-2013 1-2015 1-2017
$50,000
$100,000
$150,000
$200,000
$250,000
$300,000
Current as of March 10, 2018. All data from Big Sky Country Multiple Listing Service®. Report © 2018 ShowingTime.

More Related Content

What's hot

June 2018 Gallatin Valley Market Reports
June 2018 Gallatin Valley Market ReportsJune 2018 Gallatin Valley Market Reports
June 2018 Gallatin Valley Market ReportsReferred Realty Group
 
August 2019 Market Reports for Bozeman
August 2019 Market Reports for BozemanAugust 2019 Market Reports for Bozeman
August 2019 Market Reports for BozemanReferred Realty Group
 
May 2019 Gallatin Valley Market Reports
May 2019 Gallatin Valley Market ReportsMay 2019 Gallatin Valley Market Reports
May 2019 Gallatin Valley Market ReportsReferred Realty Group
 
April 2019 Market Reports for the Gallatin Valley
April 2019 Market Reports for the Gallatin ValleyApril 2019 Market Reports for the Gallatin Valley
April 2019 Market Reports for the Gallatin ValleyReferred Realty Group
 
Bozeman and Surrounding Communities June 2019 Market Report
Bozeman and Surrounding Communities June 2019 Market ReportBozeman and Surrounding Communities June 2019 Market Report
Bozeman and Surrounding Communities June 2019 Market ReportReferred Realty Group
 
Feb 2019 Market Reports for the Bozeman Area
Feb 2019 Market Reports for the Bozeman AreaFeb 2019 Market Reports for the Bozeman Area
Feb 2019 Market Reports for the Bozeman AreaReferred Realty Group
 
#HomeSalesShow Nov 2017 Market Reports
#HomeSalesShow Nov 2017 Market Reports#HomeSalesShow Nov 2017 Market Reports
#HomeSalesShow Nov 2017 Market ReportsReferred Realty Group
 
Jan 2019 Gallatin Valley Market Reports
Jan 2019 Gallatin Valley Market ReportsJan 2019 Gallatin Valley Market Reports
Jan 2019 Gallatin Valley Market ReportsReferred Realty Group
 
San Francisco Market Focus Report November 2018
San Francisco Market Focus Report November 2018San Francisco Market Focus Report November 2018
San Francisco Market Focus Report November 2018Ronny Budiutama
 
July 2019 Gallatin Valley Market Reports
July 2019 Gallatin Valley Market ReportsJuly 2019 Gallatin Valley Market Reports
July 2019 Gallatin Valley Market ReportsReferred Realty Group
 
San Francisco Market Focus April 2018
San Francisco Market Focus April 2018San Francisco Market Focus April 2018
San Francisco Market Focus April 2018Ronny Budiutama
 
Massachusetts statewide closed sales for condos and single family homes
Massachusetts statewide closed sales for condos and single family homesMassachusetts statewide closed sales for condos and single family homes
Massachusetts statewide closed sales for condos and single family homesMichael Mahoney
 
San Francisco Market Focus Report September 2018
San Francisco Market Focus Report September 2018San Francisco Market Focus Report September 2018
San Francisco Market Focus Report September 2018Ronny Budiutama
 
San Francisco Market Focus Report October 2018
San Francisco Market Focus Report October 2018San Francisco Market Focus Report October 2018
San Francisco Market Focus Report October 2018Ronny Budiutama
 
San Francisco Market Focus Report Aug 2018
San Francisco Market Focus Report Aug 2018San Francisco Market Focus Report Aug 2018
San Francisco Market Focus Report Aug 2018Ronny Budiutama
 
Georgia Housing Market Snapshot For September 2018
Georgia Housing Market Snapshot For September 2018Georgia Housing Market Snapshot For September 2018
Georgia Housing Market Snapshot For September 2018Arthur Prescott
 

What's hot (20)

June 2018 Gallatin Valley Market Reports
June 2018 Gallatin Valley Market ReportsJune 2018 Gallatin Valley Market Reports
June 2018 Gallatin Valley Market Reports
 
March 2019 Market Report
March 2019 Market ReportMarch 2019 Market Report
March 2019 Market Report
 
August 2019 Market Reports for Bozeman
August 2019 Market Reports for BozemanAugust 2019 Market Reports for Bozeman
August 2019 Market Reports for Bozeman
 
May 2019 Gallatin Valley Market Reports
May 2019 Gallatin Valley Market ReportsMay 2019 Gallatin Valley Market Reports
May 2019 Gallatin Valley Market Reports
 
April 2019 Market Reports for the Gallatin Valley
April 2019 Market Reports for the Gallatin ValleyApril 2019 Market Reports for the Gallatin Valley
April 2019 Market Reports for the Gallatin Valley
 
Bozeman and Surrounding Communities June 2019 Market Report
Bozeman and Surrounding Communities June 2019 Market ReportBozeman and Surrounding Communities June 2019 Market Report
Bozeman and Surrounding Communities June 2019 Market Report
 
Feb 2019 Market Reports for the Bozeman Area
Feb 2019 Market Reports for the Bozeman AreaFeb 2019 Market Reports for the Bozeman Area
Feb 2019 Market Reports for the Bozeman Area
 
#HomeSalesShow Nov 2017 Market Reports
#HomeSalesShow Nov 2017 Market Reports#HomeSalesShow Nov 2017 Market Reports
#HomeSalesShow Nov 2017 Market Reports
 
Oct 2019 Market Reports
Oct 2019 Market ReportsOct 2019 Market Reports
Oct 2019 Market Reports
 
Jan 2019 Gallatin Valley Market Reports
Jan 2019 Gallatin Valley Market ReportsJan 2019 Gallatin Valley Market Reports
Jan 2019 Gallatin Valley Market Reports
 
San Francisco Market Focus Report November 2018
San Francisco Market Focus Report November 2018San Francisco Market Focus Report November 2018
San Francisco Market Focus Report November 2018
 
July 2019 Gallatin Valley Market Reports
July 2019 Gallatin Valley Market ReportsJuly 2019 Gallatin Valley Market Reports
July 2019 Gallatin Valley Market Reports
 
San Francisco Market Focus April 2018
San Francisco Market Focus April 2018San Francisco Market Focus April 2018
San Francisco Market Focus April 2018
 
Massachusetts statewide closed sales for condos and single family homes
Massachusetts statewide closed sales for condos and single family homesMassachusetts statewide closed sales for condos and single family homes
Massachusetts statewide closed sales for condos and single family homes
 
San Francisco Market Focus Report September 2018
San Francisco Market Focus Report September 2018San Francisco Market Focus Report September 2018
San Francisco Market Focus Report September 2018
 
September 2019 Market Reports
September 2019 Market ReportsSeptember 2019 Market Reports
September 2019 Market Reports
 
March 2020 Market Data
March 2020 Market DataMarch 2020 Market Data
March 2020 Market Data
 
San Francisco Market Focus Report October 2018
San Francisco Market Focus Report October 2018San Francisco Market Focus Report October 2018
San Francisco Market Focus Report October 2018
 
San Francisco Market Focus Report Aug 2018
San Francisco Market Focus Report Aug 2018San Francisco Market Focus Report Aug 2018
San Francisco Market Focus Report Aug 2018
 
Georgia Housing Market Snapshot For September 2018
Georgia Housing Market Snapshot For September 2018Georgia Housing Market Snapshot For September 2018
Georgia Housing Market Snapshot For September 2018
 

Similar to March 2018 Market Reports for the Gallatin Valley

#HomeSalesShow Oct 2017 market reports
#HomeSalesShow Oct 2017 market reports#HomeSalesShow Oct 2017 market reports
#HomeSalesShow Oct 2017 market reportsReferred Realty Group
 
San Francisco Market Focus Report May
San Francisco Market Focus Report MaySan Francisco Market Focus Report May
San Francisco Market Focus Report MayRonny Budiutama
 
San Francisco Market Report February 2023
San Francisco Market Report February 2023San Francisco Market Report February 2023
San Francisco Market Report February 2023Ronny Budiutama
 
Georgia Housing Market Snapshot For October 2018
Georgia Housing Market Snapshot For October 2018Georgia Housing Market Snapshot For October 2018
Georgia Housing Market Snapshot For October 2018Arthur Prescott
 
San Francisco Market Report March 2023.pdf
San Francisco Market Report March 2023.pdfSan Francisco Market Report March 2023.pdf
San Francisco Market Report March 2023.pdfRonny Budiutama
 
San Francisco Market Report March 2022
San Francisco Market Report March 2022San Francisco Market Report March 2022
San Francisco Market Report March 2022Ronny Budiutama
 
San Francisco Market Report January 2023.pdf
San Francisco Market Report January 2023.pdfSan Francisco Market Report January 2023.pdf
San Francisco Market Report January 2023.pdfRonny Budiutama
 
San Francisco Market Report October 2022.pdf
San Francisco Market Report October 2022.pdfSan Francisco Market Report October 2022.pdf
San Francisco Market Report October 2022.pdfRonny Budiutama
 
San Francisco Market Report August 2021
San Francisco Market Report August 2021San Francisco Market Report August 2021
San Francisco Market Report August 2021Ronny Budiutama
 
San Francisco November 2023 Market Report
San Francisco November 2023 Market ReportSan Francisco November 2023 Market Report
San Francisco November 2023 Market ReportRonny Budiutama
 
Charlotte region -monthly indicators - feb 2018
Charlotte region -monthly indicators - feb 2018Charlotte region -monthly indicators - feb 2018
Charlotte region -monthly indicators - feb 2018Scott Browder
 
San Francisco market focus report December 2019
San Francisco market focus report December 2019San Francisco market focus report December 2019
San Francisco market focus report December 2019Ronny Budiutama
 

Similar to March 2018 Market Reports for the Gallatin Valley (12)

#HomeSalesShow Oct 2017 market reports
#HomeSalesShow Oct 2017 market reports#HomeSalesShow Oct 2017 market reports
#HomeSalesShow Oct 2017 market reports
 
San Francisco Market Focus Report May
San Francisco Market Focus Report MaySan Francisco Market Focus Report May
San Francisco Market Focus Report May
 
San Francisco Market Report February 2023
San Francisco Market Report February 2023San Francisco Market Report February 2023
San Francisco Market Report February 2023
 
Georgia Housing Market Snapshot For October 2018
Georgia Housing Market Snapshot For October 2018Georgia Housing Market Snapshot For October 2018
Georgia Housing Market Snapshot For October 2018
 
San Francisco Market Report March 2023.pdf
San Francisco Market Report March 2023.pdfSan Francisco Market Report March 2023.pdf
San Francisco Market Report March 2023.pdf
 
San Francisco Market Report March 2022
San Francisco Market Report March 2022San Francisco Market Report March 2022
San Francisco Market Report March 2022
 
San Francisco Market Report January 2023.pdf
San Francisco Market Report January 2023.pdfSan Francisco Market Report January 2023.pdf
San Francisco Market Report January 2023.pdf
 
San Francisco Market Report October 2022.pdf
San Francisco Market Report October 2022.pdfSan Francisco Market Report October 2022.pdf
San Francisco Market Report October 2022.pdf
 
San Francisco Market Report August 2021
San Francisco Market Report August 2021San Francisco Market Report August 2021
San Francisco Market Report August 2021
 
San Francisco November 2023 Market Report
San Francisco November 2023 Market ReportSan Francisco November 2023 Market Report
San Francisco November 2023 Market Report
 
Charlotte region -monthly indicators - feb 2018
Charlotte region -monthly indicators - feb 2018Charlotte region -monthly indicators - feb 2018
Charlotte region -monthly indicators - feb 2018
 
San Francisco market focus report December 2019
San Francisco market focus report December 2019San Francisco market focus report December 2019
San Francisco market focus report December 2019
 

More from Referred Realty Group

Bozeman March 2022 Real Estate Market Report
Bozeman March 2022 Real Estate Market ReportBozeman March 2022 Real Estate Market Report
Bozeman March 2022 Real Estate Market ReportReferred Realty Group
 
Feb 2022 Market Report for Bozeman, MT
Feb 2022 Market Report for Bozeman, MTFeb 2022 Market Report for Bozeman, MT
Feb 2022 Market Report for Bozeman, MTReferred Realty Group
 
January 2022 Bozeman real estate stats
January 2022 Bozeman real estate statsJanuary 2022 Bozeman real estate stats
January 2022 Bozeman real estate statsReferred Realty Group
 
December and Year End 2018 Sales Data
December and Year End 2018 Sales DataDecember and Year End 2018 Sales Data
December and Year End 2018 Sales DataReferred Realty Group
 
November 2018 Real Estate Update, The Woodlands, TX
November 2018 Real Estate Update, The Woodlands, TXNovember 2018 Real Estate Update, The Woodlands, TX
November 2018 Real Estate Update, The Woodlands, TXReferred Realty Group
 
October 2018 Real Estate Update for The Woodlands, Texas
October 2018 Real Estate Update for The Woodlands, TexasOctober 2018 Real Estate Update for The Woodlands, Texas
October 2018 Real Estate Update for The Woodlands, TexasReferred Realty Group
 
September 2018 Real Estate Update, The Woodlands, Texas
September 2018 Real Estate Update, The Woodlands, TexasSeptember 2018 Real Estate Update, The Woodlands, Texas
September 2018 Real Estate Update, The Woodlands, TexasReferred Realty Group
 
August 2018 Real Estate Update for The Woodlands, Texas
August 2018 Real Estate Update for The Woodlands, TexasAugust 2018 Real Estate Update for The Woodlands, Texas
August 2018 Real Estate Update for The Woodlands, TexasReferred Realty Group
 
July 2018 Real Estate Update for The Woodlands, Texas
July 2018 Real Estate Update for The Woodlands, TexasJuly 2018 Real Estate Update for The Woodlands, Texas
July 2018 Real Estate Update for The Woodlands, TexasReferred Realty Group
 
May 2018 Real Estate Update for The Woodlands, Texas
May 2018 Real Estate Update for The Woodlands, TexasMay 2018 Real Estate Update for The Woodlands, Texas
May 2018 Real Estate Update for The Woodlands, TexasReferred Realty Group
 

More from Referred Realty Group (12)

Apr 22 Market Reports
Apr 22 Market ReportsApr 22 Market Reports
Apr 22 Market Reports
 
Bozeman March 2022 Real Estate Market Report
Bozeman March 2022 Real Estate Market ReportBozeman March 2022 Real Estate Market Report
Bozeman March 2022 Real Estate Market Report
 
Feb 2022 Market Report for Bozeman, MT
Feb 2022 Market Report for Bozeman, MTFeb 2022 Market Report for Bozeman, MT
Feb 2022 Market Report for Bozeman, MT
 
January 2022 Bozeman real estate stats
January 2022 Bozeman real estate statsJanuary 2022 Bozeman real estate stats
January 2022 Bozeman real estate stats
 
December and Year End 2018 Sales Data
December and Year End 2018 Sales DataDecember and Year End 2018 Sales Data
December and Year End 2018 Sales Data
 
November 2018 Real Estate Update, The Woodlands, TX
November 2018 Real Estate Update, The Woodlands, TXNovember 2018 Real Estate Update, The Woodlands, TX
November 2018 Real Estate Update, The Woodlands, TX
 
October 2018 Real Estate Update for The Woodlands, Texas
October 2018 Real Estate Update for The Woodlands, TexasOctober 2018 Real Estate Update for The Woodlands, Texas
October 2018 Real Estate Update for The Woodlands, Texas
 
September 2018 Real Estate Update, The Woodlands, Texas
September 2018 Real Estate Update, The Woodlands, TexasSeptember 2018 Real Estate Update, The Woodlands, Texas
September 2018 Real Estate Update, The Woodlands, Texas
 
August 2018 Real Estate Update for The Woodlands, Texas
August 2018 Real Estate Update for The Woodlands, TexasAugust 2018 Real Estate Update for The Woodlands, Texas
August 2018 Real Estate Update for The Woodlands, Texas
 
July 2018 Real Estate Update for The Woodlands, Texas
July 2018 Real Estate Update for The Woodlands, TexasJuly 2018 Real Estate Update for The Woodlands, Texas
July 2018 Real Estate Update for The Woodlands, Texas
 
May 2018 Real Estate Update for The Woodlands, Texas
May 2018 Real Estate Update for The Woodlands, TexasMay 2018 Real Estate Update for The Woodlands, Texas
May 2018 Real Estate Update for The Woodlands, Texas
 
April 2018 Real Estate Update
April 2018 Real Estate UpdateApril 2018 Real Estate Update
April 2018 Real Estate Update
 

Recently uploaded

Majestique Viman Nagar Pune Brochure.pdf
Majestique Viman Nagar Pune Brochure.pdfMajestique Viman Nagar Pune Brochure.pdf
Majestique Viman Nagar Pune Brochure.pdfBabyrudram
 
Purva Soukhyam in Guduvancheri Chennai.pdf
Purva Soukhyam in Guduvancheri Chennai.pdfPurva Soukhyam in Guduvancheri Chennai.pdf
Purva Soukhyam in Guduvancheri Chennai.pdfpritika141199
 
Call Girls In Mayur Vihar Delhi ☆↫8447779280 ❤Escorts Service In Delhi
Call Girls In Mayur Vihar Delhi ☆↫8447779280 ❤Escorts Service In DelhiCall Girls In Mayur Vihar Delhi ☆↫8447779280 ❤Escorts Service In Delhi
Call Girls In Mayur Vihar Delhi ☆↫8447779280 ❤Escorts Service In Delhiasmaqueen5
 
9990771857 Call Girls in Dwarka Sector 1 Delhi (Call Girls) Delhi
9990771857 Call Girls in Dwarka Sector 1 Delhi (Call Girls) Delhi9990771857 Call Girls in Dwarka Sector 1 Delhi (Call Girls) Delhi
9990771857 Call Girls in Dwarka Sector 1 Delhi (Call Girls) Delhidelhimodel235
 
9990771857 Call Girls in Dwarka Sector 2 Delhi (Call Girls) Delhi
9990771857 Call Girls in Dwarka Sector 2 Delhi (Call Girls) Delhi9990771857 Call Girls in Dwarka Sector 2 Delhi (Call Girls) Delhi
9990771857 Call Girls in Dwarka Sector 2 Delhi (Call Girls) Delhidelhimodel235
 
Magarpatta Nova Elegance Mundhwa Pune E-Brochure.pdf
Magarpatta Nova Elegance Mundhwa Pune  E-Brochure.pdfMagarpatta Nova Elegance Mundhwa Pune  E-Brochure.pdf
Magarpatta Nova Elegance Mundhwa Pune E-Brochure.pdfManishSaxena95
 
Shapoorji Pallonji Joyville Vista Pune | Spend Your Family Time Together
Shapoorji Pallonji Joyville Vista Pune | Spend Your Family Time TogetherShapoorji Pallonji Joyville Vista Pune | Spend Your Family Time Together
Shapoorji Pallonji Joyville Vista Pune | Spend Your Family Time Togetheraidasheikh47
 
Call Girls in shastri nagar Delhi 8264348440 ✅ call girls ❤️
Call Girls in shastri nagar Delhi 8264348440 ✅ call girls ❤️Call Girls in shastri nagar Delhi 8264348440 ✅ call girls ❤️
Call Girls in shastri nagar Delhi 8264348440 ✅ call girls ❤️soniya singh
 
9990771857 Call Girls in Dwarka Sector 137 Noida (Call Girls) Delhi
9990771857 Call Girls in Dwarka Sector 137 Noida (Call Girls) Delhi9990771857 Call Girls in Dwarka Sector 137 Noida (Call Girls) Delhi
9990771857 Call Girls in Dwarka Sector 137 Noida (Call Girls) Delhidelhimodel235
 
9990771857 Call Girls in Dwarka Sector 3 Delhi (Call Girls) Delhi
9990771857 Call Girls in Dwarka Sector 3 Delhi (Call Girls) Delhi9990771857 Call Girls in Dwarka Sector 3 Delhi (Call Girls) Delhi
9990771857 Call Girls in Dwarka Sector 3 Delhi (Call Girls) Delhidelhimodel235
 
2k Shot Call girls Karol Bagh Delhi 9205541914
2k Shot Call girls Karol Bagh Delhi 92055419142k Shot Call girls Karol Bagh Delhi 9205541914
2k Shot Call girls Karol Bagh Delhi 9205541914Delhi Call girls
 
Call girls in new Ashok NagarDelhi꧁ 8447779280꧂ Escort Service Women Seeking ...
Call girls in new Ashok NagarDelhi꧁ 8447779280꧂ Escort Service Women Seeking ...Call girls in new Ashok NagarDelhi꧁ 8447779280꧂ Escort Service Women Seeking ...
Call girls in new Ashok NagarDelhi꧁ 8447779280꧂ Escort Service Women Seeking ...asmaqueen5
 
Maha Mauka Squarefeet Brochure |Maha Mauka Squarefeet PDF Brochure|
Maha Mauka Squarefeet Brochure |Maha Mauka Squarefeet PDF Brochure|Maha Mauka Squarefeet Brochure |Maha Mauka Squarefeet PDF Brochure|
Maha Mauka Squarefeet Brochure |Maha Mauka Squarefeet PDF Brochure|AkshayJoshi575980
 
Premium Villa Projects in Sarjapur Road Bengaluru
Premium Villa Projects in Sarjapur Road BengaluruPremium Villa Projects in Sarjapur Road Bengaluru
Premium Villa Projects in Sarjapur Road BengaluruShivaSeo3
 
Kohinoor Hinjewadi Phase 2 Pune E-Brochure.pdf
Kohinoor Hinjewadi Phase 2 Pune  E-Brochure.pdfKohinoor Hinjewadi Phase 2 Pune  E-Brochure.pdf
Kohinoor Hinjewadi Phase 2 Pune E-Brochure.pdfManishSaxena95
 
TENANT SCREENING REPORT SERVICES​ How Tenant Screening Reports Work
TENANT SCREENING REPORT SERVICES​ How Tenant Screening Reports WorkTENANT SCREENING REPORT SERVICES​ How Tenant Screening Reports Work
TENANT SCREENING REPORT SERVICES​ How Tenant Screening Reports WorkTurbo Tenant
 
Call Girls In Vasant Vihar Delhi 💯Call Us 🔝8264348440🔝
Call Girls In Vasant Vihar Delhi 💯Call Us 🔝8264348440🔝Call Girls In Vasant Vihar Delhi 💯Call Us 🔝8264348440🔝
Call Girls In Vasant Vihar Delhi 💯Call Us 🔝8264348440🔝soniya singh
 
Listing Turkey Sylvana Istanbul - Bahcesehir
Listing Turkey Sylvana Istanbul - BahcesehirListing Turkey Sylvana Istanbul - Bahcesehir
Listing Turkey Sylvana Istanbul - BahcesehirListing Turkey
 
BDSM⚡Call Girls in Sector 57 Noida Escorts >༒8448380779 Escort Service
BDSM⚡Call Girls in Sector 57 Noida Escorts >༒8448380779 Escort ServiceBDSM⚡Call Girls in Sector 57 Noida Escorts >༒8448380779 Escort Service
BDSM⚡Call Girls in Sector 57 Noida Escorts >༒8448380779 Escort ServiceDelhi Call girls
 
Low Rate ↬Call Girls in Trilokpuri Delhi ↫8447779280}Escorts Service In Delhi
Low Rate ↬Call Girls in Trilokpuri Delhi ↫8447779280}Escorts Service In DelhiLow Rate ↬Call Girls in Trilokpuri Delhi ↫8447779280}Escorts Service In Delhi
Low Rate ↬Call Girls in Trilokpuri Delhi ↫8447779280}Escorts Service In Delhiasmaqueen5
 

Recently uploaded (20)

Majestique Viman Nagar Pune Brochure.pdf
Majestique Viman Nagar Pune Brochure.pdfMajestique Viman Nagar Pune Brochure.pdf
Majestique Viman Nagar Pune Brochure.pdf
 
Purva Soukhyam in Guduvancheri Chennai.pdf
Purva Soukhyam in Guduvancheri Chennai.pdfPurva Soukhyam in Guduvancheri Chennai.pdf
Purva Soukhyam in Guduvancheri Chennai.pdf
 
Call Girls In Mayur Vihar Delhi ☆↫8447779280 ❤Escorts Service In Delhi
Call Girls In Mayur Vihar Delhi ☆↫8447779280 ❤Escorts Service In DelhiCall Girls In Mayur Vihar Delhi ☆↫8447779280 ❤Escorts Service In Delhi
Call Girls In Mayur Vihar Delhi ☆↫8447779280 ❤Escorts Service In Delhi
 
9990771857 Call Girls in Dwarka Sector 1 Delhi (Call Girls) Delhi
9990771857 Call Girls in Dwarka Sector 1 Delhi (Call Girls) Delhi9990771857 Call Girls in Dwarka Sector 1 Delhi (Call Girls) Delhi
9990771857 Call Girls in Dwarka Sector 1 Delhi (Call Girls) Delhi
 
9990771857 Call Girls in Dwarka Sector 2 Delhi (Call Girls) Delhi
9990771857 Call Girls in Dwarka Sector 2 Delhi (Call Girls) Delhi9990771857 Call Girls in Dwarka Sector 2 Delhi (Call Girls) Delhi
9990771857 Call Girls in Dwarka Sector 2 Delhi (Call Girls) Delhi
 
Magarpatta Nova Elegance Mundhwa Pune E-Brochure.pdf
Magarpatta Nova Elegance Mundhwa Pune  E-Brochure.pdfMagarpatta Nova Elegance Mundhwa Pune  E-Brochure.pdf
Magarpatta Nova Elegance Mundhwa Pune E-Brochure.pdf
 
Shapoorji Pallonji Joyville Vista Pune | Spend Your Family Time Together
Shapoorji Pallonji Joyville Vista Pune | Spend Your Family Time TogetherShapoorji Pallonji Joyville Vista Pune | Spend Your Family Time Together
Shapoorji Pallonji Joyville Vista Pune | Spend Your Family Time Together
 
Call Girls in shastri nagar Delhi 8264348440 ✅ call girls ❤️
Call Girls in shastri nagar Delhi 8264348440 ✅ call girls ❤️Call Girls in shastri nagar Delhi 8264348440 ✅ call girls ❤️
Call Girls in shastri nagar Delhi 8264348440 ✅ call girls ❤️
 
9990771857 Call Girls in Dwarka Sector 137 Noida (Call Girls) Delhi
9990771857 Call Girls in Dwarka Sector 137 Noida (Call Girls) Delhi9990771857 Call Girls in Dwarka Sector 137 Noida (Call Girls) Delhi
9990771857 Call Girls in Dwarka Sector 137 Noida (Call Girls) Delhi
 
9990771857 Call Girls in Dwarka Sector 3 Delhi (Call Girls) Delhi
9990771857 Call Girls in Dwarka Sector 3 Delhi (Call Girls) Delhi9990771857 Call Girls in Dwarka Sector 3 Delhi (Call Girls) Delhi
9990771857 Call Girls in Dwarka Sector 3 Delhi (Call Girls) Delhi
 
2k Shot Call girls Karol Bagh Delhi 9205541914
2k Shot Call girls Karol Bagh Delhi 92055419142k Shot Call girls Karol Bagh Delhi 9205541914
2k Shot Call girls Karol Bagh Delhi 9205541914
 
Call girls in new Ashok NagarDelhi꧁ 8447779280꧂ Escort Service Women Seeking ...
Call girls in new Ashok NagarDelhi꧁ 8447779280꧂ Escort Service Women Seeking ...Call girls in new Ashok NagarDelhi꧁ 8447779280꧂ Escort Service Women Seeking ...
Call girls in new Ashok NagarDelhi꧁ 8447779280꧂ Escort Service Women Seeking ...
 
Maha Mauka Squarefeet Brochure |Maha Mauka Squarefeet PDF Brochure|
Maha Mauka Squarefeet Brochure |Maha Mauka Squarefeet PDF Brochure|Maha Mauka Squarefeet Brochure |Maha Mauka Squarefeet PDF Brochure|
Maha Mauka Squarefeet Brochure |Maha Mauka Squarefeet PDF Brochure|
 
Premium Villa Projects in Sarjapur Road Bengaluru
Premium Villa Projects in Sarjapur Road BengaluruPremium Villa Projects in Sarjapur Road Bengaluru
Premium Villa Projects in Sarjapur Road Bengaluru
 
Kohinoor Hinjewadi Phase 2 Pune E-Brochure.pdf
Kohinoor Hinjewadi Phase 2 Pune  E-Brochure.pdfKohinoor Hinjewadi Phase 2 Pune  E-Brochure.pdf
Kohinoor Hinjewadi Phase 2 Pune E-Brochure.pdf
 
TENANT SCREENING REPORT SERVICES​ How Tenant Screening Reports Work
TENANT SCREENING REPORT SERVICES​ How Tenant Screening Reports WorkTENANT SCREENING REPORT SERVICES​ How Tenant Screening Reports Work
TENANT SCREENING REPORT SERVICES​ How Tenant Screening Reports Work
 
Call Girls In Vasant Vihar Delhi 💯Call Us 🔝8264348440🔝
Call Girls In Vasant Vihar Delhi 💯Call Us 🔝8264348440🔝Call Girls In Vasant Vihar Delhi 💯Call Us 🔝8264348440🔝
Call Girls In Vasant Vihar Delhi 💯Call Us 🔝8264348440🔝
 
Listing Turkey Sylvana Istanbul - Bahcesehir
Listing Turkey Sylvana Istanbul - BahcesehirListing Turkey Sylvana Istanbul - Bahcesehir
Listing Turkey Sylvana Istanbul - Bahcesehir
 
BDSM⚡Call Girls in Sector 57 Noida Escorts >༒8448380779 Escort Service
BDSM⚡Call Girls in Sector 57 Noida Escorts >༒8448380779 Escort ServiceBDSM⚡Call Girls in Sector 57 Noida Escorts >༒8448380779 Escort Service
BDSM⚡Call Girls in Sector 57 Noida Escorts >༒8448380779 Escort Service
 
Low Rate ↬Call Girls in Trilokpuri Delhi ↫8447779280}Escorts Service In Delhi
Low Rate ↬Call Girls in Trilokpuri Delhi ↫8447779280}Escorts Service In DelhiLow Rate ↬Call Girls in Trilokpuri Delhi ↫8447779280}Escorts Service In Delhi
Low Rate ↬Call Girls in Trilokpuri Delhi ↫8447779280}Escorts Service In Delhi
 

March 2018 Market Reports for the Gallatin Valley

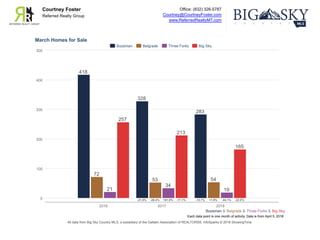
  • 1. Office: (832) 326-5787 Courtney@CourtneyFoster.com www.ReferredRealtyMT.com Courtney Foster Referred Realty Group Each data point is one month of activity. Data is from April 5, 2018. All data from Big Sky Country MLS, a subsidiary of the Gallatin Association of REALTORS®. InfoSparks © 2018 ShowingTime. March Homes for Sale Bozeman & Belgrade & Three Forks & Big Sky 0 100 200 300 400 500 2016 2017 2018 418 328 283 -21.5% -13.7% 72 53 54 -26.4% +1.9% 21 34 19 +61.9% -44.1% 257 213 165 -17.1% -22.5% Bozeman Belgrade Three Forks Big Sky
  • 2. Office: (832) 326-5787 Courtney@CourtneyFoster.com www.ReferredRealtyMT.com Courtney Foster Referred Realty Group Each data point is one month of activity. Data is from April 5, 2018. All data from Big Sky Country MLS, a subsidiary of the Gallatin Association of REALTORS®. InfoSparks © 2018 ShowingTime. March New Listings Bozeman & Belgrade & Three Forks & Big Sky 0 50 100 150 200 250 2016 2017 2018 187 178 178 -4.8% 0.0% 44 52 49 +18.2% -5.8% 10 12 6 +20.0% -50.0% 32 41 24 +28.1% -41.5% Bozeman Belgrade Three Forks Big Sky
  • 3. Office: (832) 326-5787 Courtney@CourtneyFoster.com www.ReferredRealtyMT.com Courtney Foster Referred Realty Group Each data point is one month of activity. Data is from April 5, 2018. All data from Big Sky Country MLS, a subsidiary of the Gallatin Association of REALTORS®. InfoSparks © 2018 ShowingTime. March Pending Sales Bozeman & Belgrade & Three Forks & Big Sky 0 50 100 150 200 250 2016 2017 2018 185 149 156 -19.5% +4.7% 36 52 48 +44.4% -7.7% 11 7 7 -36.4% 0.0% 22 31 42 +40.9% +35.5% Bozeman Belgrade Three Forks Big Sky
  • 4. Office: (832) 326-5787 Courtney@CourtneyFoster.com www.ReferredRealtyMT.com Courtney Foster Referred Realty Group Each data point is one month of activity. Data is from April 5, 2018. All data from Big Sky Country MLS, a subsidiary of the Gallatin Association of REALTORS®. InfoSparks © 2018 ShowingTime. March Closed Sales Bozeman & Belgrade & Three Forks & Big Sky 0 20 40 60 80 100 120 140 2016 2017 2018 108 112 111 +3.7% -0.9% 29 39 32 +34.5% -17.9% 2 4 4 +100.0% 0.0% 19 27 27 +42.1% 0.0% Bozeman Belgrade Three Forks Big Sky
  • 5. Office: (832) 326-5787 Courtney@CourtneyFoster.com www.ReferredRealtyMT.com Courtney Foster Referred Realty Group Each data point is activity year to date. Data is from April 6, 2018. All data from Big Sky Country MLS, a subsidiary of the Gallatin Association of REALTORS®. InfoSparks © 2018 ShowingTime. March Closed Sales Bozeman & Belgrade & Three Forks & Big Sky 0 50 100 150 200 250 300 350 2016 2017 2018 269 280 278 +4.1% -0.7% 73 89 77 +21.9% -13.5% 4 5 15 +25.0% +200.0% 48 54 56 +12.5% +3.7% Bozeman Belgrade Three Forks Big Sky
  • 6. Office: (832) 326-5787 Courtney@CourtneyFoster.com www.ReferredRealtyMT.com Courtney Foster Referred Realty Group Each data point is one month of activity. Data is from April 5, 2018. All data from Big Sky Country MLS, a subsidiary of the Gallatin Association of REALTORS®. InfoSparks © 2018 ShowingTime. March Average Sales Price Bozeman & Belgrade & Three Forks & Big Sky $0 $0.2M $0.4M $0.6M $0.8M $1.0M $1.2M 2016 2017 2018 $377,148 $415,179 $424,445 +10.1% +2.2% $235,366 $274,808 $285,613 +16.8% +3.9% $240,000 $152,225 $194,625 -36.6% +27.9% $844,928 $799,107 $978,067 -5.4% +22.4% Bozeman Belgrade Three Forks Big Sky
  • 7. Office: (832) 326-5787 Courtney@CourtneyFoster.com www.ReferredRealtyMT.com Courtney Foster Referred Realty Group Each data point is one month of activity. Data is from April 5, 2018. All data from Big Sky Country MLS, a subsidiary of the Gallatin Association of REALTORS®. InfoSparks © 2018 ShowingTime. March Months Supply of Homes for Sale Bozeman & Belgrade & Three Forks & Big Sky 0.0 5.0 2.5 7.5 10.0 12.5 15.0 17.5 2016 2017 2018 3.2 2.5 2.2 -21.9% -12.0% 2.2 1.4 1.4 -36.4% 0.0% 4.1 5.9 2.6 +43.9% -55.9% 14.0 10.0 6.8 -28.6% -32.0% Bozeman Belgrade Three Forks Big Sky
  • 8. Office: (832) 326-5787 Courtney@CourtneyFoster.com www.ReferredRealtyMT.com Courtney Foster Referred Realty Group Each data point is one month of activity. Data is from April 5, 2018. All data from Big Sky Country MLS, a subsidiary of the Gallatin Association of REALTORS®. InfoSparks © 2018 ShowingTime. March Median Days on Market Bozeman & Belgrade & Three Forks & Big Sky 0 50 25 75 100 125 150 175 2016 2017 2018 57 37 23 -35.1% -37.8% 25 27 27 +8.0% 0.0% 98 129 19 +31.6% -85.3% 152 153 90 +0.7% -41.2% Bozeman Belgrade Three Forks Big Sky
  • 9. Office: (832) 326-5787 Courtney@CourtneyFoster.com www.ReferredRealtyMT.com Courtney Foster Referred Realty Group Each data point is one month of activity. Data is from April 5, 2018. All data from Big Sky Country MLS, a subsidiary of the Gallatin Association of REALTORS®. InfoSparks © 2018 ShowingTime. March Median Price Per Square Foot Bozeman & Belgrade & Three Forks & Big Sky $0 $100 $200 $300 $400 2016 2017 2018 $164 $174 $198 +6.1% +13.8% $123 $144 $177 +17.1% +22.9% $122 $99 $150 -18.9% +51.5% $262 $319 $351 +21.8% +10.0% Bozeman Belgrade Three Forks Big Sky
  • 10. Local Market Update – February 2018 This is a research tool provided by the Big Sky Country MLS Bozeman City Limits Single Family February Year to Date Key Metrics 2017 2018 % Change Thru 2-2017 Thru 2-2018 % Change New Listings 51 40 - 21.6% 94 91 - 3.2% Pending Sales 32 47 + 46.9% 71 88 + 23.9% Closed Sales 17 38 + 123.5% 55 70 + 27.3% Days on Market Until Sale 104 56 - 46.2% 86 57 - 33.7% Median Sales Price* $348,400 $456,000 + 30.9% $355,000 $432,475 + 21.8% Average Sales Price* $425,216 $490,714 + 15.4% $424,754 $478,339 + 12.6% Percent of List Price Received* 100.1% 99.2% - 0.9% 99.8% 99.3% - 0.5% Inventory of Homes for Sale 116 85 - 26.7% –– –– –– Months Supply of Inventory 2.4 1.8 - 25.0% –– –– –– Condo/Townhouse February Year to Date Key Metrics 2017 2018 % Change Thru 2-2017 Thru 2-2018 % Change New Listings 34 29 - 14.7% 82 54 - 34.1% Pending Sales 29 32 + 10.3% 71 68 - 4.2% Closed Sales 24 19 - 20.8% 51 45 - 11.8% Days on Market Until Sale 139 49 - 64.7% 187 50 - 73.3% Median Sales Price* $267,640 $320,000 + 19.6% $297,000 $293,075 - 1.3% Average Sales Price* $324,746 $360,923 + 11.1% $368,598 $363,225 - 1.5% Percent of List Price Received* 100.3% 98.6% - 1.7% 100.0% 99.2% - 0.8% Inventory of Homes for Sale 54 70 + 29.6% –– –– –– Months Supply of Inventory 1.4 1.9 + 35.7% –– –– –– * Does not account for sale concessions and/or downpayment assistance. | Percent changes are calculated using rounded figures and can sometimes look extreme due to small sample size. A rolling 12-month calculation represents the current month and the 11 months prior in a single data point. If no activity occurred during a month, the line extends to the next available data point. Median Sales Price - Single Family Rolling 12-Month Calculation Gallatin County Bozeman City Limits 1-2003 1-2005 1-2007 1-2009 1-2011 1-2013 1-2015 1-2017 $150,000 $200,000 $250,000 $300,000 $350,000 $400,000 Median Sales Price - Condo Rolling 12-Month Calculation Gallatin County Bozeman City Limits 1-2003 1-2005 1-2007 1-2009 1-2011 1-2013 1-2015 1-2017 $100,000 $150,000 $200,000 $250,000 $300,000 Current as of March 10, 2018. All data from Big Sky Country Multiple Listing Service®. Report © 2018 ShowingTime.
  • 11. Local Market Update – February 2018 This is a research tool provided by the Big Sky Country MLS Belgrade Single Family February Year to Date Key Metrics 2017 2018 % Change Thru 2-2017 Thru 2-2018 % Change New Listings 26 25 - 3.8% 50 52 + 4.0% Pending Sales 24 31 + 29.2% 51 52 + 2.0% Closed Sales 18 23 + 27.8% 36 33 - 8.3% Days on Market Until Sale 106 65 - 38.7% 80 61 - 23.8% Median Sales Price* $269,250 $320,000 + 18.8% $262,450 $284,000 + 8.2% Average Sales Price* $329,639 $389,833 + 18.3% $294,840 $357,292 + 21.2% Percent of List Price Received* 97.0% 99.4% + 2.5% 98.1% 99.2% + 1.1% Inventory of Homes for Sale 43 39 - 9.3% –– –– –– Months Supply of Inventory 1.7 1.3 - 23.5% –– –– –– Condo/Townhouse February Year to Date Key Metrics 2017 2018 % Change Thru 2-2017 Thru 2-2018 % Change New Listings 7 7 0.0% 13 12 - 7.7% Pending Sales 5 7 + 40.0% 11 14 + 27.3% Closed Sales 3 2 - 33.3% 6 4 - 33.3% Days on Market Until Sale 119 19 - 84.0% 62 36 - 41.9% Median Sales Price* $162,500 $212,500 + 30.8% $156,250 $212,500 + 36.0% Average Sales Price* $160,833 $212,500 + 32.1% $157,867 $225,125 + 42.6% Percent of List Price Received* 99.5% 98.1% - 1.4% 100.0% 98.5% - 1.5% Inventory of Homes for Sale 8 8 0.0% –– –– –– Months Supply of Inventory 1.1 1.1 0.0% –– –– –– * Does not account for sale concessions and/or downpayment assistance. | Percent changes are calculated using rounded figures and can sometimes look extreme due to small sample size. A rolling 12-month calculation represents the current month and the 11 months prior in a single data point. If no activity occurred during a month, the line extends to the next available data point. Median Sales Price - Single Family Rolling 12-Month Calculation Gallatin County Belgrade 1-2003 1-2005 1-2007 1-2009 1-2011 1-2013 1-2015 1-2017 $100,000 $150,000 $200,000 $250,000 $300,000 $350,000 $400,000 Median Sales Price - Condo Rolling 12-Month Calculation Gallatin County Belgrade 1-2003 1-2005 1-2007 1-2009 1-2011 1-2013 1-2015 1-2017 $50,000 $100,000 $150,000 $200,000 $250,000 $300,000 Current as of March 10, 2018. All data from Big Sky Country Multiple Listing Service®. Report © 2018 ShowingTime.
  • 12. Local Market Update – February 2018 This is a research tool provided by the Big Sky Country MLS Greater Big Sky Single Family February Year to Date Key Metrics 2017 2018 % Change Thru 2-2017 Thru 2-2018 % Change New Listings 10 16 + 60.0% 12 23 + 91.7% Pending Sales 3 16 + 433.3% 8 22 + 175.0% Closed Sales 3 5 + 66.7% 4 5 + 25.0% Days on Market Until Sale 206 201 - 2.4% 200 201 + 0.5% Median Sales Price* $1,995,000 $1,995,000 0.0% $1,722,500 $1,995,000 + 15.8% Average Sales Price* $2,148,333 $1,879,332 - 12.5% $1,737,500 $1,879,332 + 8.2% Percent of List Price Received* 95.7% 99.3% + 3.8% 95.6% 99.3% + 3.9% Inventory of Homes for Sale 83 67 - 19.3% –– –– –– Months Supply of Inventory 15.2 8.7 - 42.8% –– –– –– Condo/Townhouse February Year to Date Key Metrics 2017 2018 % Change Thru 2-2017 Thru 2-2018 % Change New Listings 19 11 - 42.1% 27 34 + 25.9% Pending Sales 17 20 + 17.6% 37 38 + 2.7% Closed Sales 14 9 - 35.7% 21 21 0.0% Days on Market Until Sale 158 121 - 23.4% 171 104 - 39.2% Median Sales Price* $367,500 $290,000 - 21.1% $365,000 $300,000 - 17.8% Average Sales Price* $414,068 $371,056 - 10.4% $390,140 $383,286 - 1.8% Percent of List Price Received* 96.3% 96.9% + 0.6% 95.3% 96.4% + 1.2% Inventory of Homes for Sale 104 112 + 7.7% –– –– –– Months Supply of Inventory 7.1 7.8 + 9.9% –– –– –– * Does not account for sale concessions and/or downpayment assistance. | Percent changes are calculated using rounded figures and can sometimes look extreme due to small sample size. A rolling 12-month calculation represents the current month and the 11 months prior in a single data point. If no activity occurred during a month, the line extends to the next available data point. Median Sales Price - Single Family Rolling 12-Month Calculation Gallatin County Greater Big Sky 1-2003 1-2005 1-2007 1-2009 1-2011 1-2013 1-2015 1-2017 $0 $500,000 $1,000,000 $1,500,000 $2,000,000 Median Sales Price - Condo Rolling 12-Month Calculation Gallatin County Greater Big Sky 1-2003 1-2005 1-2007 1-2009 1-2011 1-2013 1-2015 1-2017 $0 $100,000 $200,000 $300,000 $400,000 $500,000 $600,000 Current as of March 10, 2018. All data from Big Sky Country Multiple Listing Service®. Report © 2018 ShowingTime.
  • 13. Local Market Update – February 2018 This is a research tool provided by the Big Sky Country MLS Livingston City Limits Single Family February Year to Date Key Metrics 2017 2018 % Change Thru 2-2017 Thru 2-2018 % Change New Listings 14 5 - 64.3% 21 14 - 33.3% Pending Sales 15 6 - 60.0% 28 12 - 57.1% Closed Sales 8 1 - 87.5% 14 10 - 28.6% Days on Market Until Sale 85 0 - 100.0% 78 31 - 60.3% Median Sales Price* $252,250 $265,000 + 5.1% $209,000 $246,600 + 18.0% Average Sales Price* $256,416 $265,000 + 3.3% $226,359 $243,020 + 7.4% Percent of List Price Received* 97.6% 98.5% + 0.9% 97.0% 94.4% - 2.7% Inventory of Homes for Sale 29 23 - 20.7% –– –– –– Months Supply of Inventory 2.4 1.9 - 20.8% –– –– –– Condo/Townhouse February Year to Date Key Metrics 2017 2018 % Change Thru 2-2017 Thru 2-2018 % Change New Listings 1 2 + 100.0% 1 5 + 400.0% Pending Sales 0 3 –– 0 6 –– Closed Sales 0 3 –– 1 5 + 400.0% Days on Market Until Sale –– 84 –– 76 51 - 32.9% Median Sales Price* –– $205,000 –– $148,000 $211,000 + 42.6% Average Sales Price* –– $197,000 –– $148,000 $205,400 + 38.8% Percent of List Price Received* –– 92.5% –– 96.7% 95.5% - 1.2% Inventory of Homes for Sale 7 5 - 28.6% –– –– –– Months Supply of Inventory 4.2 1.6 - 61.9% –– –– –– * Does not account for sale concessions and/or downpayment assistance. | Percent changes are calculated using rounded figures and can sometimes look extreme due to small sample size. A rolling 12-month calculation represents the current month and the 11 months prior in a single data point. If no activity occurred during a month, the line extends to the next available data point. Median Sales Price - Single Family Rolling 12-Month Calculation Gallatin County Livingston City Limits 1-2003 1-2005 1-2007 1-2009 1-2011 1-2013 1-2015 1-2017 $50,000 $100,000 $150,000 $200,000 $250,000 $300,000 $350,000 $400,000 Median Sales Price - Condo Rolling 12-Month Calculation Gallatin County Livingston City Limits 1-2003 1-2005 1-2007 1-2009 1-2011 1-2013 1-2015 1-2017 $50,000 $100,000 $150,000 $200,000 $250,000 $300,000 Current as of March 10, 2018. All data from Big Sky Country Multiple Listing Service®. Report © 2018 ShowingTime.