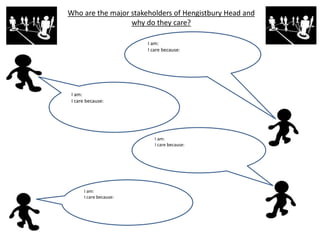
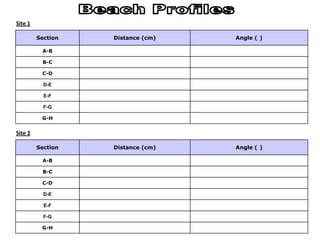
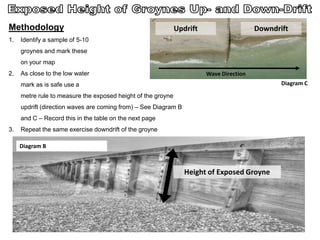
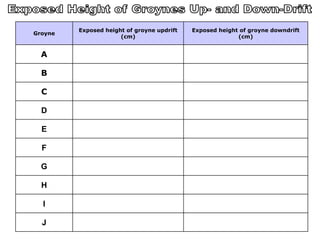
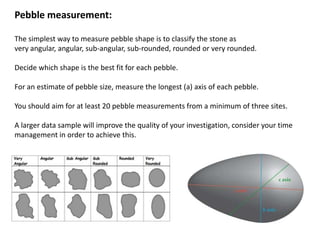
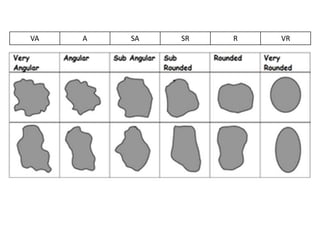
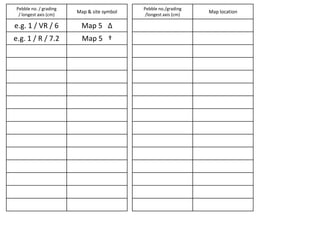
Year 10 Controlled Assessment
Spring / Summer 2012
“How do geomorphic processes affect
Hengistbury Head?”
Name ______________________________________________
Teacher ______________________________________________
Tutor group ______________________________________________
Date of field visit ______________________________________________
“How do geomorphic processes affect Hengistbury Head?”
key questions
1
2
3
4
5
Data Method Limitations Solutions
Links to key
question
Land use map
Beach Profile
Data Method Limitations Solutions
Links to key
question
Exposed
Groyne Height
Measurement
Data Method Limitations Solutions
Links to key
question
Data Method Limitations Solutions
Links to key
question
Hengistbury Head map 1: Land use map
Hengistbury Head map 2: Geomorphological processes
Hengistbury Head map 3: Coastal management techniques
Hengistbury Head map 4: Local geology
Hengistbury Head map 5:
Hengistbury Head map 6:
Field Sketch A:
Field Sketch B:
Field Sketch C:
Field Sketch D:
Field Sketch E:
Field Sketch F:
Who are the major stakeholders of Hengistbury Head and
why do they care?
I am:
I care because:
I am:
I care because:
I am:
I care because:
I am:
I care because:
1. Male or Female?
2. How old (roughly in Years) are you? – (Guess, don’t ask!!!)
0-15 15-25 25-40 40-50 50-65 65+
3. Approximately, how many miles away do you live from this section of coast?
0-5 5-15 15-30 30-50 50-100 100+
4. How often, on average, do you visit this section of coast?
a. Everyday
b. At least once a week
c. At least once a month
5. Why do you visit this section of coast?
a. Walks along the beach
b. For some peace and quiet
c. Job (eg. you work in a local café)
6. How important do you feel it is to protect this section of coast from geomorphological processes on a scale of 1-5
(1 = not important at all, 5 = very important)
d. At least once a year
e. Less than once a year
f. This is my first time visiting this section of
coast
d. Other ________________
You will need to edit and adapt the questionnaire to improve it and suit your project.
7. Would you say you visited this section of coast:
a.On a regular basis?
b.Quite often?
c.Rarely?
8. What is your opinion on the following statements on a scale of 1-5 (1=strongly disagree, 5=strongly agree)
a.Existing sea defences are necessary
b.More sea defences should be put in place
c.The sea defences are unattractive
d.The beaches have been improved by the sea defences
e.More sea defences are needed
f.Government money could be better spent elsewhere instead of defending this coastline
QuestionnaireResponses
12
3
47658
Methodology
Identify 3 sampling sites across the width of the beach to measure your beach profiles – Mark these clearly on your map
For each Site:-
• Place a Ranging Pole at A (as close to the low-tide mark as safe)
• Identify the key points where the slope angle seems to change (eg. Diagram A below) – use each of these points to divide
your profile into sections
• Measure the distance between point A and B using a measuring tape (Record this in the tables on the next page)
• Measure the slope angle between point A and B using a clinometer (Record this in the tables on the next page)
• Repeat this process for Sections B-C, C-D, etc
Diagram A
Section Distance (cm) Angle ( )
A-B
B-C
C-D
D-E
E-F
F-G
G-H
Site 1
Section Distance (cm) Angle ( )
A-B
B-C
C-D
D-E
E-F
F-G
G-H
Site 2
Section Distance (cm) Angle ( )
A-B
B-C
C-D
D-E
E-F
F-G
G-H
Site 3
Section Distance (cm) Angle ( )
A-B
B-C
C-D
D-E
E-F
F-G
G-H
Site 4
Methodology
1. Identify a sample of 5-10
groynes and mark these
on your map
2. As close to the low water
mark as is safe use a
metre rule to measure the exposed height of the groyne
updrift (direction waves are coming from) – See Diagram B
and C – Record this in the table on the next page
3. Repeat the same exercise downdrift of the groyne
Wave Direction
Updrift Downdrift
Height of Exposed Groyne
Diagram C
Diagram B
Groyne
Exposed height of groyne updrift
(cm)
Exposed height of groyne downdrift
(cm)
A
B
C
D
E
F
G
H
I
J
Pebble measurement:
The simplest way to measure pebble shape is to classify the stone as
very angular, angular, sub-angular, sub-rounded, rounded or very rounded.
Decide which shape is the best fit for each pebble.
For an estimate of pebble size, measure the longest (a) axis of each pebble.
You should aim for at least 20 pebble measurements from a minimum of three sites.
A larger data sample will improve the quality of your investigation, consider your time
management in order to achieve this.
VA A SA SR R VR
Pebble no. / grading
/ longest axis (cm)
Map & site symbol
e.g. 1 / VR / 6 Map 5 ∆
e.g. 1 / R / 7.2 Map 5 †
Pebble no./grading
/longest axis (cm)
Map location

Geomorphology GCSE fieldbook data collection

  • 1.
    Year 10 ControlledAssessment Spring / Summer 2012 “How do geomorphic processes affect Hengistbury Head?” Name ______________________________________________ Teacher ______________________________________________ Tutor group ______________________________________________ Date of field visit ______________________________________________
  • 2.
    “How do geomorphicprocesses affect Hengistbury Head?” key questions 1 2 3 4 5
  • 3.
    Data Method LimitationsSolutions Links to key question Land use map Beach Profile
  • 4.
    Data Method LimitationsSolutions Links to key question Exposed Groyne Height Measurement
  • 5.
    Data Method LimitationsSolutions Links to key question
  • 6.
    Data Method LimitationsSolutions Links to key question
  • 7.
    Hengistbury Head map1: Land use map
  • 8.
    Hengistbury Head map2: Geomorphological processes
  • 9.
    Hengistbury Head map3: Coastal management techniques
  • 10.
    Hengistbury Head map4: Local geology
  • 11.
  • 12.
  • 13.
  • 14.
  • 15.
  • 16.
  • 17.
  • 18.
  • 19.
    Who are themajor stakeholders of Hengistbury Head and why do they care? I am: I care because: I am: I care because: I am: I care because: I am: I care because:
  • 20.
    1. Male orFemale? 2. How old (roughly in Years) are you? – (Guess, don’t ask!!!) 0-15 15-25 25-40 40-50 50-65 65+ 3. Approximately, how many miles away do you live from this section of coast? 0-5 5-15 15-30 30-50 50-100 100+ 4. How often, on average, do you visit this section of coast? a. Everyday b. At least once a week c. At least once a month 5. Why do you visit this section of coast? a. Walks along the beach b. For some peace and quiet c. Job (eg. you work in a local café) 6. How important do you feel it is to protect this section of coast from geomorphological processes on a scale of 1-5 (1 = not important at all, 5 = very important) d. At least once a year e. Less than once a year f. This is my first time visiting this section of coast d. Other ________________ You will need to edit and adapt the questionnaire to improve it and suit your project.
  • 21.
    7. Would yousay you visited this section of coast: a.On a regular basis? b.Quite often? c.Rarely? 8. What is your opinion on the following statements on a scale of 1-5 (1=strongly disagree, 5=strongly agree) a.Existing sea defences are necessary b.More sea defences should be put in place c.The sea defences are unattractive d.The beaches have been improved by the sea defences e.More sea defences are needed f.Government money could be better spent elsewhere instead of defending this coastline
  • 22.
  • 23.
    Methodology Identify 3 samplingsites across the width of the beach to measure your beach profiles – Mark these clearly on your map For each Site:- • Place a Ranging Pole at A (as close to the low-tide mark as safe) • Identify the key points where the slope angle seems to change (eg. Diagram A below) – use each of these points to divide your profile into sections • Measure the distance between point A and B using a measuring tape (Record this in the tables on the next page) • Measure the slope angle between point A and B using a clinometer (Record this in the tables on the next page) • Repeat this process for Sections B-C, C-D, etc Diagram A
  • 24.
    Section Distance (cm)Angle ( ) A-B B-C C-D D-E E-F F-G G-H Site 1 Section Distance (cm) Angle ( ) A-B B-C C-D D-E E-F F-G G-H Site 2
  • 25.
    Section Distance (cm)Angle ( ) A-B B-C C-D D-E E-F F-G G-H Site 3 Section Distance (cm) Angle ( ) A-B B-C C-D D-E E-F F-G G-H Site 4
  • 26.
    Methodology 1. Identify asample of 5-10 groynes and mark these on your map 2. As close to the low water mark as is safe use a metre rule to measure the exposed height of the groyne updrift (direction waves are coming from) – See Diagram B and C – Record this in the table on the next page 3. Repeat the same exercise downdrift of the groyne Wave Direction Updrift Downdrift Height of Exposed Groyne Diagram C Diagram B
  • 27.
    Groyne Exposed height ofgroyne updrift (cm) Exposed height of groyne downdrift (cm) A B C D E F G H I J
  • 28.
    Pebble measurement: The simplestway to measure pebble shape is to classify the stone as very angular, angular, sub-angular, sub-rounded, rounded or very rounded. Decide which shape is the best fit for each pebble. For an estimate of pebble size, measure the longest (a) axis of each pebble. You should aim for at least 20 pebble measurements from a minimum of three sites. A larger data sample will improve the quality of your investigation, consider your time management in order to achieve this.
  • 29.
    VA A SASR R VR
  • 30.
    Pebble no. /grading / longest axis (cm) Map & site symbol e.g. 1 / VR / 6 Map 5 ∆ e.g. 1 / R / 7.2 Map 5 † Pebble no./grading /longest axis (cm) Map location