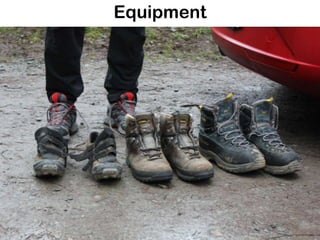
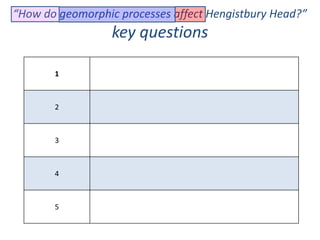
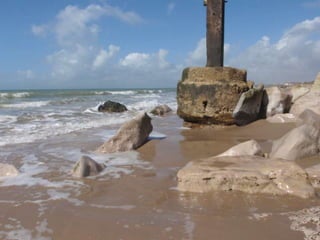
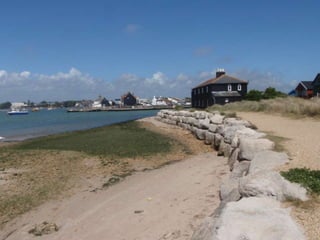
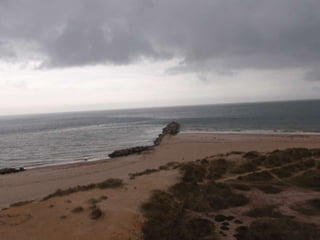
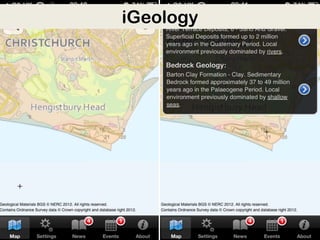
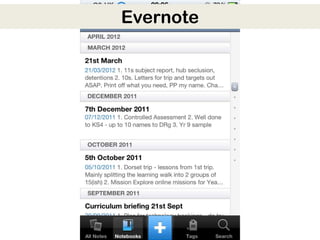
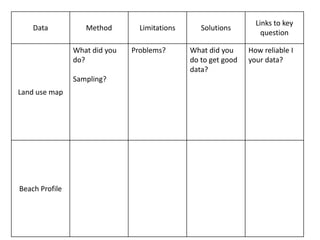
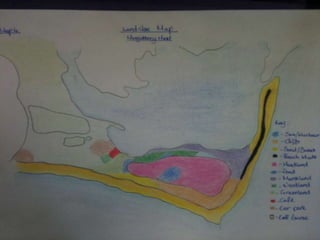
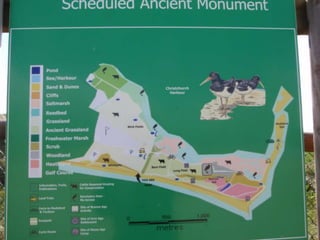
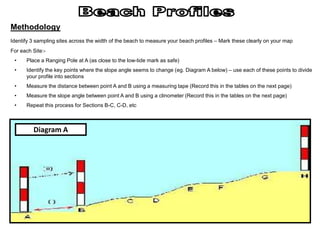
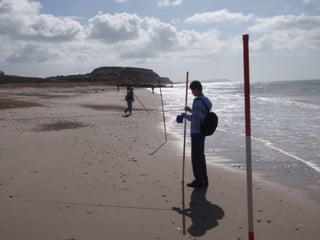
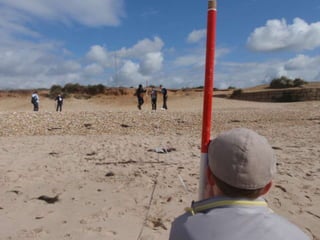
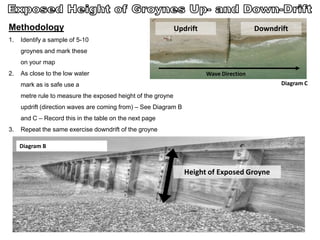
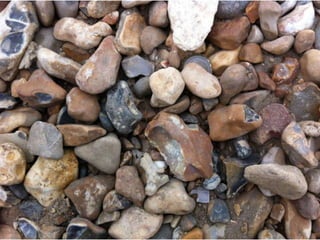
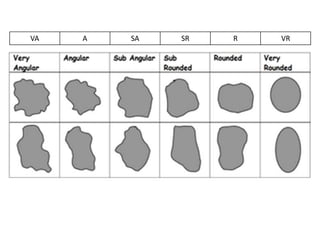
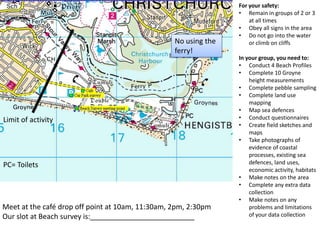
Hengistbury Head Preparation

  • Meet at 7am by the minibuses
  • Lunch and money
  • Camera (phone)
Equipment
“How do geomorphic processes affect Hengistbury Head?”
                  key questions

       1


       2


       3


       4


       5
Eyes were invented before instruments
Homework

Find out how to use your phone!
iGeology
Audioboo / Voice Memos
OneNote / Notepad
Evernote
Photo and video apps. Photosynth
Links to key
    Data           Method        Limitations      Solutions
                                                                    question

                What did you   Problems?       What did you     How reliable I
                do?                            do to get good   your data?
                                               data?
                Sampling?
Land use map


Beach Profile
Hengistbury Head map 3: Coastal management techniques
Methodology
Identify 3 sampling sites across the width of the beach to measure your beach profiles – Mark these clearly on your map
For each Site:-
 •    Place a Ranging Pole at A (as close to the low-tide mark as safe)
 •    Identify the key points where the slope angle seems to change (eg. Diagram A below) – use each of these points to divide
      your profile into sections
 •    Measure the distance between point A and B using a measuring tape (Record this in the tables on the next page)
 •    Measure the slope angle between point A and B using a clinometer (Record this in the tables on the next page)
 •    Repeat this process for Sections B-C, C-D, etc


         Diagram A
Methodology                                                   Updrift                    Downdrift
1.   Identify a sample of 5-10
     groynes and mark these
     on your map
2.   As close to the low water                                          Wave Direction
     mark as is safe use a                                                                      Diagram C

     metre rule to measure the exposed height of the groyne
     updrift (direction waves are coming from) – See Diagram B
     and C – Record this in the table on the next page
3.   Repeat the same exercise downdrift of the groyne

     Diagram B


                                                                 Height of Exposed Groyne
VA   A   SA   SR   R   VR
For your safety:
                                                                 • Remain in groups of 2 or 3
                                                                     at all times
                                                                 • Obey all signs in the area
                                                                 • Do not go into the water
                                                  No using the       or climb on cliffs
                                                  ferry!
                                                                 In your group, you need to:
                                                                 • Conduct 4 Beach Profiles
                                                                 • Complete 10 Groyne
                                                                     height measurements
                                                                 • Complete pebble sampling
                                                                 • Complete land use
                                                                     mapping
                                                                 • Map sea defences
Limit of activity                                                • Conduct questionnaires
                                                                 • Create field sketches and
                                                                     maps
                                                                 • Take photographs of
                                                                     evidence of coastal
                                                                     processes, existing sea
PC= Toilets                                                          defences, land uses,
                                                                     economic activity, habitats
                                                                 • Make notes on the area
                                                                 • Complete any extra data
                                                                     collection
                                                                 • Make notes on any
Meet at the café drop off point at 10am, 11:30am, 2pm, 2:30pm        problems and limitations
Our slot at Beach survey is:                                         of your data collection

Pre trip briefing

  • 1.
    Hengistbury Head Preparation • Meet at 7am by the minibuses • Lunch and money • Camera (phone)
  • 2.
  • 5.
    “How do geomorphicprocesses affect Hengistbury Head?” key questions 1 2 3 4 5
  • 7.
    Eyes were inventedbefore instruments
  • 11.
    Homework Find out howto use your phone!
  • 12.
  • 13.
  • 14.
  • 15.
  • 16.
    Photo and videoapps. Photosynth
  • 17.
    Links to key Data Method Limitations Solutions question What did you Problems? What did you How reliable I do? do to get good your data? data? Sampling? Land use map Beach Profile
  • 20.
    Hengistbury Head map3: Coastal management techniques
  • 21.
    Methodology Identify 3 samplingsites across the width of the beach to measure your beach profiles – Mark these clearly on your map For each Site:- • Place a Ranging Pole at A (as close to the low-tide mark as safe) • Identify the key points where the slope angle seems to change (eg. Diagram A below) – use each of these points to divide your profile into sections • Measure the distance between point A and B using a measuring tape (Record this in the tables on the next page) • Measure the slope angle between point A and B using a clinometer (Record this in the tables on the next page) • Repeat this process for Sections B-C, C-D, etc Diagram A
  • 24.
    Methodology Updrift Downdrift 1. Identify a sample of 5-10 groynes and mark these on your map 2. As close to the low water Wave Direction mark as is safe use a Diagram C metre rule to measure the exposed height of the groyne updrift (direction waves are coming from) – See Diagram B and C – Record this in the table on the next page 3. Repeat the same exercise downdrift of the groyne Diagram B Height of Exposed Groyne
  • 26.
    VA A SA SR R VR
  • 27.
    For your safety: • Remain in groups of 2 or 3 at all times • Obey all signs in the area • Do not go into the water No using the or climb on cliffs ferry! In your group, you need to: • Conduct 4 Beach Profiles • Complete 10 Groyne height measurements • Complete pebble sampling • Complete land use mapping • Map sea defences Limit of activity • Conduct questionnaires • Create field sketches and maps • Take photographs of evidence of coastal processes, existing sea PC= Toilets defences, land uses, economic activity, habitats • Make notes on the area • Complete any extra data collection • Make notes on any Meet at the café drop off point at 10am, 11:30am, 2pm, 2:30pm problems and limitations Our slot at Beach survey is: of your data collection

Editor's Notes