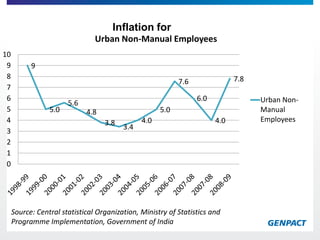
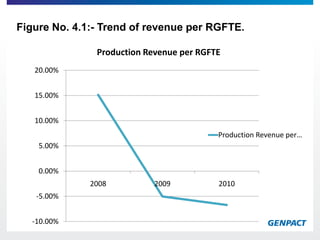
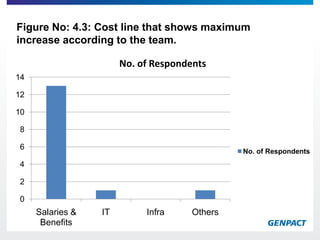
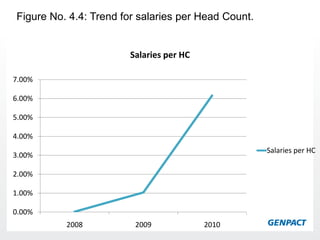
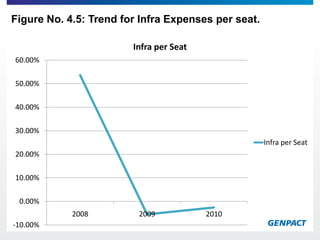
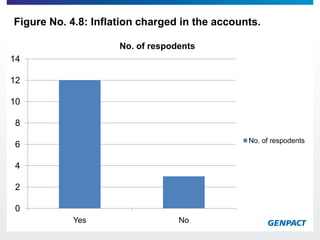
SUMMER TRAINING PROJECTPRESENTED BY:JagmohanParmarMBA 2C
PramodBhasin,President & CEOTiger Tyagarajan,Chief Operating OfficerMohitThukralSr. Vice PresidentBFSI AbhinavKapoorVice President,BFSITathaguptaMallakarAssist. Vice PresidentRahulMalhotraAssist. Vice PresidentNishi AroraAssist. Vice President
Current RatioIn US $
Acid Test/Quick RatioIn US $
Absolute liquid RatioIn US $
Debtor Turnover RatioIn US $
Debt Equity Ratio
Net Profit Ratio
Trend of Revenue
Trend of Cost of Revenue
Source: Nasscom
To study the inflation trend in Indian economy.
To analyze the effect on the cost drivers in Genpact due to various factors.
To know the effect on the profitability of Genpact due to change in the total cost of the company.
Inflation forSource: Central statistical Organization, Ministry of Statistics and Programme Implementation, Government of India
Source: Macroeconomic and Monetary Developments - First Quarter Review 2009-10, Reserve Bank of India
Scope of Research: The research has been conducted in Gurgaon at Genpact India and it includes all the members of Financial Planning & Analysis team.
Universe: The people dealing in the finance support team of various BPO companies.
Population : Total number of employees working in the Finance Planning and Analysis team in BFSI in Genpact India.
Research Design : DescriptiveSampling Frame: all the employees working in the Finance Planning and Analysis (FP and A) team in BFSI in Genpact India.
Sample size: The number of elements considered and included in the study is 15.
Data Collection:
     Primary data
     Secondary data
REALIZATION PER RGFTE: In simple words, itcan be defined as the contribution made to the total revenue by each RGFTE employed by the company.  Realization per RGFTE =    Production revenue                                     Production RGFTE Head count
Figure No. 4.1:- Trend of revenue per RGFTE.
SALARIES AND BENEFITS: While calculating salaries and benefits, total of all kinds of salaries paid during the year is taken.Cost Driverfor salaries and benefits is the total Head Count of the COE.Salaries & Benefits per RGFTE =    Total Salaries & Benefits                                                          Total Head Count
Figure No. 4.2: Any significant deviation seen in the cost during the contract period.
Figure No: 4.3: Cost line that shows maximum increase according to the team.
Figure No. 4.4: Trend for salaries per Head Count.
Figure No. 4.5: Trend for Infra Expenses per seat.
IT EXPENSESCost driver for IT expenses taken is SU, i.e. total number of work stations being used at one time. IT Expenses per SU =    Total IT Expenses                                    Total Work Stations
Figure No. 4.6: Trend of IT Expenses per seat.
OTHER EMPLOYEE COSTS: Training    RecruitmentOther expensesCost Driver for other expenses taken is HC. Total of HC up to band 4 and band 5 is taken into consideration.Other expenses per HC =        Total Cost                                           Total HC (Band 4 & 5) 
Figure No.4.7: Trend of other expenses per head count.
Figure No. 4.8: Inflation charged in the accounts.
Figure No. 4.9: Percentage of inflation charged in the accounts.

Genpact