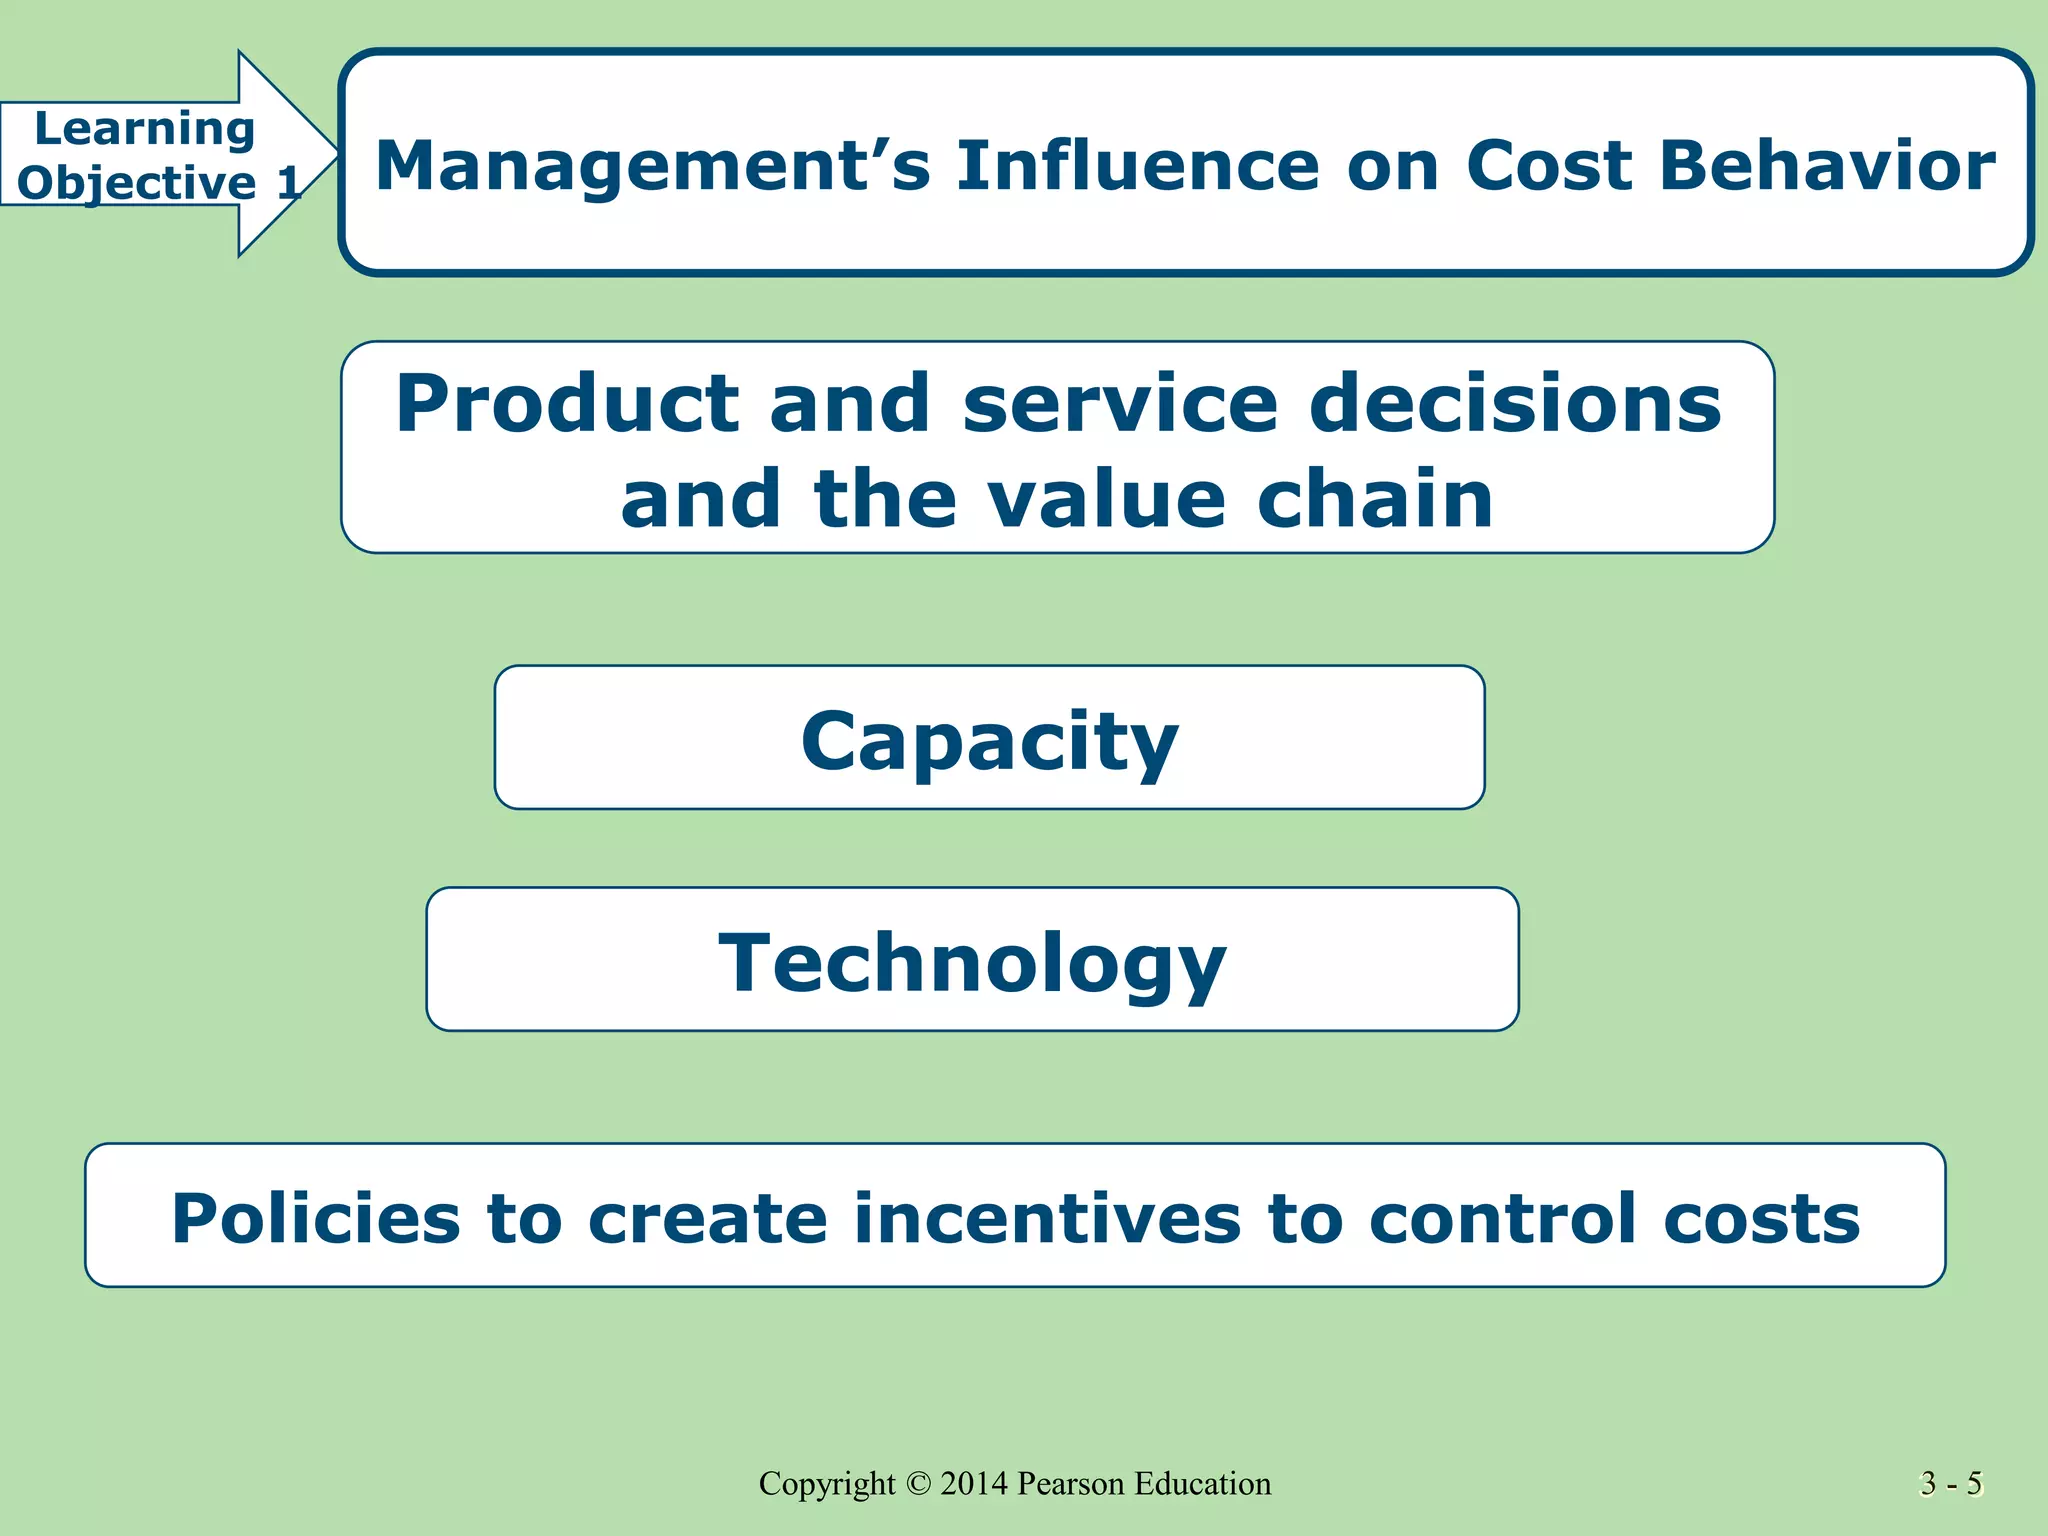
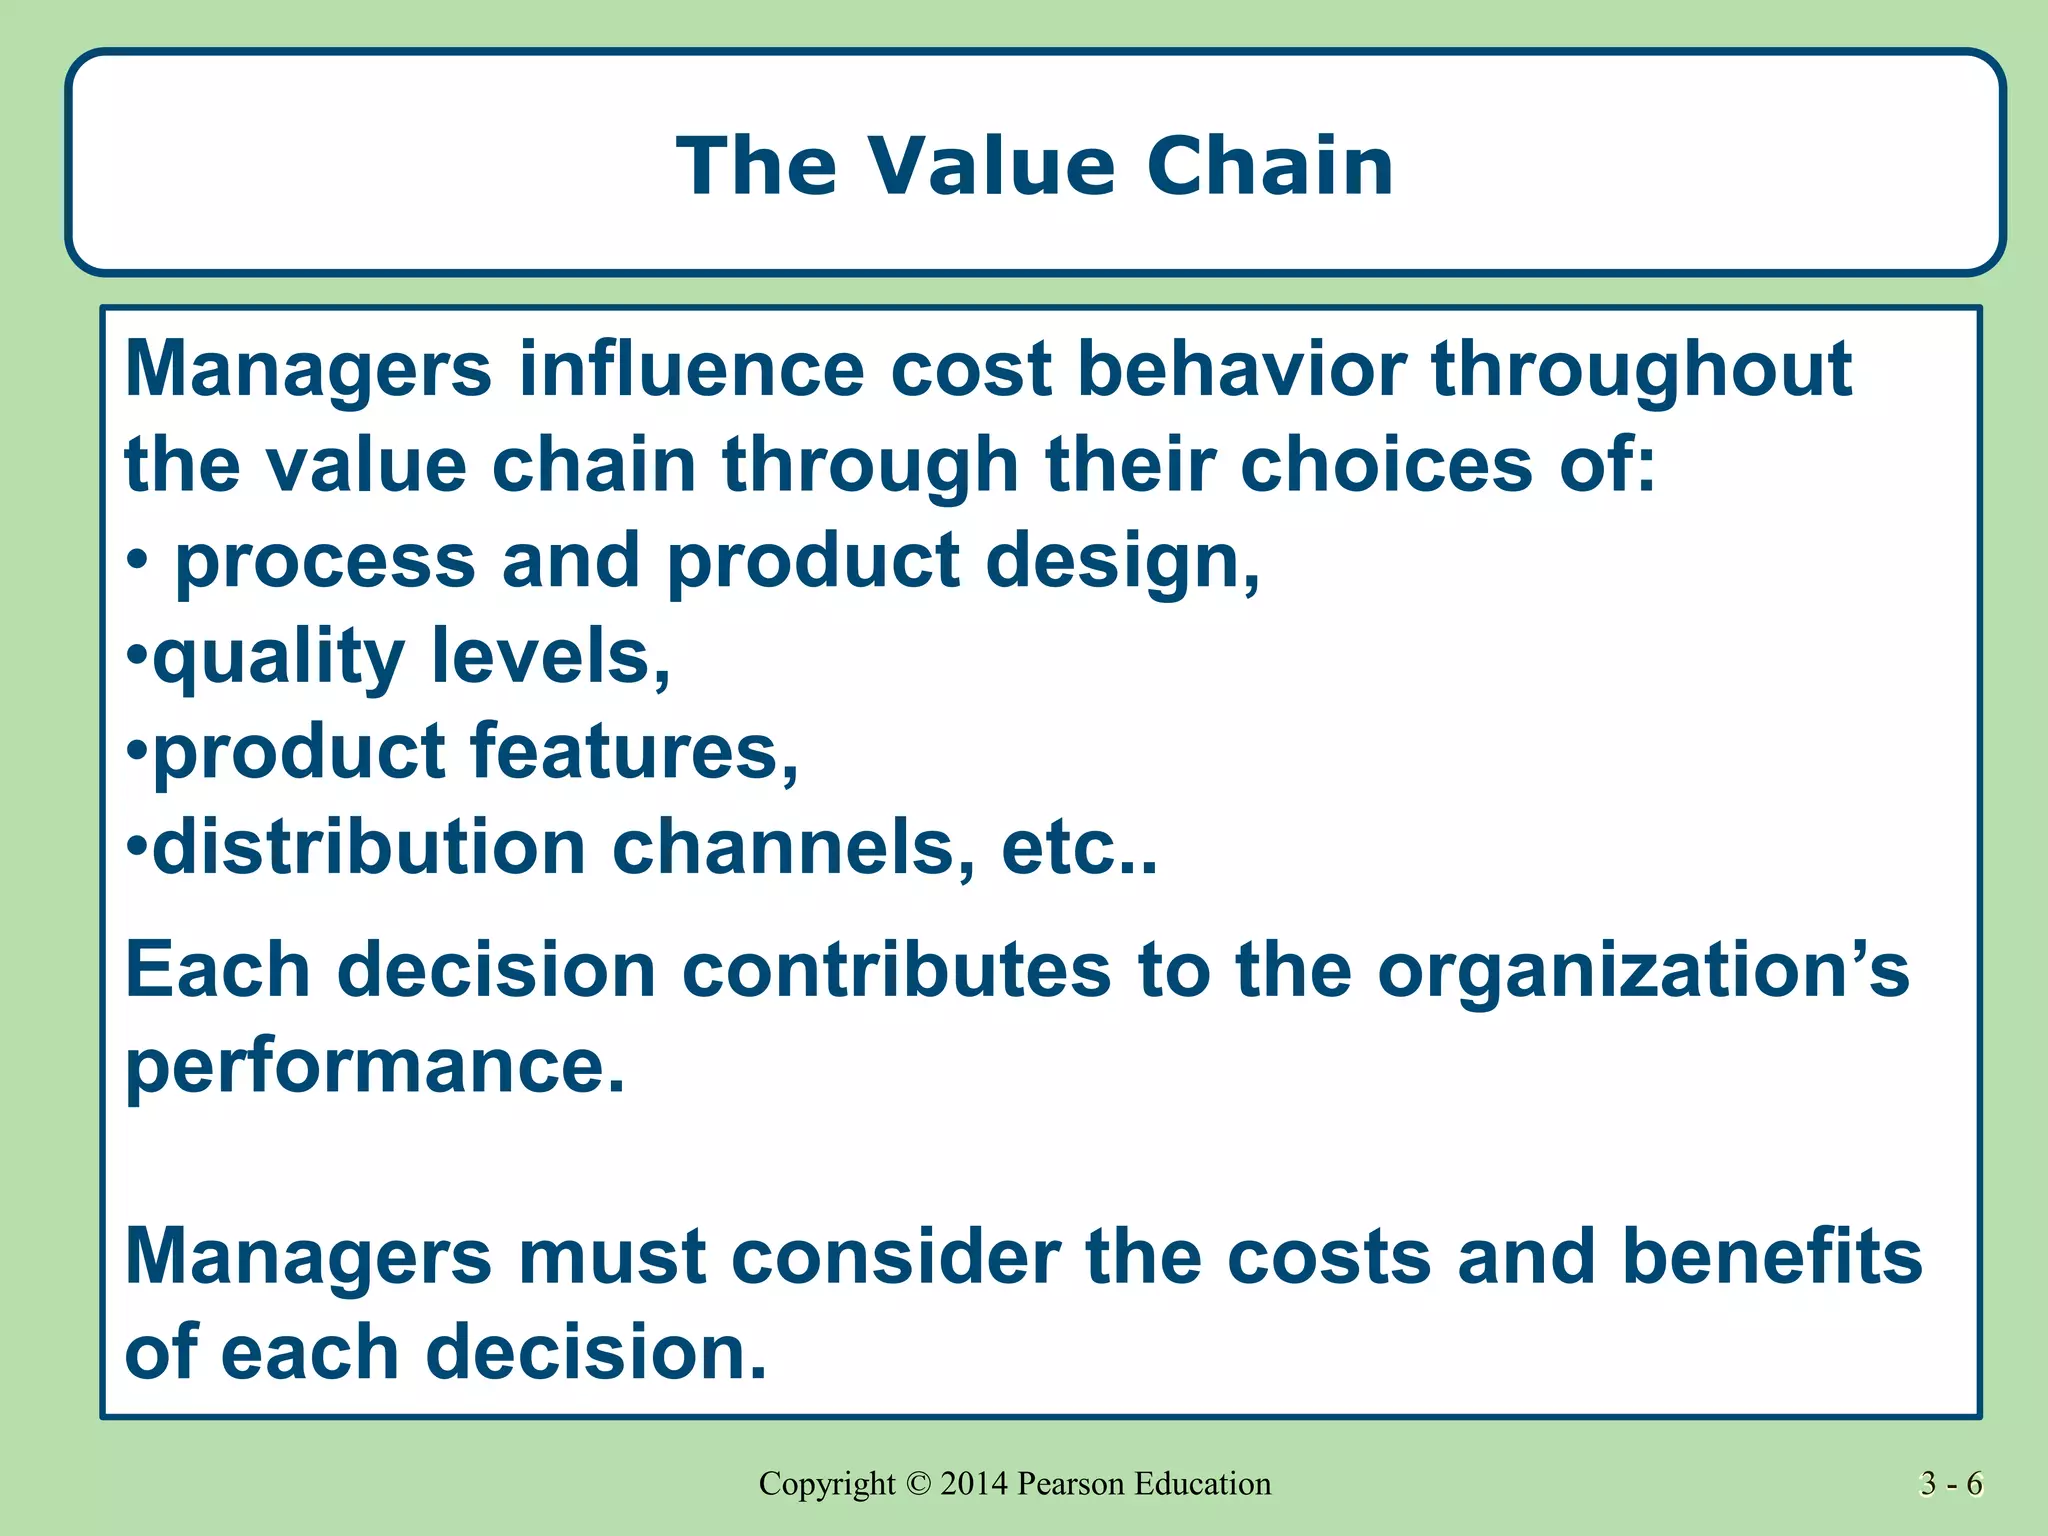
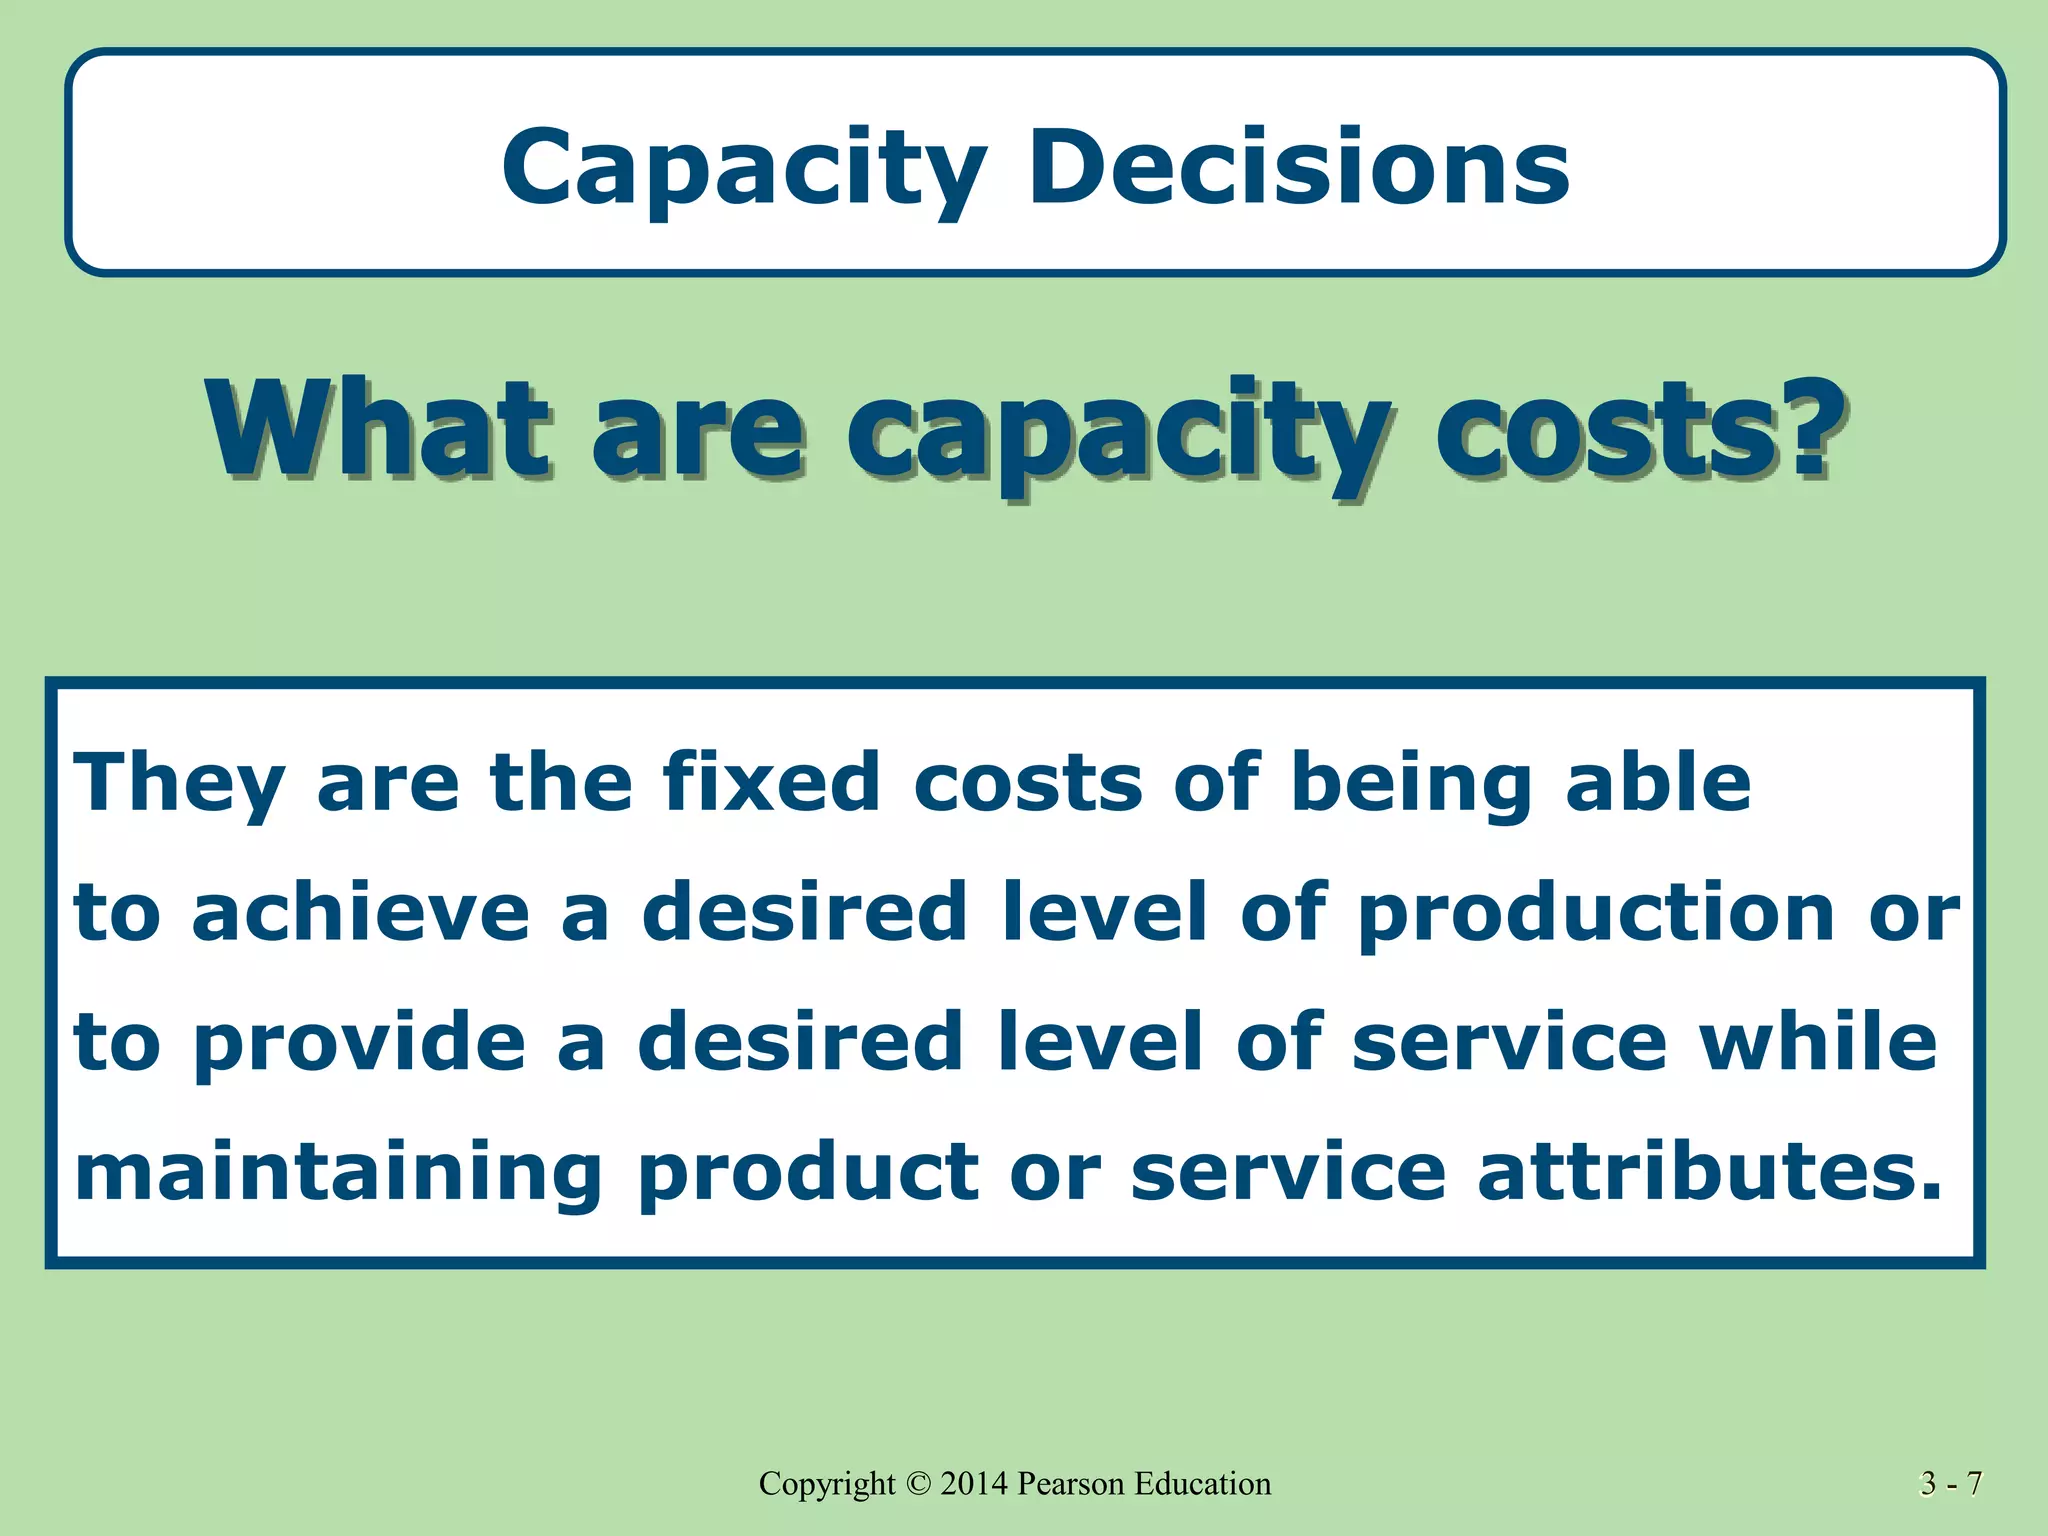
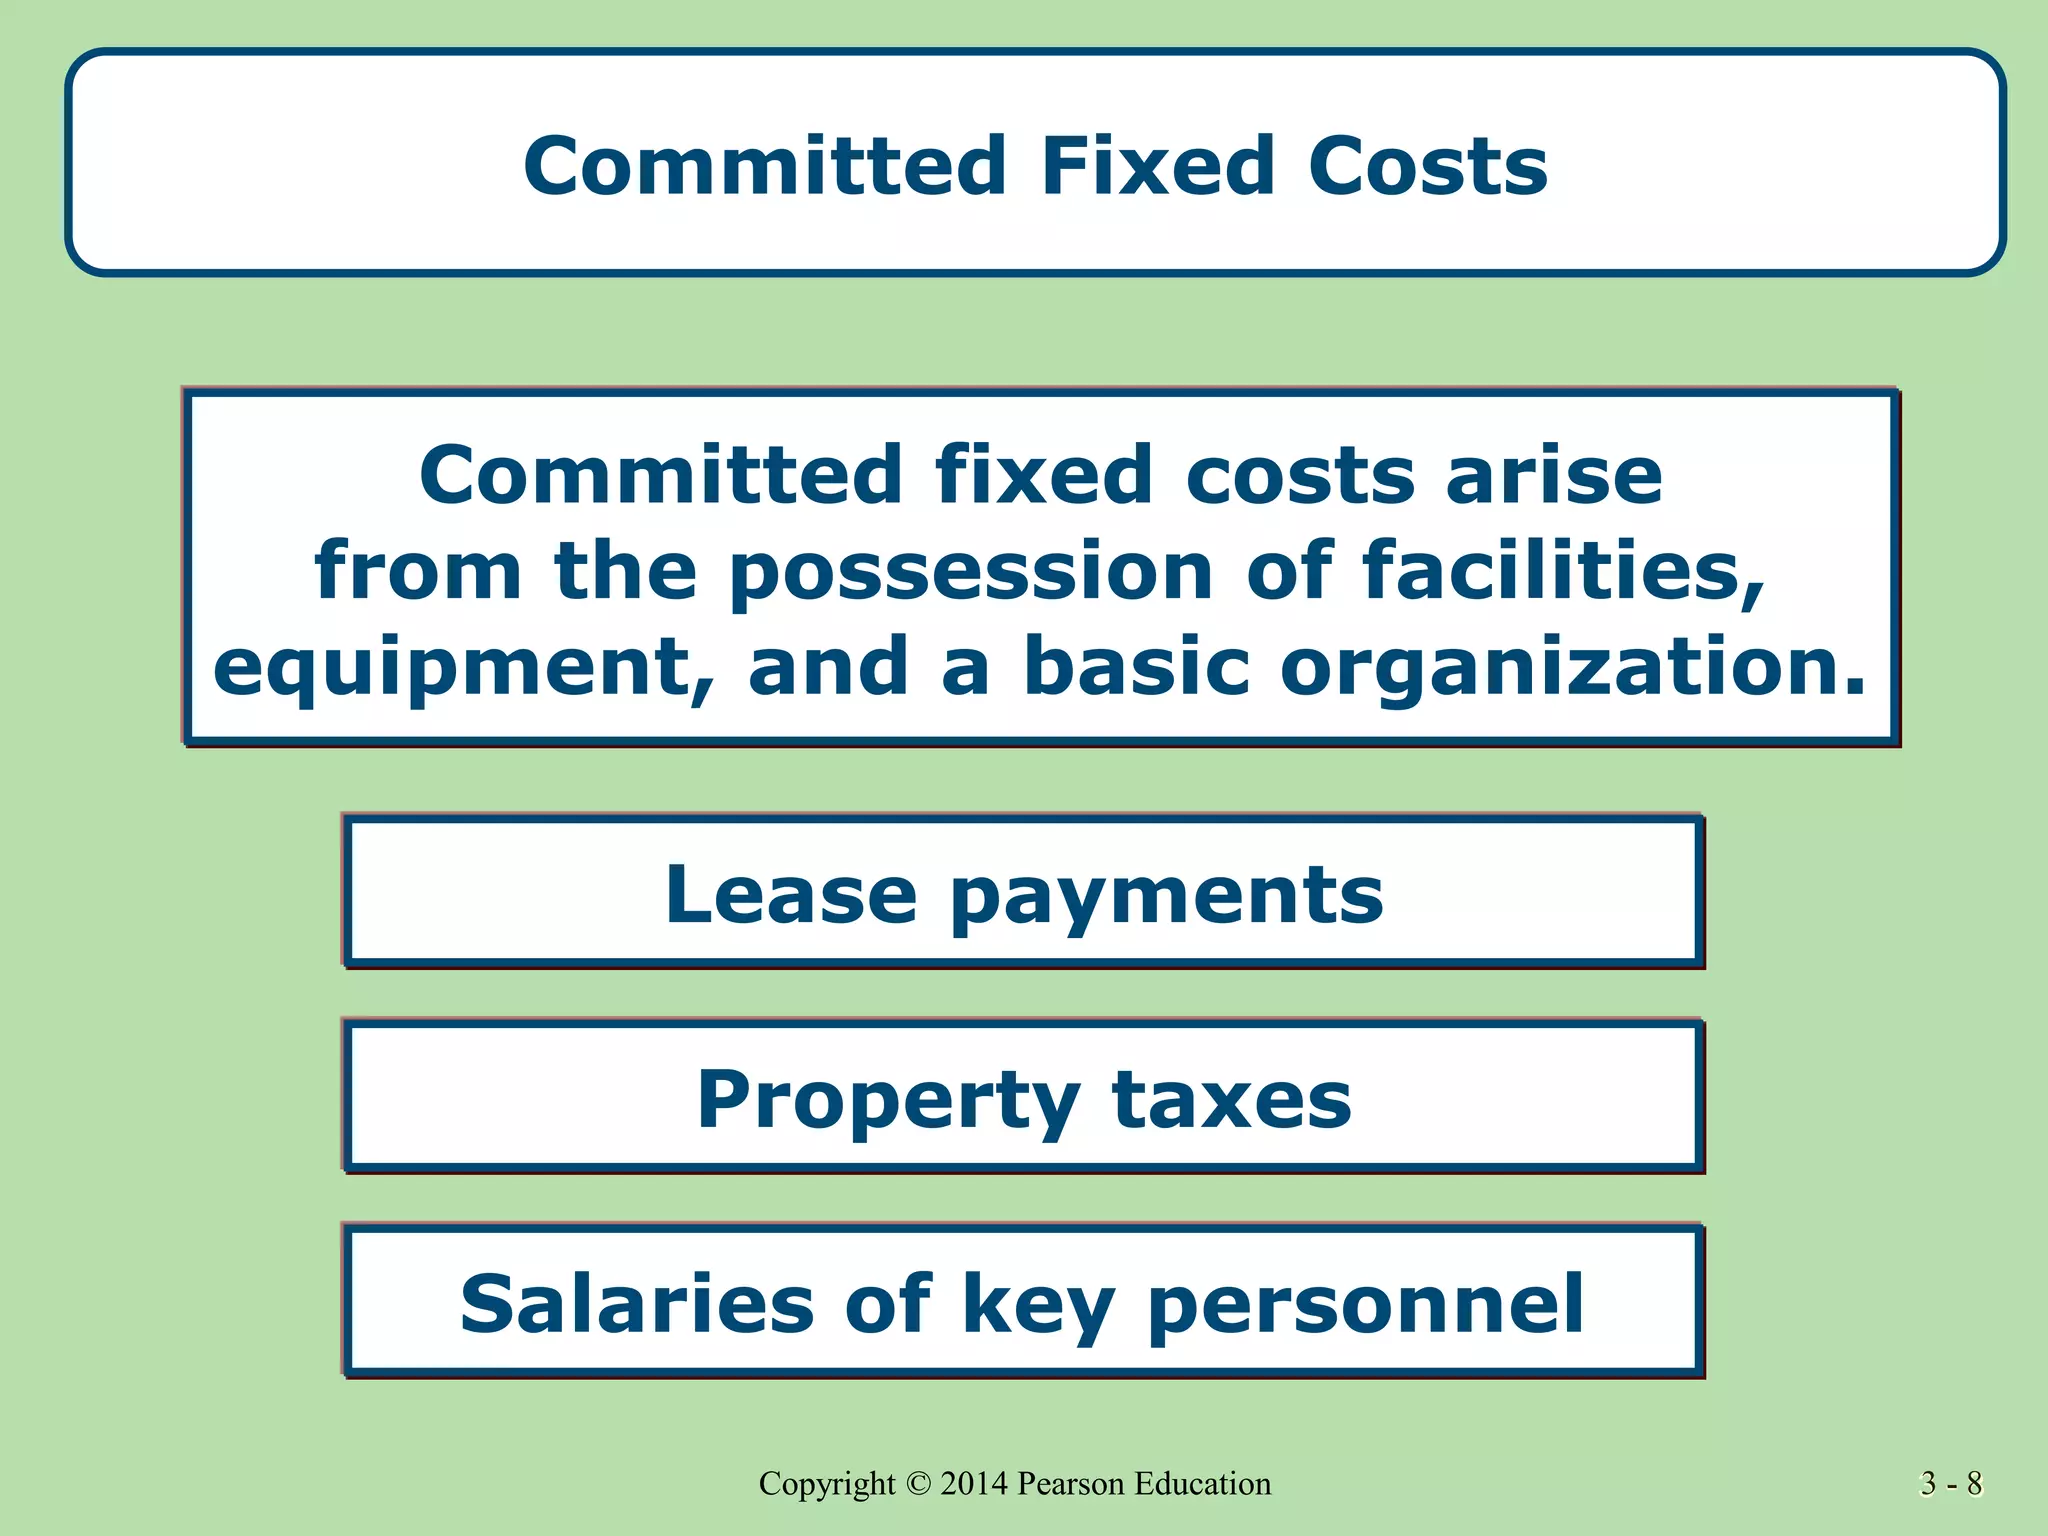
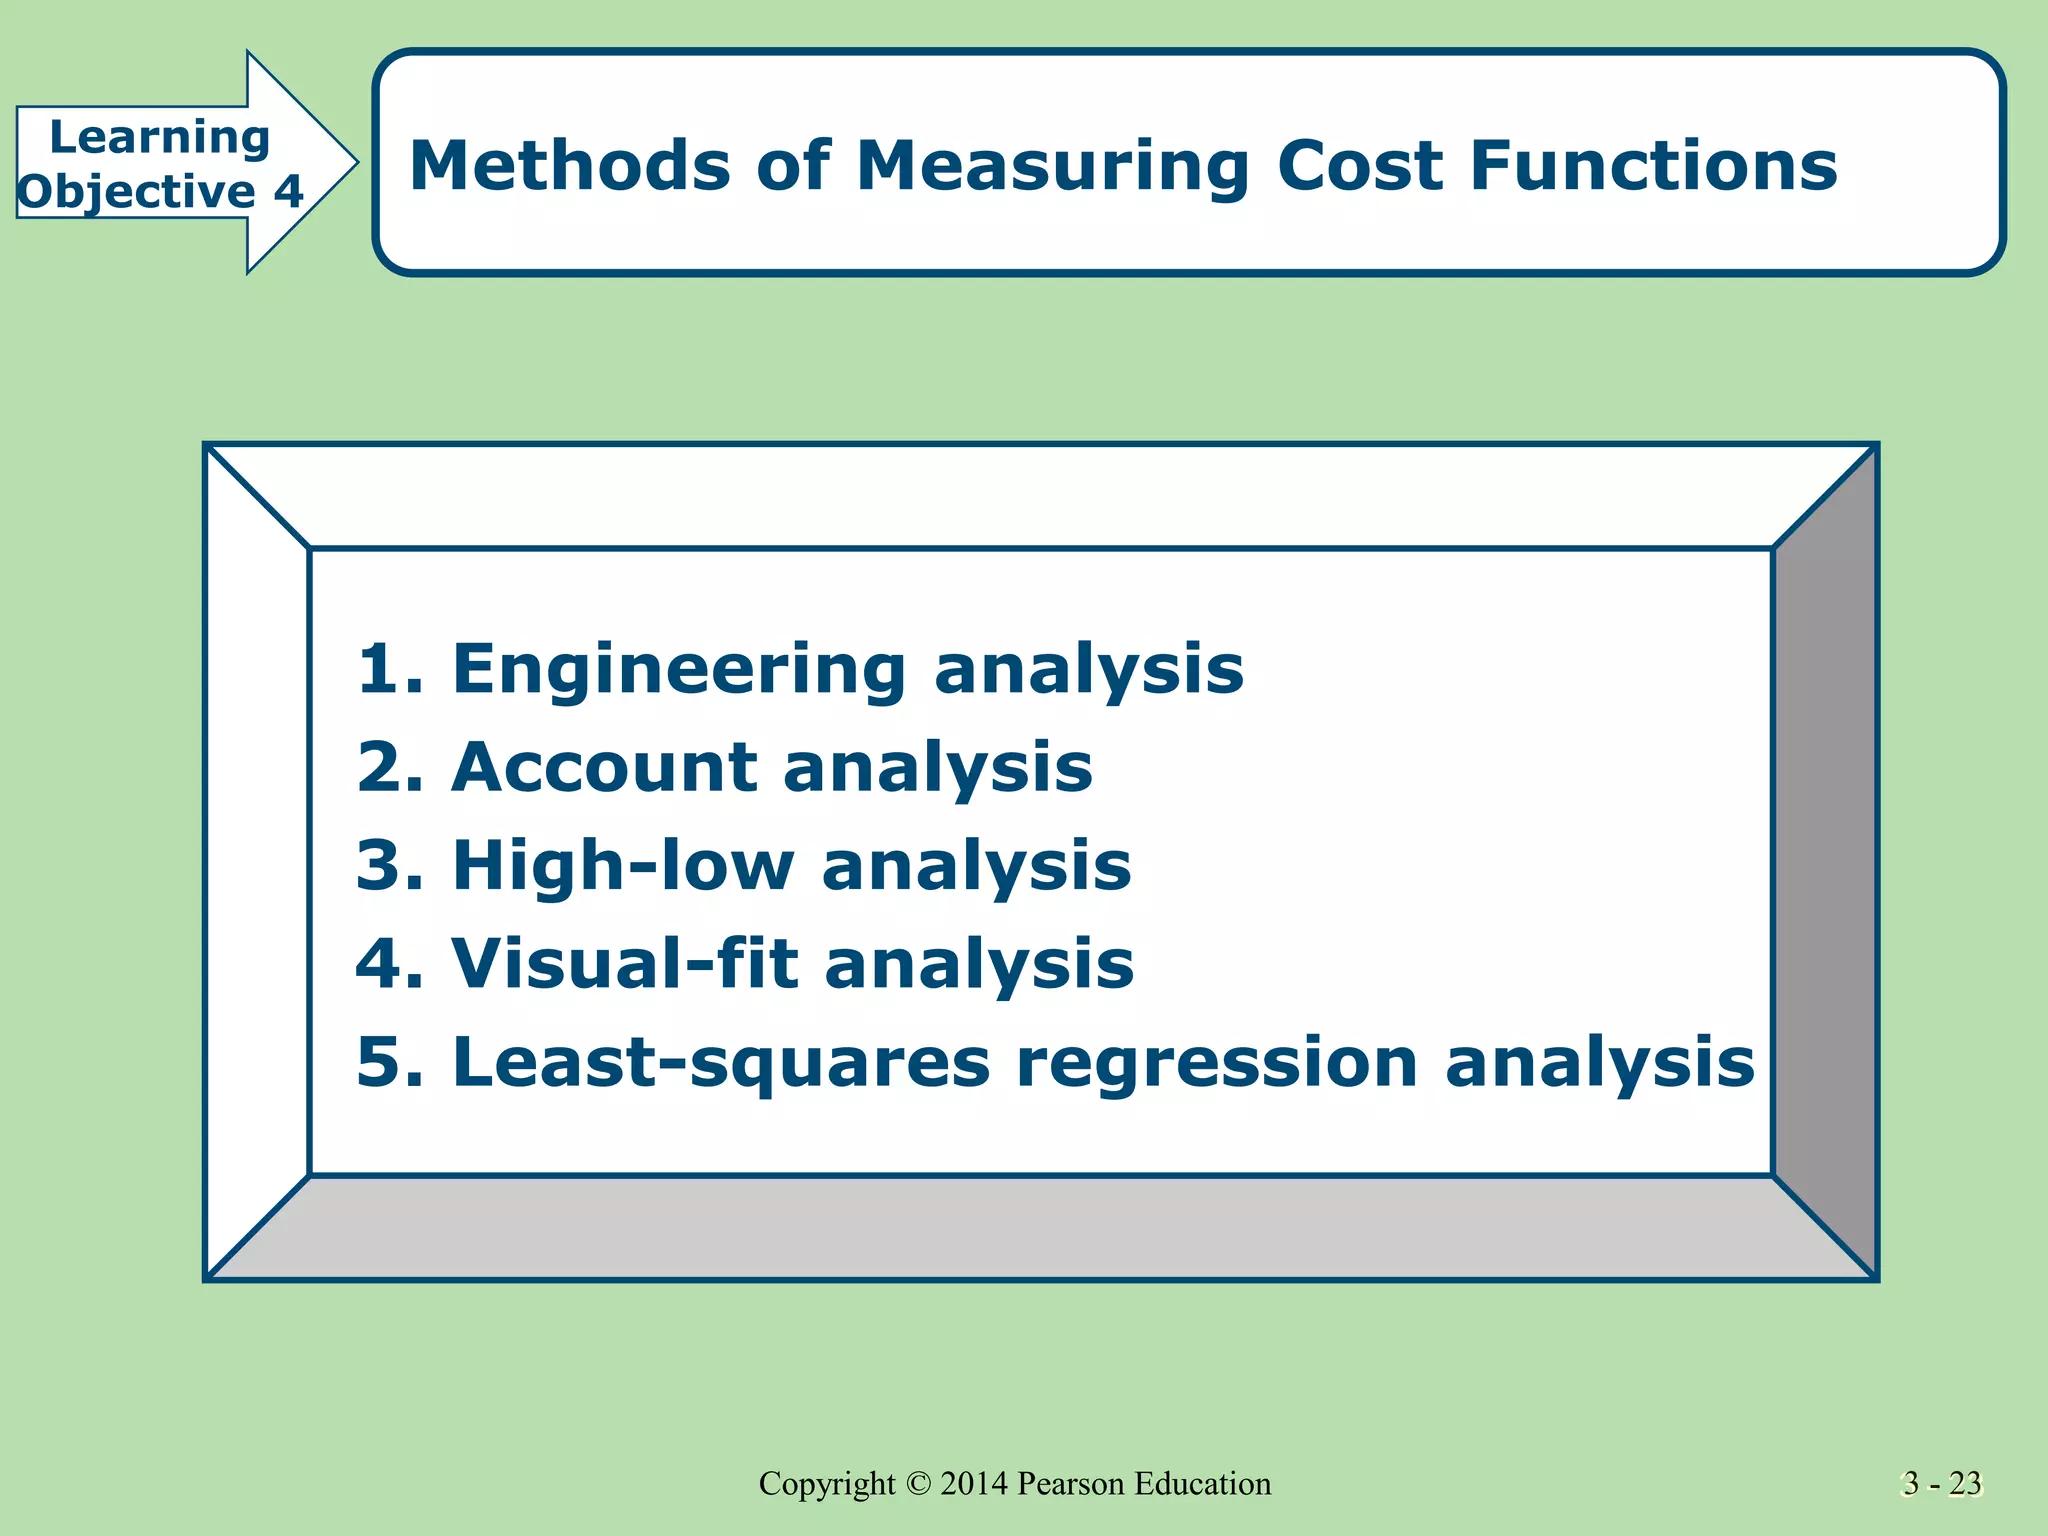
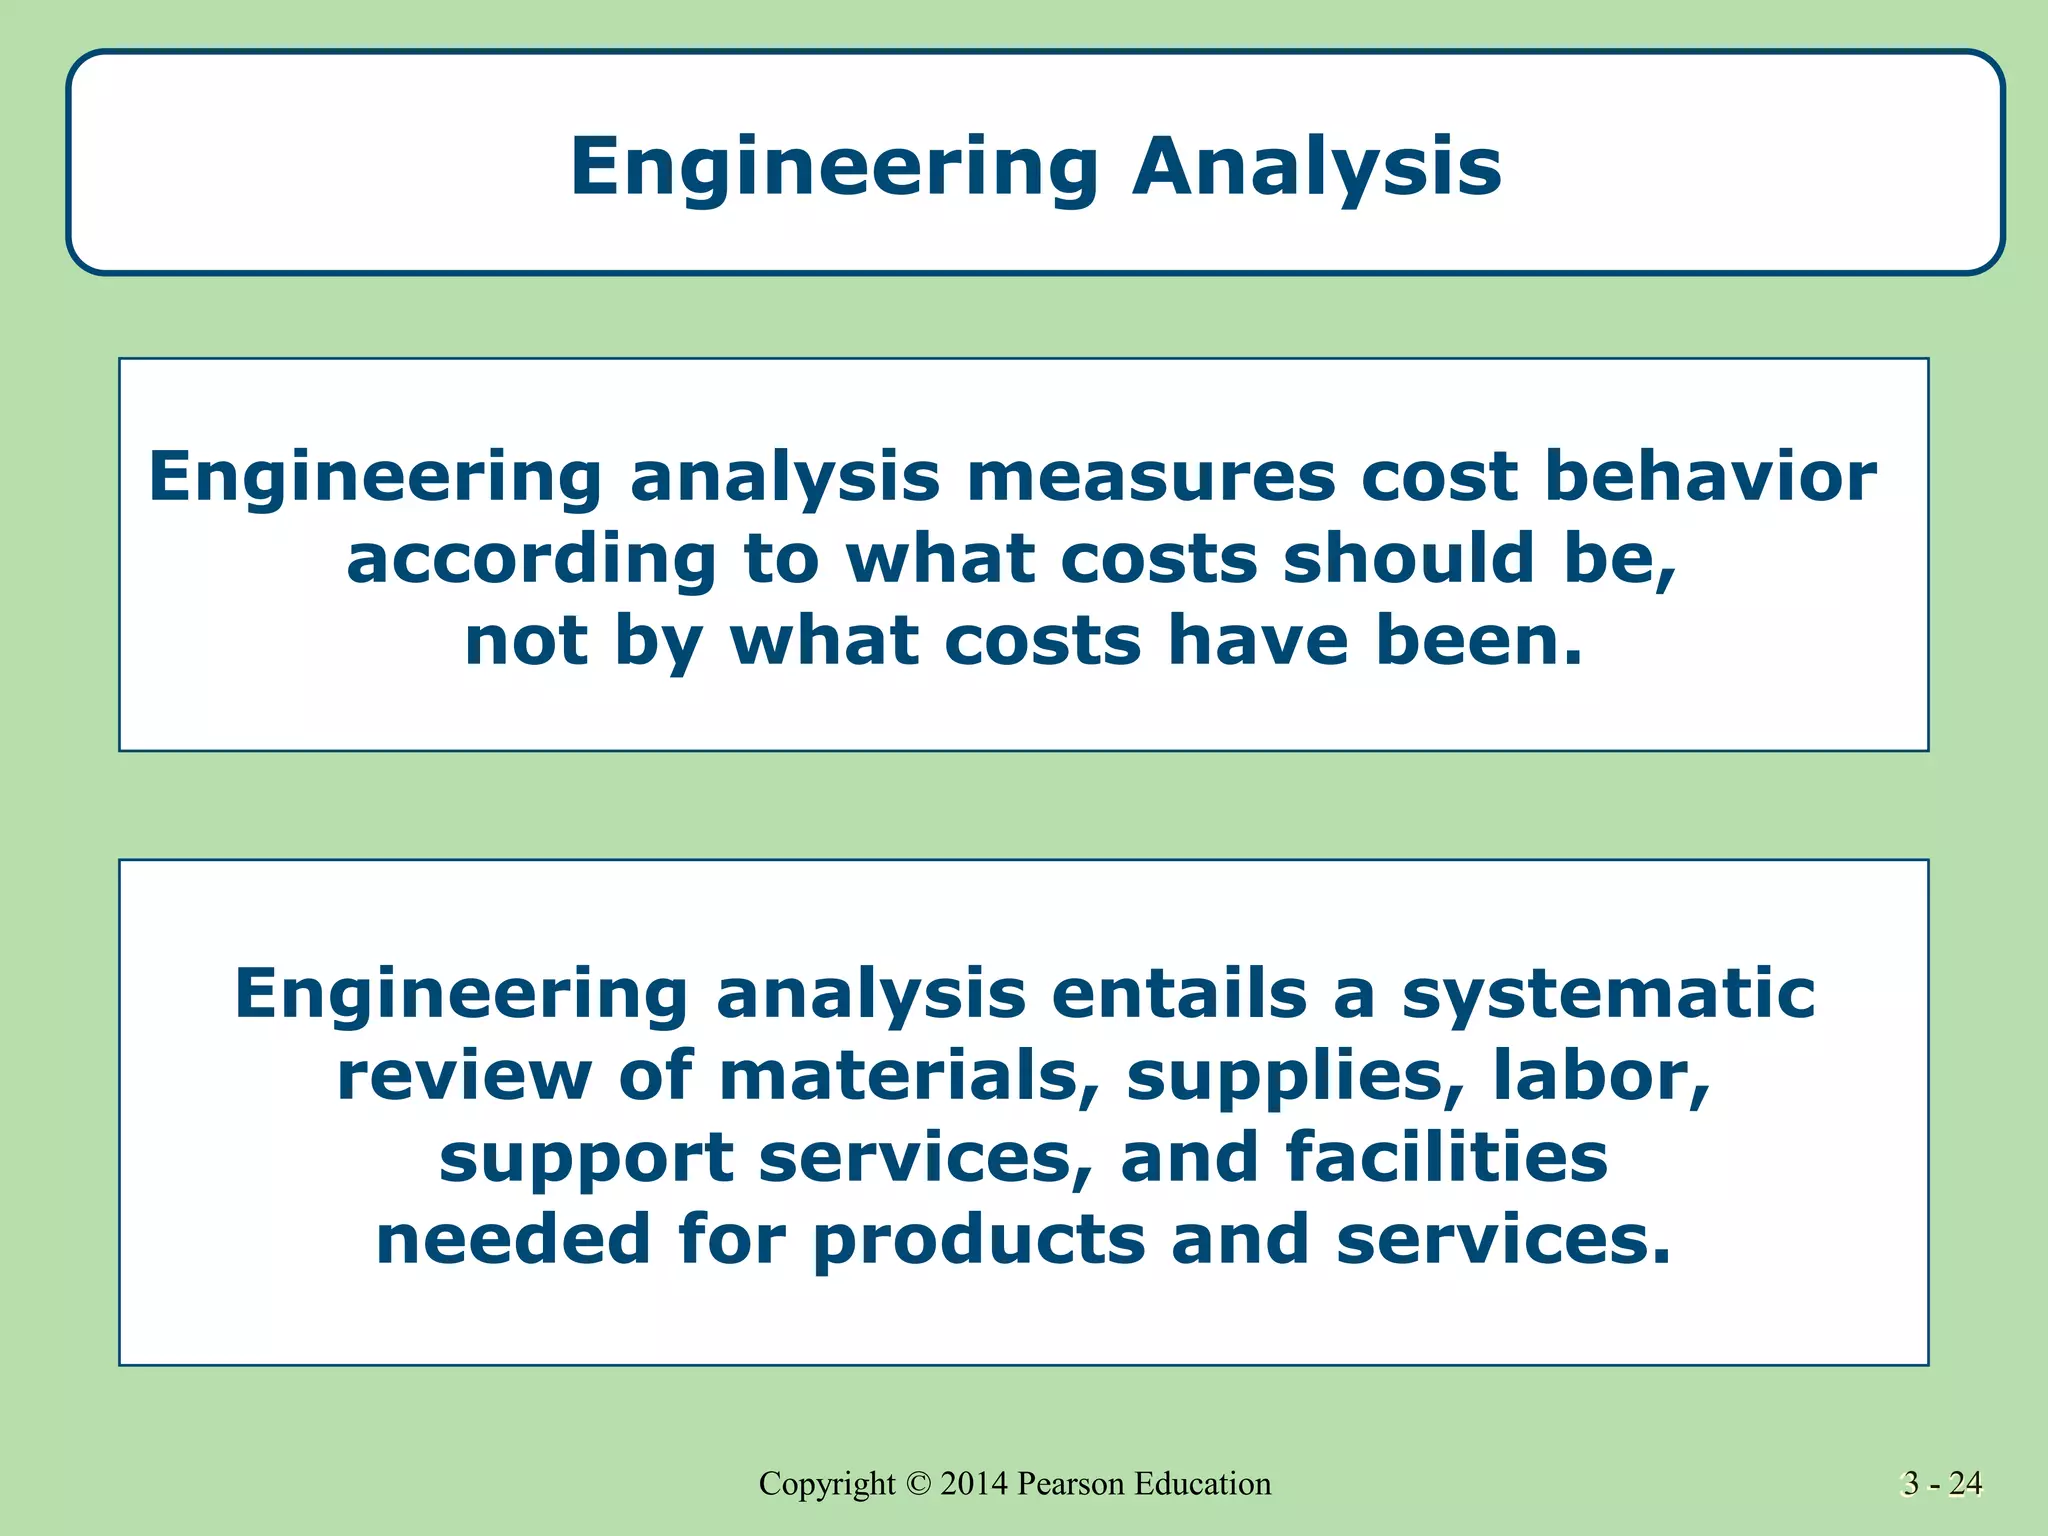
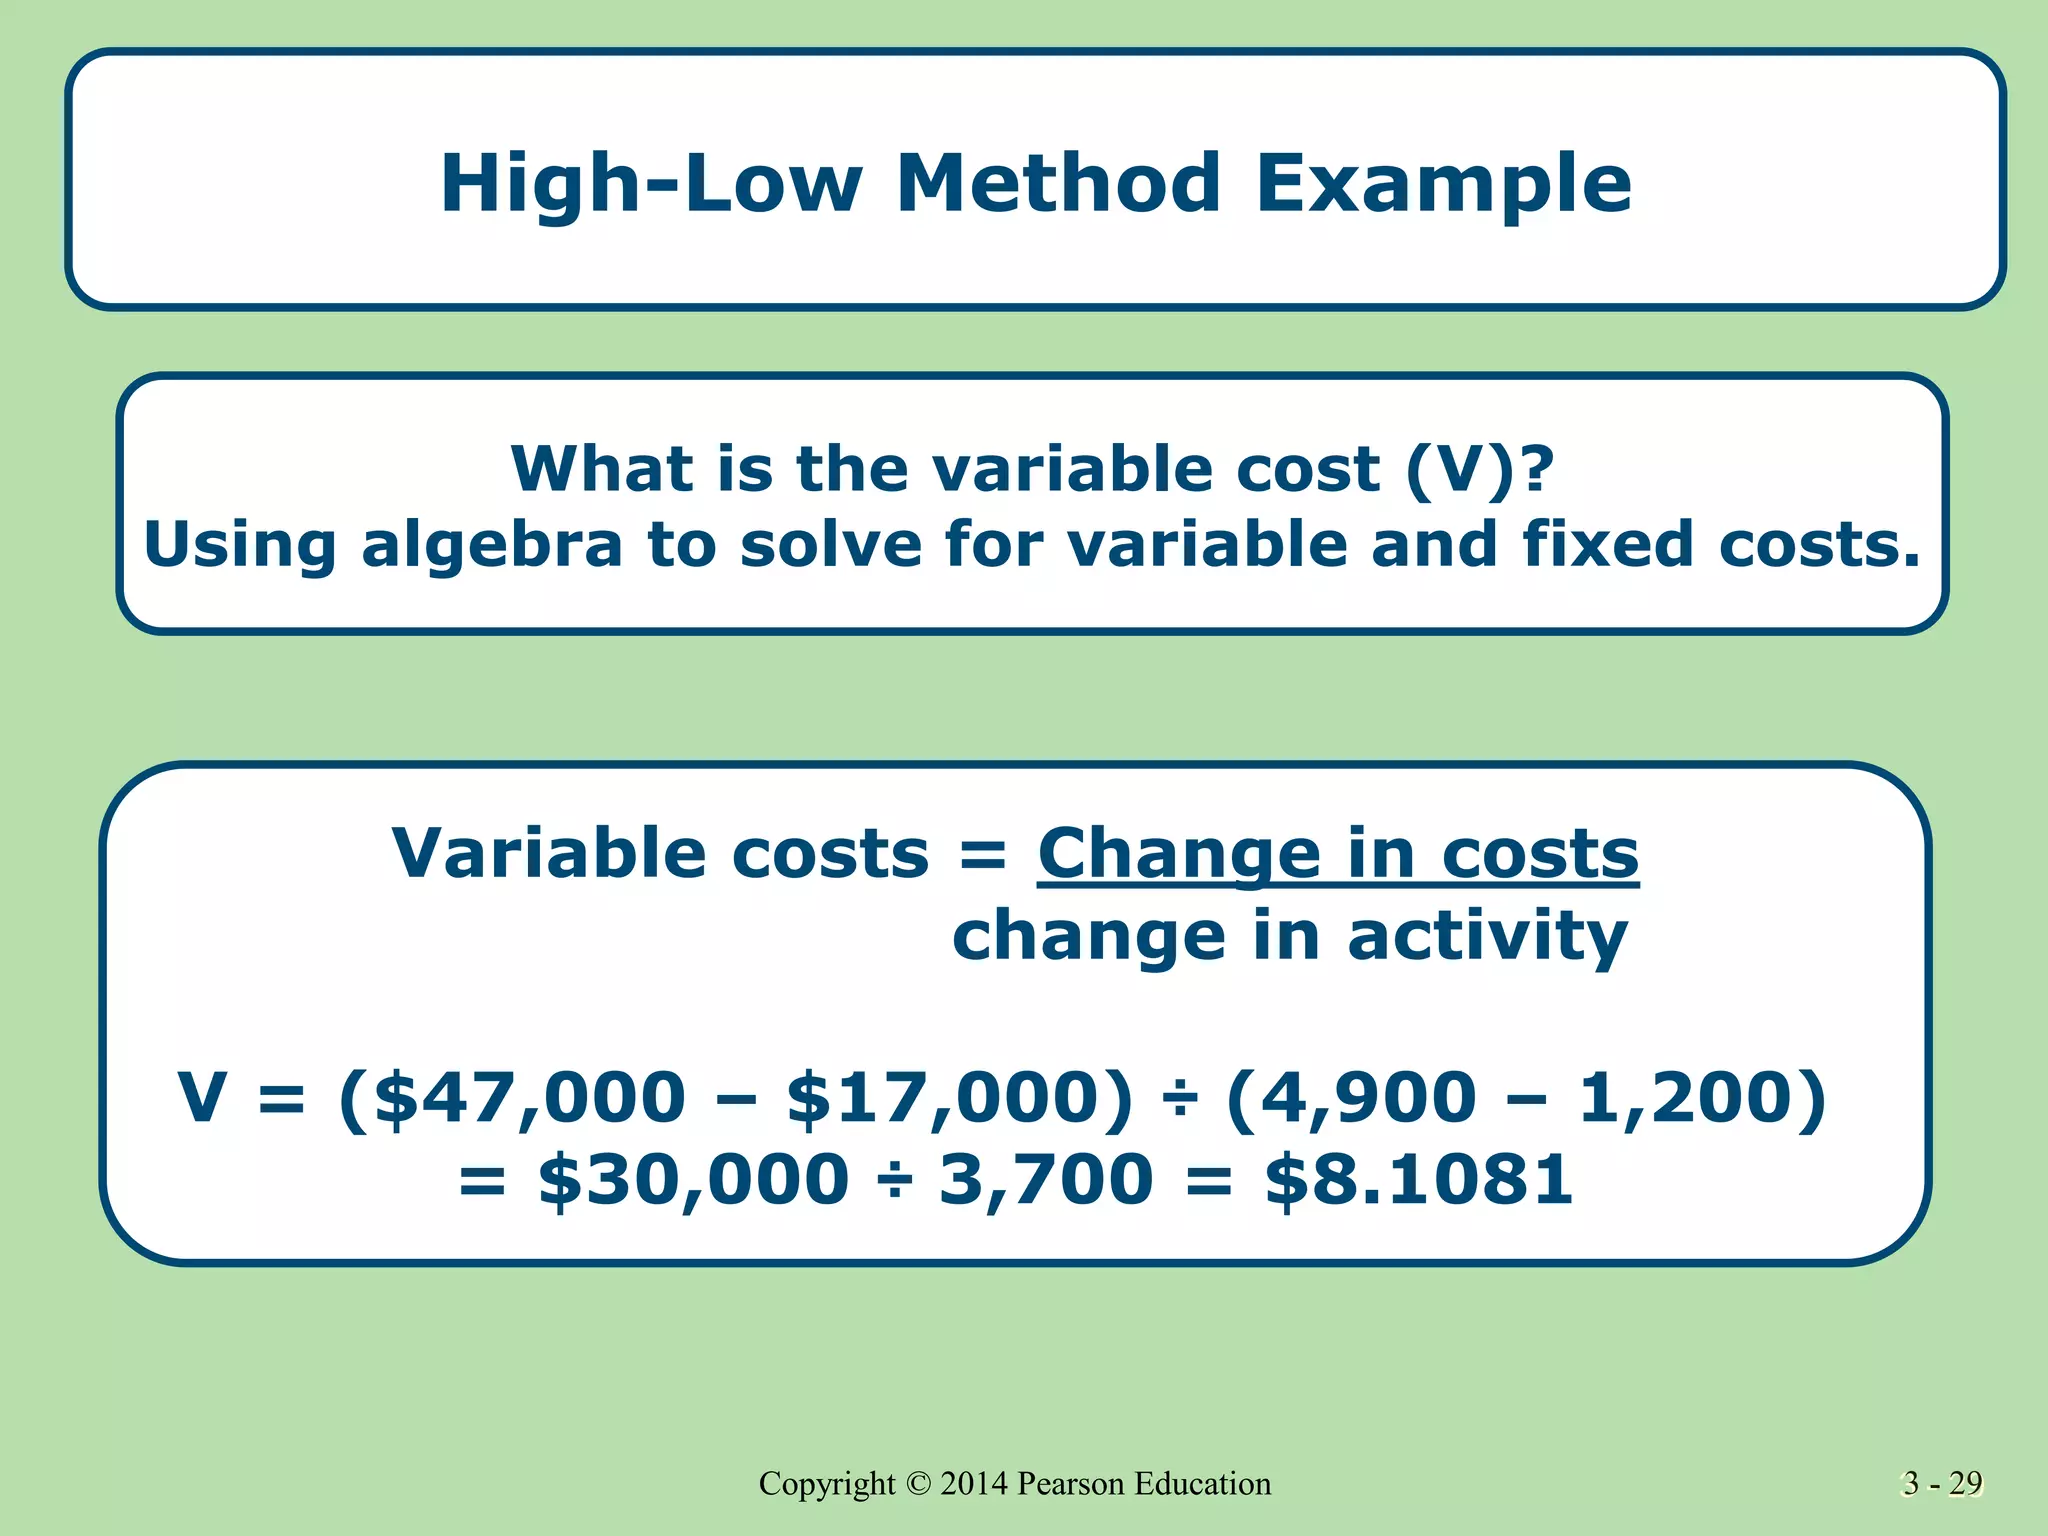
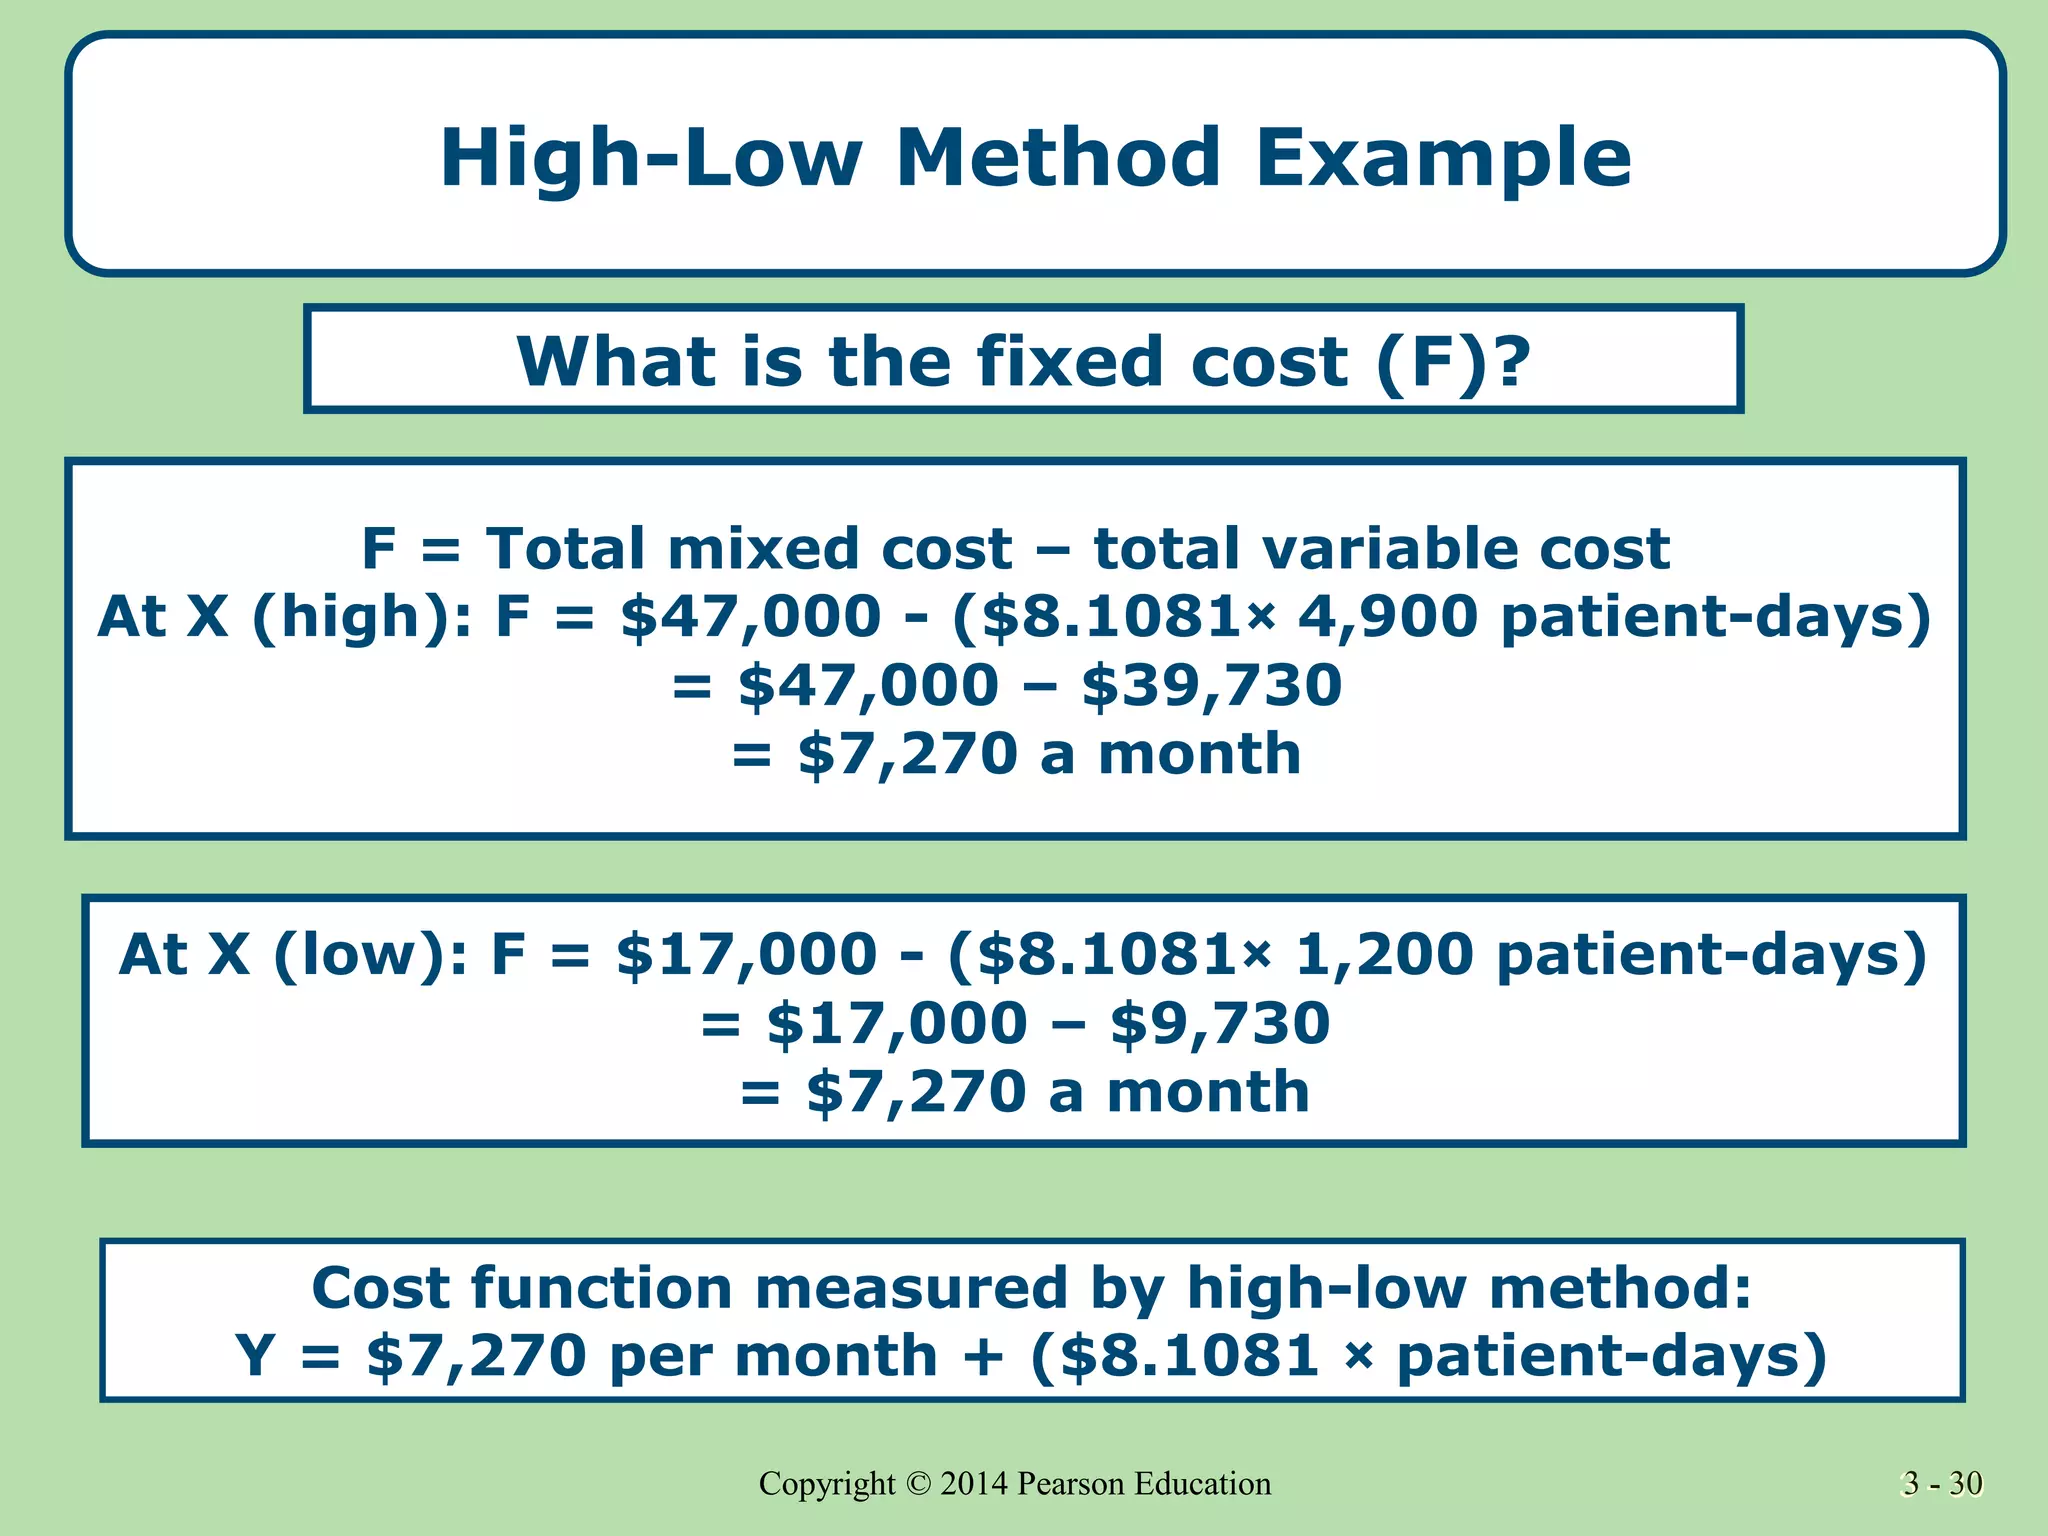
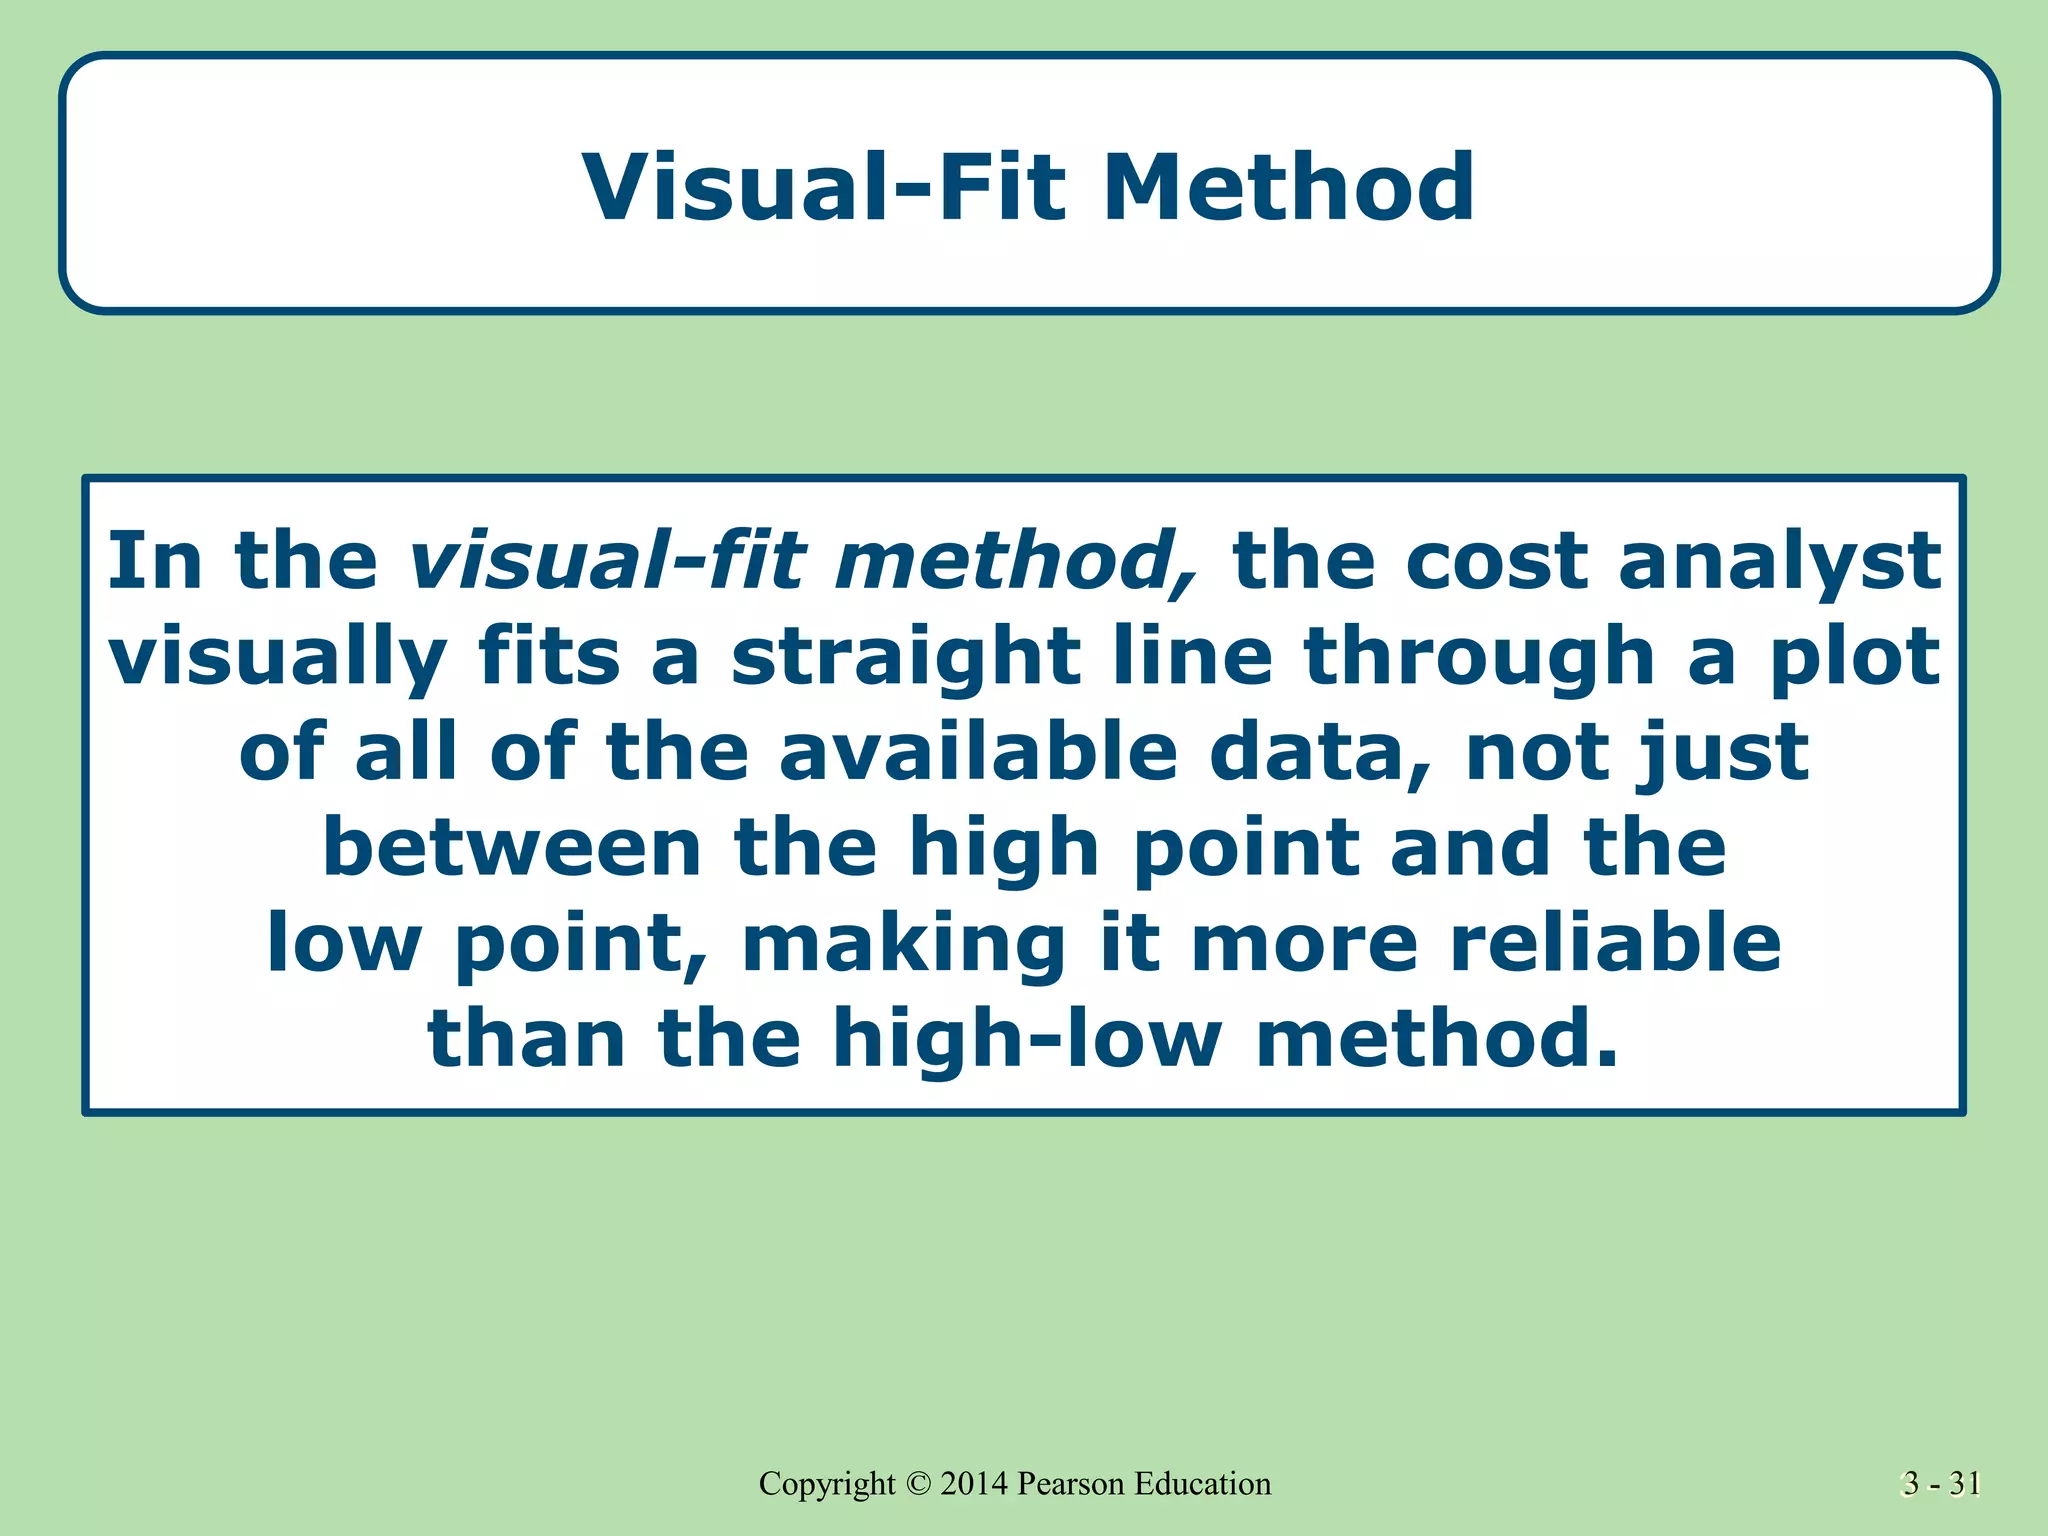
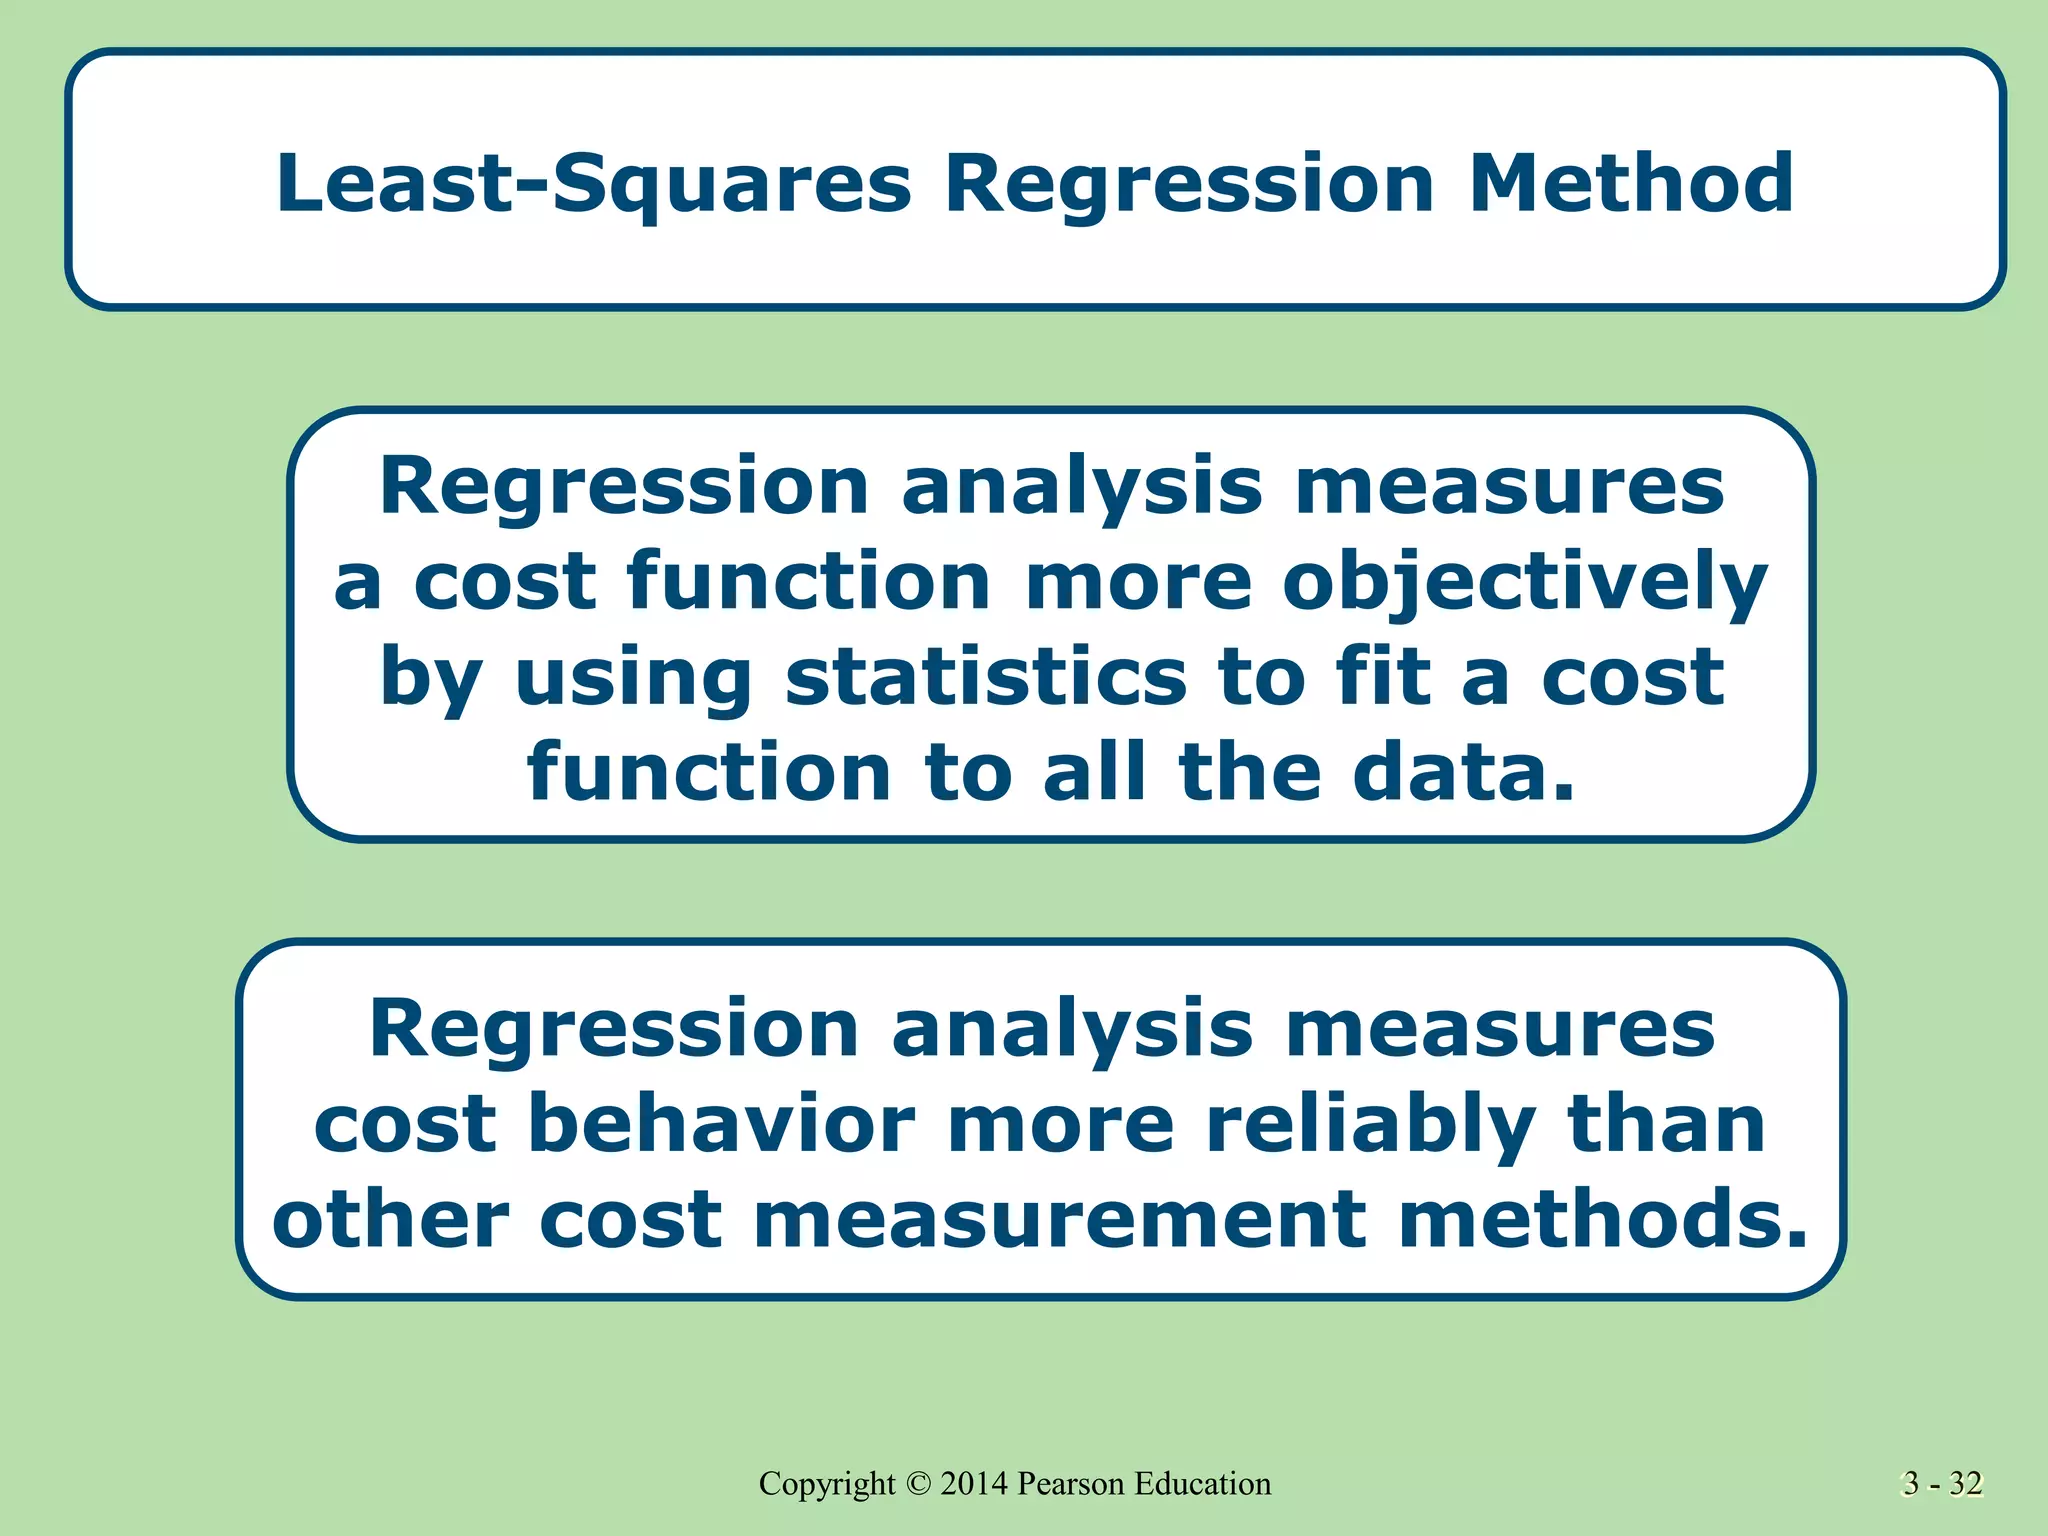
3 - 1
Copyright © 2014 Pearson Education 3 - 1
3 - 2
Copyright © 2014 Pearson Education 3 - 2
When you have finished studying this chapter, you
should be able to:
1. Explain management influences on cost behavior.
2. Measure and mathematically express cost functions
and use them to predict costs.
3. Describe the importance of activity analysis for
measuring cost functions.
4. Measure cost behavior using the engineering
analysis, high-low, visual-fit, and least-squares
regression methods .
3 - 3
Copyright © 2014 Pearson Education 3 - 3
Accountants and managers often assume that
cost behavior is linear over some relevant range
of activity or cost-driver levels.
We can graph linear-cost behavior with a straight
line because we assume each cost to be either
fixed or variable.
Recall that the relevant range specifies the
interval of cost-driver activity within which a
specific relationship between a cost and its driver
will be valid.
Managers usually define the relevant range
based on their previous experience operating the
organization at different levels of activity.
Cost Drivers and Cost Behavior
3 - 4
Copyright © 2014 Pearson Education 3 - 4
Linear-Cost Behavior
Costs are assumed to be fixed or variable
within the relevant range of activity
3 - 5
Copyright © 2014 Pearson Education 3 - 5
Policies to create incentives to control costs
Product and service decisions
and the value chain
Capacity
Technology
Learning
Objective 1 Management’s Influence on Cost Behavior
3 - 6
Copyright © 2014 Pearson Education 3 - 6
The Value Chain
Managers influence cost behavior throughout
the value chain through their choices of:
• process and product design,
•quality levels,
•product features,
•distribution channels, etc..
Each decision contributes to the organization’s
performance.
Managers must consider the costs and benefits
of each decision.
3 - 7
Copyright © 2014 Pearson Education 3 - 7
Capacity Decisions
They are the fixed costs of being able
to achieve a desired level of production or
to provide a desired level of service while
maintaining product or service attributes.
3 - 8
Copyright © 2014 Pearson Education 3 - 8
Committed Fixed Costs
Salaries of key personnel
Committed fixed costs arise
from the possession of facilities,
equipment, and a basic organization.
Lease payments
Property taxes
3 - 9
Copyright © 2014 Pearson Education 3 - 9
Discretionary Fixed Costs
Discretionary fixed costs are costs fixed at certain levels
only because management decided that these levels of cost
should be incurred to meet the organization’s goals.
These discretionary fixed costs have no obvious
relationship to levels of output activity but
are determined as part of the periodic planning process.
Each planning period, management will determine
how much to spend on discretionary items. These costs
then become fixed until the next planning period.
3 - 10
Copyright © 2014 Pearson Education 3 - 10
Examples of Committed
and Discretionary Fixed Costs
Fixed Costs Planned
Amounts
Advertising and promotion $ 50,000
Depreciation 400,000
Employee training 100,000
Management salaries 800,000
Mortgage payment 250,000
Property taxes 600,000
Research and development 1,500,000
Total $3,700,000
3 - 11
Copyright © 2014 Pearson Education 3 - 11
Examples of Committed
and Discretionary Fixed Costs
Fixed Costs Planned Amounts
Committed
Depreciation $ 400,000
Mortgage payment 250,000
Property taxes 600,000
Total committed $1,250,000
Discretionary (potential savings)
Advertising and promotion $ 50,000
Employee training 100,000
Management salaries 800,000
Research and development 1,500,000
Total discretionary $2,450,000
Total committed and discretionary $3,700,000
3 - 12
Copyright © 2014 Pearson Education 3 - 12
Technology Decisions
Choosing the type of technology an
organization will use to produce products
or deliver services is a critical decision
for management.
Choice of technology (e-commerce versus
in-store or mail-order sales) positions the
organization to meet its current goals and
to respond to changes in the environment.
The use of high-technology methods rather
than labor usually means a much greater
fixed-cost component to the total cost.
3 - 13
Copyright © 2014 Pearson Education 3 - 13
Cost-Control Incentives
Managers use their knowledge of
cost behavior to set cost expectations.
Employees may receive rewards that
are tied to meeting these expectations.
3 - 14
Copyright © 2014 Pearson Education 3 - 14
Cost Functions
Learning
Objective 2
Managers will use cost functions often as
a planning and control tool.
Planning and controlling the activities of
an organization require useful and
accurate estimates of future fixed and
variable costs.
Cost measurement involves estimating or
predicting costs as a function of
appropriate cost drivers.
3 - 15
Copyright © 2014 Pearson Education 3 - 15
Cost Functions
Understanding relationships between costs
and their cost drivers allows managers to...
Make better operating, marketing,
and production decisions
Plan and evaluate actions
Determine appropriate costs for
short-run and long-run decisions.
3 - 16
Copyright © 2014 Pearson Education 3 - 16
Cost Functions
The first step in estimating or predicting
costs is measuring cost behavior as a
function of appropriate cost drivers.
The second step is to use these cost
measures to estimate future costs at
expected levels of cost-driver activity.
3 - 17
Copyright © 2014 Pearson Education 3 - 17
Cost Function Equation
Let:
Y = Total cost
F = Fixed cost
V = Variable cost per unit
X = Cost-driver activity in number of units
Mixed-cost function:
Y = F + VX
Y = $10,000 + $5.00X
The mixed-cost function is called a linear-cost function.
3 - 18
Copyright © 2014 Pearson Education 3 - 18
Developing Cost Functions
A cost function’s estimates of costs
at actual levels of activity must reliably
conform with actually observed costs.
The cost function must be believable.
3 - 19
Copyright © 2014 Pearson Education 3 - 19
Choice of Cost Drivers: Activity Analysis
Choosing a cost function starts
with choosing cost drivers.
Managers use activity analysis to
identify appropriate cost drivers.
Activity analysis directs management
accountants to the appropriate
cost drivers for each cost.
Learning
Objective 3
3 - 20
Copyright © 2014 Pearson Education 3 - 20
Choice of Cost Drivers: Activity Analysis
Northwestern Computers makes two
products: Mozart-Plus and Powerdrive
In the past, most of the support costs
were twice as much as labor costs.
Northwest has upgraded the production
function, which has increased support
costs and reduced labor cost.
3 - 21
Copyright © 2014 Pearson Education 3 - 21
Choice of Cost Drivers: Activity Analysis
Using the old cost driver, labor cost, the
prediction of support costs would be:
Mozart-Plus Powerdrive
Labor cost $ 8.50 $130.00
Support cost:
2 × Direct labor
cost $17.00 $260.00
3 - 22
Copyright © 2014 Pearson Education 3 - 22
Choice of Cost Drivers: Activity Analysis
Using the more appropriate cost driver,
the number of components added to products,
companies can predict support costs more accurately.
Mozart-Plus Powerdrive
Support cost at $20
per component
$20 × 5 components $100.00
$20 × 9 components $180.00
Difference in predicted
support cost $ 83.00 $ 80.00
higher lower
Managers will make better decisions with this more
accurate information.
3 - 23
Copyright © 2014 Pearson Education 3 - 23
Methods of Measuring Cost Functions
1. Engineering analysis
2. Account analysis
3. High-low analysis
4. Visual-fit analysis
5. Least-squares regression analysis
Learning
Objective 4
3 - 24
Copyright © 2014 Pearson Education 3 - 24
Engineering Analysis
Engineering analysis measures cost behavior
according to what costs should be,
not by what costs have been.
Engineering analysis entails a systematic
review of materials, supplies, labor,
support services, and facilities
needed for products and services.
3 - 25
Copyright © 2014 Pearson Education 3 - 25
Account Analysis
The simplest method of account analysis selects a plausible
cost driver and classifies each account as a variable or fixed cost.
Supervisor’s salary and benefits $ 3,800 $3,800
Hourly workers’ wages and benefits 14,674 $14,674
Equipment depreciation and rentals 5,873 5,873
Equipment repairs 5,604 5,604
Cleaning supplies 7,472 7,472
Total maintenance costs $37,423 $9,673 $27,750
Monthly cost Amount Fixed Variable
Parkview Medical Center
3 - 26
Copyright © 2014 Pearson Education 3 - 26
Account Analysis Example
Fixed cost per month = $9,673
Variable cost per patient-day
= $27,750 ÷ 3,700
= $7.50 per patient-day
3,700 patient-days
Y = $9,673 + ($7.50 × patient-days)
3 - 27
Copyright © 2014 Pearson Education 3 - 27
High-Low Method
Focus on the highest- and lowest-activity points.
Plot historical data points on a graph.
High month: April
Maintenance cost: $47,000
Number of patient-days: 4,900
Low month: September
Maintenance cost: $17,000
Number of patient-days: 1,200
3 - 28
Copyright © 2014 Pearson Education 3 - 28
High-Low Method Example
The point at which the line intersects the Y axis is
the intercept, F, or estimate of Fixed Costs, and the
slope of the line measures the variable cost.
3 - 29
Copyright © 2014 Pearson Education 3 - 29
High-Low Method Example
Variable costs = Change in costs
change in activity
V = ($47,000 – $17,000) ÷ (4,900 – 1,200)
= $30,000 ÷ 3,700 = $8.1081
What is the variable cost (V)?
Using algebra to solve for variable and fixed costs.
3 - 30
Copyright © 2014 Pearson Education 3 - 30
High-Low Method Example
F = Total mixed cost – total variable cost
At X (high): F = $47,000 - ($8.1081× 4,900 patient-days)
= $47,000 – $39,730
= $7,270 a month
At X (low): F = $17,000 - ($8.1081× 1,200 patient-days)
= $17,000 – $9,730
= $7,270 a month
Cost function measured by high-low method:
Y = $7,270 per month + ($8.1081 × patient-days)
What is the fixed cost (F)?
3 - 31
Copyright © 2014 Pearson Education 3 - 31
Visual-Fit Method
In the visual-fit method, the cost analyst
visually fits a straight line through a plot
of all of the available data, not just
between the high point and the
low point, making it more reliable
than the high-low method.
3 - 32
Copyright © 2014 Pearson Education 3 - 32
Least-Squares Regression Method
Regression analysis measures
a cost function more objectively
by using statistics to fit a cost
function to all the data.
Regression analysis measures
cost behavior more reliably than
other cost measurement methods.
3 - 33
Copyright © 2014 Pearson Education 3 - 33
Least-Squares Regression Method
Y = $9,329 + ($6.951 × patient-days)
3 - 34
Copyright © 2014 Pearson Education 3 - 34
Coefficient of Determination
One measure of reliability,
or goodness of fit, is the
coefficient of determination,
R² (or R-squared).
The coefficient of determination
measures how much of the
fluctuation of a cost is explained
by changes in the cost driver.
3 - 35
Copyright © 2014 Pearson Education 3 - 35
All rights reserved. No part of this publication
may be reproduced, stored in a retrieval system,
or transmitted, in any form or by any means,
electronic, mechanical, photocopying, recording,
or otherwise, without the prior written permission
of the publisher. Printed in the United States of
America.

Measurement of Cost Behavior.ppt

  • 1.
    3 - 1 Copyright© 2014 Pearson Education 3 - 1
  • 2.
    3 - 2 Copyright© 2014 Pearson Education 3 - 2 When you have finished studying this chapter, you should be able to: 1. Explain management influences on cost behavior. 2. Measure and mathematically express cost functions and use them to predict costs. 3. Describe the importance of activity analysis for measuring cost functions. 4. Measure cost behavior using the engineering analysis, high-low, visual-fit, and least-squares regression methods .
  • 3.
    3 - 3 Copyright© 2014 Pearson Education 3 - 3 Accountants and managers often assume that cost behavior is linear over some relevant range of activity or cost-driver levels. We can graph linear-cost behavior with a straight line because we assume each cost to be either fixed or variable. Recall that the relevant range specifies the interval of cost-driver activity within which a specific relationship between a cost and its driver will be valid. Managers usually define the relevant range based on their previous experience operating the organization at different levels of activity. Cost Drivers and Cost Behavior
  • 4.
    3 - 4 Copyright© 2014 Pearson Education 3 - 4 Linear-Cost Behavior Costs are assumed to be fixed or variable within the relevant range of activity
  • 5.
    3 - 5 Copyright© 2014 Pearson Education 3 - 5 Policies to create incentives to control costs Product and service decisions and the value chain Capacity Technology Learning Objective 1 Management’s Influence on Cost Behavior
  • 6.
    3 - 6 Copyright© 2014 Pearson Education 3 - 6 The Value Chain Managers influence cost behavior throughout the value chain through their choices of: • process and product design, •quality levels, •product features, •distribution channels, etc.. Each decision contributes to the organization’s performance. Managers must consider the costs and benefits of each decision.
  • 7.
    3 - 7 Copyright© 2014 Pearson Education 3 - 7 Capacity Decisions They are the fixed costs of being able to achieve a desired level of production or to provide a desired level of service while maintaining product or service attributes.
  • 8.
    3 - 8 Copyright© 2014 Pearson Education 3 - 8 Committed Fixed Costs Salaries of key personnel Committed fixed costs arise from the possession of facilities, equipment, and a basic organization. Lease payments Property taxes
  • 9.
    3 - 9 Copyright© 2014 Pearson Education 3 - 9 Discretionary Fixed Costs Discretionary fixed costs are costs fixed at certain levels only because management decided that these levels of cost should be incurred to meet the organization’s goals. These discretionary fixed costs have no obvious relationship to levels of output activity but are determined as part of the periodic planning process. Each planning period, management will determine how much to spend on discretionary items. These costs then become fixed until the next planning period.
  • 10.
    3 - 10 Copyright© 2014 Pearson Education 3 - 10 Examples of Committed and Discretionary Fixed Costs Fixed Costs Planned Amounts Advertising and promotion $ 50,000 Depreciation 400,000 Employee training 100,000 Management salaries 800,000 Mortgage payment 250,000 Property taxes 600,000 Research and development 1,500,000 Total $3,700,000
  • 11.
    3 - 11 Copyright© 2014 Pearson Education 3 - 11 Examples of Committed and Discretionary Fixed Costs Fixed Costs Planned Amounts Committed Depreciation $ 400,000 Mortgage payment 250,000 Property taxes 600,000 Total committed $1,250,000 Discretionary (potential savings) Advertising and promotion $ 50,000 Employee training 100,000 Management salaries 800,000 Research and development 1,500,000 Total discretionary $2,450,000 Total committed and discretionary $3,700,000
  • 12.
    3 - 12 Copyright© 2014 Pearson Education 3 - 12 Technology Decisions Choosing the type of technology an organization will use to produce products or deliver services is a critical decision for management. Choice of technology (e-commerce versus in-store or mail-order sales) positions the organization to meet its current goals and to respond to changes in the environment. The use of high-technology methods rather than labor usually means a much greater fixed-cost component to the total cost.
  • 13.
    3 - 13 Copyright© 2014 Pearson Education 3 - 13 Cost-Control Incentives Managers use their knowledge of cost behavior to set cost expectations. Employees may receive rewards that are tied to meeting these expectations.
  • 14.
    3 - 14 Copyright© 2014 Pearson Education 3 - 14 Cost Functions Learning Objective 2 Managers will use cost functions often as a planning and control tool. Planning and controlling the activities of an organization require useful and accurate estimates of future fixed and variable costs. Cost measurement involves estimating or predicting costs as a function of appropriate cost drivers.
  • 15.
    3 - 15 Copyright© 2014 Pearson Education 3 - 15 Cost Functions Understanding relationships between costs and their cost drivers allows managers to... Make better operating, marketing, and production decisions Plan and evaluate actions Determine appropriate costs for short-run and long-run decisions.
  • 16.
    3 - 16 Copyright© 2014 Pearson Education 3 - 16 Cost Functions The first step in estimating or predicting costs is measuring cost behavior as a function of appropriate cost drivers. The second step is to use these cost measures to estimate future costs at expected levels of cost-driver activity.
  • 17.
    3 - 17 Copyright© 2014 Pearson Education 3 - 17 Cost Function Equation Let: Y = Total cost F = Fixed cost V = Variable cost per unit X = Cost-driver activity in number of units Mixed-cost function: Y = F + VX Y = $10,000 + $5.00X The mixed-cost function is called a linear-cost function.
  • 18.
    3 - 18 Copyright© 2014 Pearson Education 3 - 18 Developing Cost Functions A cost function’s estimates of costs at actual levels of activity must reliably conform with actually observed costs. The cost function must be believable.
  • 19.
    3 - 19 Copyright© 2014 Pearson Education 3 - 19 Choice of Cost Drivers: Activity Analysis Choosing a cost function starts with choosing cost drivers. Managers use activity analysis to identify appropriate cost drivers. Activity analysis directs management accountants to the appropriate cost drivers for each cost. Learning Objective 3
  • 20.
    3 - 20 Copyright© 2014 Pearson Education 3 - 20 Choice of Cost Drivers: Activity Analysis Northwestern Computers makes two products: Mozart-Plus and Powerdrive In the past, most of the support costs were twice as much as labor costs. Northwest has upgraded the production function, which has increased support costs and reduced labor cost.
  • 21.
    3 - 21 Copyright© 2014 Pearson Education 3 - 21 Choice of Cost Drivers: Activity Analysis Using the old cost driver, labor cost, the prediction of support costs would be: Mozart-Plus Powerdrive Labor cost $ 8.50 $130.00 Support cost: 2 × Direct labor cost $17.00 $260.00
  • 22.
    3 - 22 Copyright© 2014 Pearson Education 3 - 22 Choice of Cost Drivers: Activity Analysis Using the more appropriate cost driver, the number of components added to products, companies can predict support costs more accurately. Mozart-Plus Powerdrive Support cost at $20 per component $20 × 5 components $100.00 $20 × 9 components $180.00 Difference in predicted support cost $ 83.00 $ 80.00 higher lower Managers will make better decisions with this more accurate information.
  • 23.
    3 - 23 Copyright© 2014 Pearson Education 3 - 23 Methods of Measuring Cost Functions 1. Engineering analysis 2. Account analysis 3. High-low analysis 4. Visual-fit analysis 5. Least-squares regression analysis Learning Objective 4
  • 24.
    3 - 24 Copyright© 2014 Pearson Education 3 - 24 Engineering Analysis Engineering analysis measures cost behavior according to what costs should be, not by what costs have been. Engineering analysis entails a systematic review of materials, supplies, labor, support services, and facilities needed for products and services.
  • 25.
    3 - 25 Copyright© 2014 Pearson Education 3 - 25 Account Analysis The simplest method of account analysis selects a plausible cost driver and classifies each account as a variable or fixed cost. Supervisor’s salary and benefits $ 3,800 $3,800 Hourly workers’ wages and benefits 14,674 $14,674 Equipment depreciation and rentals 5,873 5,873 Equipment repairs 5,604 5,604 Cleaning supplies 7,472 7,472 Total maintenance costs $37,423 $9,673 $27,750 Monthly cost Amount Fixed Variable Parkview Medical Center
  • 26.
    3 - 26 Copyright© 2014 Pearson Education 3 - 26 Account Analysis Example Fixed cost per month = $9,673 Variable cost per patient-day = $27,750 ÷ 3,700 = $7.50 per patient-day 3,700 patient-days Y = $9,673 + ($7.50 × patient-days)
  • 27.
    3 - 27 Copyright© 2014 Pearson Education 3 - 27 High-Low Method Focus on the highest- and lowest-activity points. Plot historical data points on a graph. High month: April Maintenance cost: $47,000 Number of patient-days: 4,900 Low month: September Maintenance cost: $17,000 Number of patient-days: 1,200
  • 28.
    3 - 28 Copyright© 2014 Pearson Education 3 - 28 High-Low Method Example The point at which the line intersects the Y axis is the intercept, F, or estimate of Fixed Costs, and the slope of the line measures the variable cost.
  • 29.
    3 - 29 Copyright© 2014 Pearson Education 3 - 29 High-Low Method Example Variable costs = Change in costs change in activity V = ($47,000 – $17,000) ÷ (4,900 – 1,200) = $30,000 ÷ 3,700 = $8.1081 What is the variable cost (V)? Using algebra to solve for variable and fixed costs.
  • 30.
    3 - 30 Copyright© 2014 Pearson Education 3 - 30 High-Low Method Example F = Total mixed cost – total variable cost At X (high): F = $47,000 - ($8.1081× 4,900 patient-days) = $47,000 – $39,730 = $7,270 a month At X (low): F = $17,000 - ($8.1081× 1,200 patient-days) = $17,000 – $9,730 = $7,270 a month Cost function measured by high-low method: Y = $7,270 per month + ($8.1081 × patient-days) What is the fixed cost (F)?
  • 31.
    3 - 31 Copyright© 2014 Pearson Education 3 - 31 Visual-Fit Method In the visual-fit method, the cost analyst visually fits a straight line through a plot of all of the available data, not just between the high point and the low point, making it more reliable than the high-low method.
  • 32.
    3 - 32 Copyright© 2014 Pearson Education 3 - 32 Least-Squares Regression Method Regression analysis measures a cost function more objectively by using statistics to fit a cost function to all the data. Regression analysis measures cost behavior more reliably than other cost measurement methods.
  • 33.
    3 - 33 Copyright© 2014 Pearson Education 3 - 33 Least-Squares Regression Method Y = $9,329 + ($6.951 × patient-days)
  • 34.
    3 - 34 Copyright© 2014 Pearson Education 3 - 34 Coefficient of Determination One measure of reliability, or goodness of fit, is the coefficient of determination, R² (or R-squared). The coefficient of determination measures how much of the fluctuation of a cost is explained by changes in the cost driver.
  • 35.
    3 - 35 Copyright© 2014 Pearson Education 3 - 35 All rights reserved. No part of this publication may be reproduced, stored in a retrieval system, or transmitted, in any form or by any means, electronic, mechanical, photocopying, recording, or otherwise, without the prior written permission of the publisher. Printed in the United States of America.