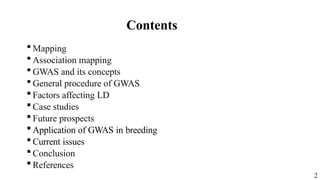
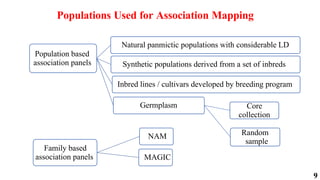
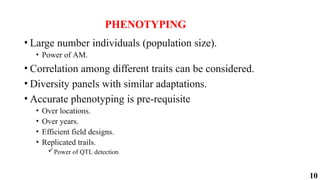
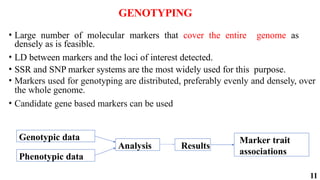
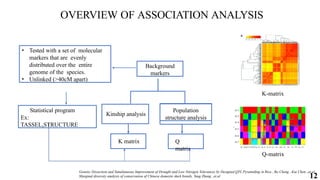
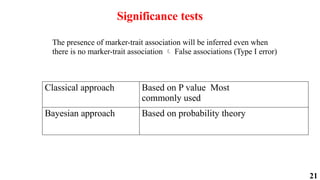
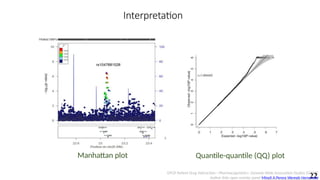
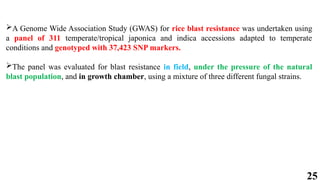
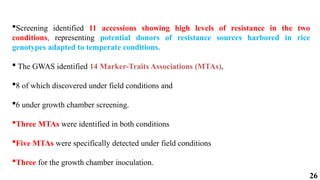
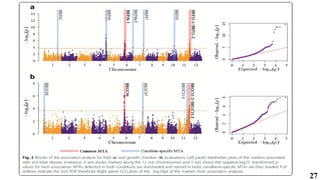
The document presents a detailed overview of genome-wide association studies (GWAS), focusing on mapping techniques, processes, case studies, and applications in plant breeding. It covers concepts such as linkage mapping, association mapping, factors influencing linkage disequilibrium, and the importance of accurate phenotyping and genotyping. Additionally, it discusses current issues in the field and future prospects for GWAS in genetic improvement and breeding strategies.

![42
References
Abdukarimov Ibrokhim Y. Abdurakhmonov and Abdusattor Application of Association Mapping to
Understanding the Genetic Diversity of Plant Germplasm Resources [Journal] // International Journal of Plant
Genomics. - 2008.
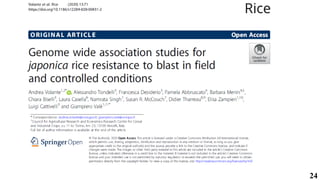
Andrea Volante Alessandro Tondelli Francesca Desiderio , Pamela Abbruscato, Barbara Menin
Genome wide association studies for japonica rice resistance to blast in field and controlled conditions
[Journal]. - [s.l.] : Rice, 2020.
B.D.singh and A.K.Singh Marker-Assisted Plant Breeding: Principles and practices [Book]. - New Delhi
Heidelberg New York Dordrecht London : Springer , 2015. - pp. 185-255.
Kenji Yano et.al. GWAS with principal component analysis identifies a gene comprehensively
controlling rice architecture [Journal]. - [s.l.] : PNAS, 2019.
Leila Nayyeriprasad Ghasim Ali garoosi , Asadollah Ahmadikhah Genome-Wide Association Study
(GWAS) to Identify Salt-Tolerance QTLs Carrying Novel Candidate Genes in Rice During Early Vegetative
Stage [Journal]. - [s.l.] : Rice, 2021.](https://image.slidesharecdn.com/abdulmuqsithdoctorialseminari-241223135653-d088f96b/85/Genome-Wide-Association-Studies-GWAS-for-Crop-Improvement-42-320.jpg)
![43
References
Molecular Plant Shanghai Editorial Office Genome-wide Association Studies in Rice: How to Solve the Low
Power Problems? [Journal] Cell Press. - 2018.
Peter M. Visscher 1,2,Matthew A. Brown,1 Mark I. McCarthy,3,4 and Jian Yang5 Five Years of GWAS
Discovery [Journal] The American Journal of Human Genetics. - 2012.
Peter M. Visscher 1,2,Naomi R. Wray,1,2 Qian Zhang,1 Pamela Sklar,3 Mark I. McCarthy,4,5,6 10 Years of
GWAS Discovery: Biology, Function, and Translation [Journal] The American Journal of Human Genetics. - 2017.
Samuel Crowell1 Pavel Korniliev2 Alexandre Falca˜o3, Abdelbagi Ismail4, Glenn Gregorio5, Jason
Mezey2 Genome-wide association and high-resolution phenotyping link Oryza sativa panicle traits to numerous
trait-specific QTL clusters [Journal] nature COMMUNICATINS. - 2016.
Wang1 Qin [et al.] Advances in genome-wide association studies of complex traits in rice [Journal] //
Theoritical and Applied Genetics. - 2019.
Xuehui Huang1 2,10, Xinghua Wei3,10, Tao Sang4,10, Qiang Zhao1,2,10, Qi Feng1,10, Yan Zhao1,
Canyang Li1, Genome-wide association studies of 14 agronomic traits in rice landraces [Journal] // nature
genetics. - 2010. - Vol. 42. - pp. 961-967.](https://image.slidesharecdn.com/abdulmuqsithdoctorialseminari-241223135653-d088f96b/85/Genome-Wide-Association-Studies-GWAS-for-Crop-Improvement-43-320.jpg)