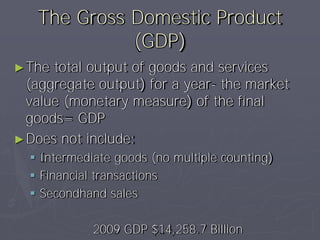
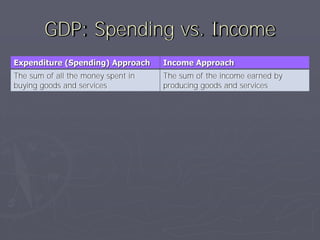
2. Assessing the Economy’s
Performance
Who does it? The Bureau of Economic Analysis
What do they do?
1. assess the health of the econ by comparing
levels of production at regular intervals
2. Track the long-run course of the economy to see
whether it has grown, been constant, or declined
3. Formulate policies that will safeguard and
improve the economy’s health
3. The Gross Domestic Product
(GDP)
► The total output of goods and services
(aggregate output) for a year- the market
value (monetary measure) of the final
goods= GDP
► Does not include:
Intermediate goods (no multiple counting)
Financial transactions
Secondhand sales
2009 GDP $14,258.7 Billion
4. GDP: Spending vs. Income
Expenditure (Spending) Approach Income Approach
The sum of all the money spent in The sum of the income earned by
buying goods and services producing goods and services
5. The Expenditures Approach
GDP= C+Ig+G+Xn
C= Consumer expenditures on durable
goods, nondurable goods, and services
(households)
**67-70% of GDP = targeting C largest
impact on GDP
Ig= gross domestic investment in capital
goods (businesses)
G= government purchases of goods and
services
Xn= net exports (exports-imports or X-M)
6. Other National Accounts
(Economic Measures)
► Net Domestic Product (GDP adjusted for
consumption/deprecation of physical
capital)
► Personal Income (all income received by
households- earned or unearned)
► Disposable Income (personal income-
personal taxes)
7. Nominal vs. Real GDP
► Need to make adjustment for changes in
the value of money- inflation
► Nominal GDP= not adjusted for inflation
► Real GDP= adjusted for inflation
(comparable from year to year)
► Rate of inflation is measured using the GDP
price index or the consumer price index
(CPI)
8. GDP Price Index
► Compares the price of all goods and services
included in GDP in a given year to the price of the
same market basket in a reference year
Price index= (price of good in specific year/price of
same good in base year) x 100
Nominal GDP= Real GDP/GDP price index (in
hundredths)
9. Consumer Price Index
separate from GDP Price Index, used to measure
inflation
► Market basket (300 goods and services purchased
by typical consumer)
► Current market basket is based on spending habits
of consumers 1993-1995
► The CPI for the 1982-1984 market basket is used
as the base line
CPI= (price of 1993-1995 market basket in any
year/price of same market basket in 1982-1984) x
100
10. Shortcomings of GDP
► Nonmarket transactions
► Leisure (value of free time)
► Improved product quality
► Underground economy
► Environmental effects (gross domestic by-products)
► Composition and distribution of output
► Per capita output (China GDP=$980 billion in 1999
compared to Denmark’s $170 billion, but per capita for
China was $780 and $32,030 for Denmark.)
► Noneconomic sources of well being
11. Economic Growth and Stability
How is growth determined?
► Increase in real GDP over some period of
time
► Increase in real GDP per capita over some
period of time
Why is small growth significant?
► GDP= large number
► The rule of 70
12. Sources of Growth
► Increase inputs of resources
► Increase productivity of inputs
GDP= C+Ig+G+Xn
**67-70% of GDP= targeting C largest impact on GDP
14. Effects of the Business Cycle
► Downturns affect firms producing capital
goods and consumer durables most
► Service industries and industries that
produce nondurable consumer goods are
affected least
15. Unemployment
Unemployment rate= (unemployed/labor force) x100
► Not included in unemployment rate- those who are
unemployable or not looking for a job
► Issues with employment rate= part time
employment and discouraged workers
► Types of unemployment
Frictional
Structural
Cyclical
16. Unemployment
► Fullemployment= when there is no cyclical
unemployment (structural and frictional are
unavoidable)
► When rate of unemployment = full
employment, we are at the natural rate of
unemployment (NRU) and the economy is
producing at potential output (5%= NRU)
► NRU= when the number of job seekers =
the number of job vacancies
17. Cost of Unemployment
Economic
► GDP gap (difference between actual GDP and
potential GDP)
► Unequal distribution of burdens
Noneconomic
► Loss of skills, family stress, loss of self-respect
► Pressure for political change
► Social unrest
18. Inflation
► Inflation= rise in the general level of prices
(CPI)
► Demand pull inflation= total spending >
output (total spending pulls the price up
because we demand more than is supplied)
► Cost push inflation= cost of input increases
pushes price up (supply shocks= major
cause, usually unexpected)
19. Inflation
Inflation does not affect everyone the same way.
It leads to a redistribution of real income.
► Nominal income= number of $ received as
wages, rent, interest, or profit
► Real income= measure of the amount of goods
and services nominal income can buy
(purchasing power), adjusted for inflation
Real income= nominal income/ price index
20. Who is hurt by inflation?
► Fixed income receivers
► Savers
► Creditors
Who is unhurt by inflation?
► Flexible income receivers
► Debtors
Effects of anticipated inflation are less severe.
21. Effects of Inflation on Output
► Cost-push inflation
Resource prices production costs price of goods
demand output unemployment real
income
► Demand-pull inflation
Different view points on the benefit of demand-pull
inflation, many argue that some inflation is necessary to
drive production
► Hyperinflation- rapid increase in inflation with
detrimental effects on employment and real
wages, encourages speculative activity