The document summarizes a presentation on subsidy reform in the Middle East and North Africa region. It discusses recent progress made in subsidy reform efforts as well as ongoing challenges. Key points include:
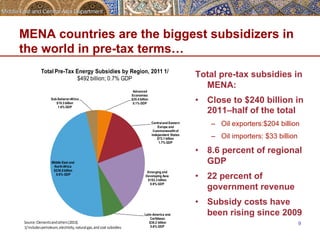
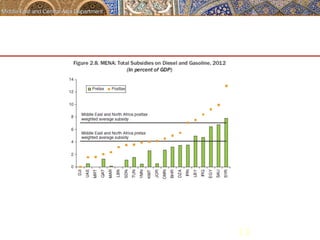
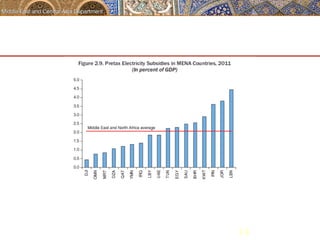
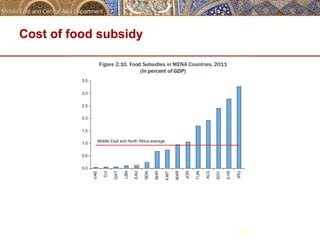
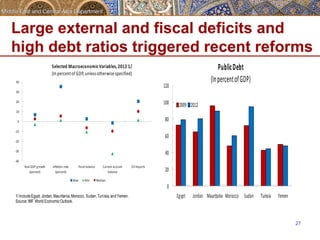
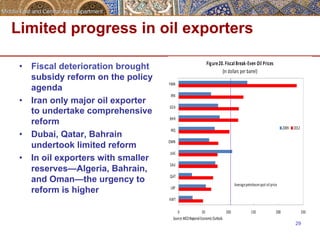
- MENA countries spend over $240 billion per year on subsidies, accounting for 8.6% of regional GDP on average. Reforms have been undertaken recently in Egypt, Jordan, Mauritania, Morocco, Sudan, Tunisia and Yemen.
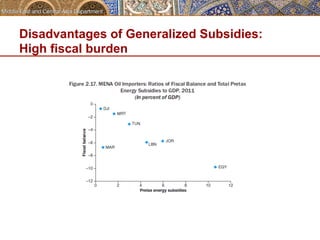
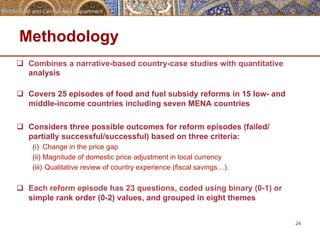
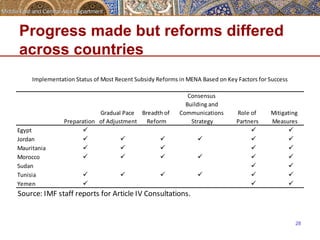
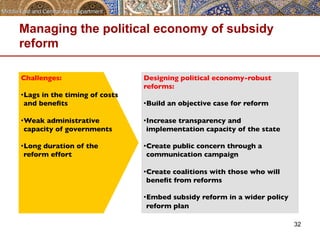
- Successful reforms tend to be comprehensive, involve gradual price adjustments, build consensus through communication, and include mitigating measures for the poor. Not all country reforms incorporated all best practices.
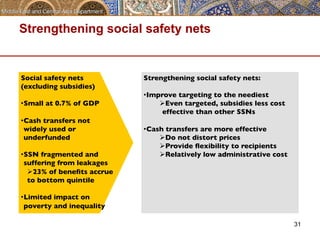
- Social safety nets in the region remain underdeveloped and could be strengthened through more