1. EEEEQUITYQUITYQUITYQUITYRRRRESEARCHESEARCHESEARCHESEARCHDWSDWSDWSDWSTTTTRADERADERADERADESSSSHEETHEETHEETHEETCCCCOMPANYOMPANYOMPANYOMPANYRRRREPORTEPORTEPORTEPORT
DDDDDDDDWWWWWWWWSSSSSSSS TTTTTTTTRRRRRRRRAAAAAAAADDDDDDDDEEEEEEEESSSSSSSSHHHHHHHHEEEEEEEEEEEEEEEETTTTTTTT
Please carefully read important notices in the last pages of this report.
40000
50000
60000
70000
80000
90000
100000
110000
Jan-06
Feb-06
Mar-06
Apr-06
May-06
Jun-06
Jul-06
Aug-06
Sep-06
Oct-06
Nov-06
Dec-06
Jan-07
Feb-07
Mar-07
Apr-07
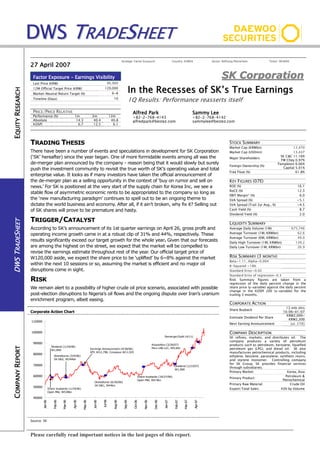
Share buybacks (1/24/06)
Open Mkt, W538bn
Dividend (1/24/06)
W1,850
Divestitures (3/9/06)
SK E&S, W344bn
Earnings Annoucement (4/28/06)
EPS W12,798, Consesus W11,925
Divestitures (6/30/06)
SK E&C, W44bn
Share buybacks (10/27/06)
Open Mkt, W0.9bn
Dividend (1/23/07)
W1,900
Acquisition (3/26/07)
Peru LNG LLC, W0.6bn
Demerger/Split (4/11)
Strategy: Factor Exposure Country: KOREA Sector: Refining/Petrochem Ticker: 003600
27 April 200727 April 200727 April 200727 April 2007
Factor ExposureFactor ExposureFactor ExposureFactor Exposure ---- Earnings VisibilityEarnings VisibilityEarnings VisibilityEarnings Visibility SSKK CCoorrppoorraattiioonn
Last Price (KRW) 96,900
12M Official Target Price (KRW) 120,000
Market-Neutral Return Target (%) 6~8
Timeline (Days) 10
IIIIIIIInnnnnnnn tttttttthhhhhhhheeeeeeee RRRRRRRReeeeeeeecccccccceeeeeeeesssssssssssssssseeeeeeeessssssss ooooooooffffffff SSSSSSSSKKKKKKKK’’’’’’’’ssssssss TTTTTTTTrrrrrrrruuuuuuuueeeeeeee EEEEEEEEaaaaaaaarrrrrrrrnnnnnnnniiiiiiiinnnnnnnnggggggggssssssss
1Q Results: Performance reasserts itself
PRICE/PRICE RELATIVE
Performance (%) 1m 3m 12m
Absolute 14.3 40.4 40.8
KOSPI 6.7 12.5 6.1
Alfred ParkAlfred ParkAlfred ParkAlfred Park
+82-2-768-4143
alfredpark@bestez.com
Sammy LeeSammy LeeSammy LeeSammy Lee
+82-2-768-4142
sammylee@bestez.com
TRADING THESIS
There have been a number of events and speculations in development for SK Corporation
(‘SK’ hereafter) since the year began. One of more formidable events among all was the
de-merger plan announced by the company - reason being that it would slowly but surely
push the investment community to revisit the true worth of SK’s operating value and total
enterprise value. It looks as if many investors have taken the official announcement of
the de-merger plan as a selling opportunity in the context of ‘buy on rumor and sell on
news.’ For SK is positioned at the very start of the supply chain for Korea Inc, we see a
stable flow of asymmetric economic rents to be appropriated to the company so long as
the ‘new manufacturing paradigm’ continues to spell out to be an ongoing theme to
dictate the world business and economy. After all, if it ain’t broken, why fix it? Selling out
of SK shares will prove to be premature and hasty.
TRIGGER/CATALYST
According to SK’s announcement of its 1st quarter earnings on April 26, gross profit and
operating income growth came in at a robust clip of 31% and 44%, respectively. These
results significantly exceed our target growth for the whole year. Given that our forecasts
are among the highest on the street, we expect that the market will be compelled to
revise the earnings estimate throughout rest of the year. Our official target price of
W120,000 aside, we expect the share price to be ‘uplifted’ by 6~8% against the market
within the next 10 sessions or so, assuming the market is efficient and no major oil
disruptions come in sight.
RISK
We remain alert to a possibility of higher crude oil price scenario, associated with possible
post-election disruptions to Nigeria’s oil flows and the ongoing dispute over Iran’s uranium
enrichment program, albeit easing.
Corporate Action Chart
Source: SK
STOCK SUMMARY
Market Cap (KRWbn) 12,470
Market Cap (USDmn) 13,437
Major Shareholders
SK C&C 11.16%
TW Chey 0.97%
Foreign Ownership (%)
Templeton 6.06%
Capital 5.01%
Free Float (%) 61.8%
KEY FIGURES (07E)
ROE (%) 16.1
RoCE (%) 12.3
EBIT Margin* (%) 6.0
SVA Spread (%) +5.1
SVA Spread (Trail 2yr Avg., %) +4.5
Cash Yield (%) 8.7
Dividend Yield (%) 2.0
LIQUIDITY SUMMARY
Average Daily Volume (1M) 675,746
Average Turnover (1M, KRWbn) 62.6
Average Turnover (6M, KRWbn) 49.0
Daily High Turnover (1M, KRWbn) 139.2
Daily Low Turnover (1M, KRWbn) 26.9
RISK SUMMARY (3 MONTH)
Beta=1.11, Alpha=0.004
R-Squared =18%
Standard Error=0.02
Standard Error of regression=0.3
Risk Summary figures are taken from a
regression of the daily percent change in the
share price (y-variable) against the daily percent
change in the KOSPI 200 (x-variable) for the
trailing 3 months.
CORPORATE ACTION
Share Buyback
13 mln shrs
10/06~01/07
Estimate Dividend Per Share
KRW2,000~
KRW2,300
Next Earning Announcement Jul. 27(E)
COMPANY DESCRIPTION
SK refines, markets, and distributes oil. The
company produces a variety of petroleum
products such as petroleum, kerosene, liquefied
petroleum gas (LPG), and diesel oil. SK also
manufactures petrochemical products, including
ethylene, benzene, paraxylene, synthetic resins,
and styrene monomer. Controlling company
for SK Group, SK provides financial services
through subsidiaries.
Primary Market: Korea, Asia
Primary Product:
Petroleum &
Petrochemical
Primary Raw Material: Crude Oil
Export/Total Sales: 43% by Volume
2. 2
April 27, 2007 SK CorporationSK CorporationSK CorporationSK Corporation
(Unit: KRWbn)
2006 1Q 2006 4Q FY2006 2007 1Q YoY
Sales 5,278 6,111 23,652 6,074 15%
COGS 4,700 5,520 21,277 5,317 13%
Gross Income 578 590 2,374 757 31%
SG&A 248 411 1,209 281 13%
Operating Income 330 179 1,165 476 44%
Non Operating Income 427 11 655 35 -92%
- - - -
Pre-Tax Income 757 190 1,820 511 -33%
1111STSTSTST QQQQUARTERUARTERUARTERUARTER PPPPERFORMANCEERFORMANCEERFORMANCEERFORMANCE RRRRESULTSESULTSESULTSESULTS
SK’s earnings released on April 26 may be interpreted as somewhat disappointing.
Net income tumbled by -33% YoY, and operating income for petroleum, the
company’s bread and butter, slid by -13% YoY. Do the results give enough of
reasons for us to be disappointed, given that the recent strength of SK share price
injected high hopes for the best of everything in the minds of the shareholders? Not
so fast!
Petroleum (Unit: KRWbn)
2006 1Q 2006 4Q FY2006 2007 1Q YoY
Sales 3,814 4,215 16,643 4,084 7%
COGS 3,506 3,994 15,560 3,790 8%
Gross Income 308 221 1,083 294 -4%
SG&A 151 259 755 157 4%
Operating Income 157 -38 328 137 -13%
Petrochem (Unit: KRWbn)
2006 1Q 2006 4Q FY2006 2007 1Q YoY
Sales 1,133 1,459 5,481 1,564 38%
COGS 1,000 1,285 4,833 1,290 29%
Gross Income 133 174 648 274 106%
SG&A 44 64 198 46 6%
Operating Income 89 111 450 228 155%
E&P (Unit: KRWbn)
2006 1Q 2006 4Q FY2006 2007 1Q YoY
Sales 75 79 336 70 -7%
COGS 25 27 106 27 11%
Gross Income 51 52 230 43 -16%
SG&A 3 6 15 4 21%
Operating Income 48 46 215 39 -18%
Lubricant (Unit: KRWbn)
2006 1Q 2006 4Q FY2006 2007 1Q YoY
Sales 175 268 897 249 43%
COGS 128 179 642 162 27%
Gross Income 47 88 255 87 86%
SG&A 14 28 76 20 41%
Operating Income 33 61 179 68 105%
Others (Unit: KRWbn)
2006 1Q 2006 4Q FY2006 2007 1Q YoY
Sales 82 90 295 107 31%
COGS 42 35 136 48 13%
Gross Income 40 55 159 59 50%
SG&A 36 56 164 55 51%
Operating Income 3 -1 -6 5 39%
3. 3
April 27, 2007 SK CorporationSK CorporationSK CorporationSK Corporation
65
70
75
80
85
Oct-06Nov-06Nov-06Nov-06Nov-06Dec-06Dec-06Dec-06Dec-06Jan-07Jan-07Jan-07Jan-07Jan-07Feb-07Feb-07Feb-07Feb-07M
ar-07M
ar-07M
ar-07M
ar-07Apr-07Apr-07
-
1
2
3
4
5
6
7
8
Diesel 50 ppm(LHS) Diesel 50 ppm-Diesel 0.5% (RHS)
USD/bbl USD/bbl
Replacement cost of 67¢ per barrel
0
2
4
6
8
10
12
Jan-03
M
ar-03
M
ay-03
Jul-03
Sep-03
Nov-03
Jan-04
M
ar-04
M
ay-04
Jul-04
Sep-04
Nov-04
Jan-05
M
ar-05
M
ay-05
Jul-05
Sep-05
Nov-05
Jan-06
M
ar-06
M
ay-06
Jul-06
Sep-06
Nov-06
Jan-07
M
ar-07
20
30
40
50
60
70
80
90
Nigerian BL's premium to Arab Light (USD bbl, LHS)
Nigerian Bonny Light (USD bbl, RHS)
These seemingly less-than-impressive figures do not surprise us a bit. According to
our earnings estimate in our previous report, <SK: Simply Kosher for Corollary
Investing> dated April 10, 2007, we projected and penciled in the gross profit
(which we take as a real net turnover for SK) growth and operating income
growth at 12% and 34%, respectively, for this year over 2006. We had further
remarked that the company’s net income and NOPAT would stay flat because
the net income had been already overstated in 2005 and 2006, in addition to a
mounting pressure on non-cash and non-operating earnings such as foreign exchange
and equity method gains.
Our verdict is that the turnover growth and operating income growth coming
in at a robust clip of 15% and 44% should be deemed, in reality, as very nice
and pleasant surprises. As we discussed it in our previous report, the net income-
based measures provide very little insight, let alone foresight, for how the
company’s share price is going to fare in the future. That a significant number
of market participants may be taken aback by SK’s ‘seemingly’ lukewarm numbers – if
they are led astray by these results to sell their shares in the open market - will
provide those smart-money investors with a rare opportunity for an incremental
alpha-generation.
TTTTHEHEHEHE RRRREASONINGEASONINGEASONINGEASONING BBBBEHIND OUREHIND OUREHIND OUREHIND OUR PPPPOSITIVEOSITIVEOSITIVEOSITIVE SSSSTANCETANCETANCETANCE
The reasoning behind our positive stance on SK’s business and earnings going into
2007 was two folds; (1) SK’s improved ability to optimize the crude mix,
thanks to revamped facilities for hydrotreating and catalytic cracking (via
product swap with SK Incheon); and (2) SK’s internal initiatives for margin
improvement through acquisition of SK Incheon and strategic tie-up with
Nippon Oil.
Dieslization continues… And the sweet crude price remains strong… Chinese demand?
Source: DWS, Bloomberg Source: DWS, Bloomberg
We believe that the first kicker is already in effect due to the company’s
increased capacity to be able to turn out more low-sulfur diesel (of 50PPM
sulfur content), which fetches a price that’s 4~5% higher than 0.5% sulfur
gasoil. It is important to note that the company’s replacement cost of
additional Middle Distillate Unit facilities is estimated at $0.67 a barrel. In the
case of possible demand shocks across the board, SK can opt for a ‘heavier’ crude
slate with purchase of less expensive, lower API crude feedstock, thus higher gross
margin.
4. 4
April 27, 2007 SK CorporationSK CorporationSK CorporationSK Corporation
-6
-4
-2
-
2
4
6
8
10
12
Feb-05
Apr-05
Jun-05
Aug-05
Oct-05
Dec-05
Feb-06
Apr-06
Jun-06
Aug-06
Oct-06
Dec-06
Feb-07
Apr-07
S'pore-A rab Light Netback Margin SK's Export Netback Margin
USD/bbl
-2
-1
-
1
2
3
4
5
6
7
8
Feb-05
Mar-05
Apr-05
May-05
Jun-05
Jul-05
Aug-05
Sep-05
Oct-05
Nov-05
Dec-05
Jan-06
Feb-06
Mar-06
Apr-06
May-06
Jun-06
Jul-06
Aug-06
Sep-06
Oct-06
Nov-06
Dec-06
Jan-07
Feb-07
Mar-07
40,000
45,000
50,000
55,000
60,000
65,000
70,000
75,000
80,000
85,000
90,000
95,000
100,000
SK Ex-Ante Operating Profit per barrel (USD/bbl, LHS) SK Share Price
We may see a 'deep' buying opportunity soon…
What’s impressive is that the improvement in refining margin was markedly
visible despite an unexpectedly high crude price that stemmed from tension
between Iran and the UK (and the US) and recently, political unrest in
Nigeria, the world’s eighth biggest exporter. We are increasingly convinced
that the strength of refining margin can be more than a cyclical recovery,
likely reflecting in a possible supply disruption.
The second kicker has yet to be confirmed, but it is a matter of when, not if. Once
again, we stress that it is not a ‘passive’ counter against the inevitable Chinese
domination or as a merely symbolic showing toward the status of ‘regional major.’ We
essentially view this alliance as one of the very cornerstones, in the context of
‘offensive’ restructuring for SK’s Pan-Pacific strategic roadmap. Given that SK has
significantly more to gain from this tie-up than NOJ, we see little ‘transitory’ risk or
downside that may hamper or slow down the process of the ‘end’ benefits, which will
eventually permeate through the company’s very intrinsic properties, thereby
begetting the ‘new’ and ‘improved’ SK in the next cycle.
‘‘‘‘BBBBRIGHTRIGHTRIGHTRIGHT’’’’ ISISISIS IIIINNNN THETHETHETHE RRRRECESSES OFECESSES OFECESSES OFECESSES OF SKSKSKSK’’’’SSSS TTTTRUERUERUERUE EEEEARNINGSARNINGSARNINGSARNINGS
As we speak, Asian (and global) refining margin continues to improve. Yet, SK
reported a disappointing -13% YoY drop in its petroleum operating income. Allow us
to lay out the real picture.
In its investor relations material on the 1st
quarter earnings, SK noted that the
Singapore simple margin expanded to $2.47 in the 1st
quarter from $1.26 the last
year while SK’s simple margin increased to $2.47 from $-1.39. SK assumed a ‘run’
mix of 11.9% Gasoline, 5.1% Naphtha, 9.9% Kerosene, 24.4% Diesel, and 46.2%
Fuel Oil for calculation of the Singapore simple margin. SK’s own simple margin,
according to the company, was comprised of 20% Naphtha, 10% Kerosene, 30%
Diesel, and 40% Fuel Oil.
This assumption can be erroneous and misleading for us to take as the basis of
forecasting the future trend or pattern on two grounds. First of all, the comparison
is not apple-to-apple; and second, SK does not include Gasoline, the lighter
and more expensive product, and instead bloats the Naphtha composition.
This case in point can delude one’s forecasting ability by the way of faulted premise if
he/she takes the stated margin ‘as is.’
We, instead, take netback price (thus margin) less Arab light crude for Singapore
benchmarks. Singapore netback margin, which averaged at $1.42 in the 1st
quarter of
2005, jumped to $4.28 on the average in the 1st
quarter this year.
SK’s export margin and S’pore netback margin go in tandem SK’s performance will likely surprise the mkt throughout 2007
Source: DWS, KNOC Source: DWS, KNOC
5. 5
April 27, 2007 SK CorporationSK CorporationSK CorporationSK Corporation
10
11
12
13
14
15
16
Jan-06
Feb-06
M
ar-06
Apr-06
M
ay-06
Jun-06
Jul-06
Aug-06
Sep-06
Oct-06
Nov-06
Dec-06
Jan-07
Feb-07
M
ar-07
-10%
-5%
0%
5%
10%
15%
SK 2007 IBES EPS Estimate (Wbn, LHS)
MSCI Korea 2007 Estimate Change since the End of 2005
SK Estimate Change since the End of 2005
W'000
-
1,000
2,000
3,000
4,000
5,000
6,000
FQ
1
2004FQ
2
2004FQ
3
2004FQ
4
2004FQ
1
2005FQ
2
2005FQ
3
2005FQ
4
2005FQ
1
2006FQ
2
2006FQ
3
2006FQ
4
2006FQ
1
2007FQ
2
2007FQ
3
2007FQ
4
2007
Estimate Reported
According to our calculation, SK’s ‘economic’ refining margin expanded by 51%. Note
SK’s refining margin, according to the company, expanded by more than 300% from
-$1.39 to $2.47, yet its operating profit contracted by -13%.
It is realistically hard to assume that inventory costing alone can account for
this discrepancy because crude oil prices were quite stable in three preceding
months of Oct~Dec of 2006 and throughout the 1st
quarter of 2007. The fact that net
income of SPC of Singapore rose 65% YoY in the 1st
quarter this year - as announced
on April 24 - despite the sluggish sales growth supports our argument. We suspect
that SK’s reported operating income is an offspring of transfer pricing and
disproportional cost allotment. It essentially means that the actual cash flow will
accrue faster than the reported figures would suggest and that there would be an
upward pressure on the future profits. Our verdict is that SK’s petroleum business is
getting as good as it gets. And from the ‘slope’ of its momentum and strength of
prices, we have reasons to believe that it’s not going to cool off any time soon.
SSSSOOOO WWWWHATHATHATHAT AAAARERERERE WWWWEEEE GGGGOINGOINGOINGOING TTTTOOOO DDDDOOOO????
The market generally appears to be less than positive on SK’s business outlook as it
pencils in EPS for the year at about W10,800~11,000. Although we repeatedly stated
that the net income based measures were little of utility in terms of forecasting the
future performance, if we had to make our ‘bold’ estimate, we would still come away
with the higher estimate of about W12,500~13,500.
From the end of 2005, the market participants have continually revised down its
earnings outlook on the broad market. It is now nearly 10% lower than previously
anticipated through the first half of 2006. On the contrary, SK’s earning estimate,
while inherently volatile, came off by about 5% during the same period. In
our opinion, it is, at this level, as low as it can get at this juncture. We are
very positive on SK’s performance outlook and expect the rest of the market to follow
suit.
Market-neutral alpha is not over… Upward revision is likely…
Source: MSCI, IBES, Bloomberg Source: MSCI, IBES, Bloomberg
We emphasize again that the reported figures were positive surprises, from our point
of view. We previously assumed that the turnover growth would moderate at about
3~4% in 2007 and 2008. We basically expected that much of the value-added would
come from the margin expansion, but confirmed that it accompanied the topline
expansion as well. Since the topline growth surprise would force the analysts and
managers to revise up their estimates accordingly for the next quarter – at the
shortest - we come up with a new turnover forecast with a growth of 8% from 3% for
the whole year until we see the second quarter results a quarter later.
6. 6
April 27, 2007 SK CorporationSK CorporationSK CorporationSK Corporation
0%
2%
4%
6%
8%
10%
12%
14%
16%
1 2 3 4 5 6 7 8 9 10 11 12 13 14 15 16 17 18 19 20 21 22 23 24 25 26 27 28 29 30
Sales Growth Core Operating Capital Growth ROCE Cost of Capital
0%
2%
4%
6%
8%
10%
12%
14%
16%
1 2 3 4 5 6 7 8 9 10 11 12 13 14 15 16 17 18 19 20 21 22 23 24 25 26 27 28 29 30
Sales Growth Core Operating Capital Growth ROCE Cost of Capital
0
2
4
6
8
10
12
14
16
18
-7
-6.3
-5.5
-4.8
-4
-3.3
-2.5
-1.8
-1
-0.3
0.5
1.25
2
2.75
3.5
4.25
5
5.75
6.5
7.25
+/- 1 Sigma
0
5
10
15
20
25
30
35
40
-4
-3.5
-3
-2.5
-2
-1.5
-1
-0.5
0
0.5
1
1.5
2
2.5
3
3.5
4
4.5
5
5.5
We also revised the operating income projection. Although the operating margin
expanded to 7.8% in the 1st
quarter, we identify a historical pattern of margin shoot-
up in 1st
quarters, therefore, apply an appropriate discount coefficient of 1.27 (which
is the last three years’ average) to derive a normal level of the operating margin of
5.7% and 5.5% in 2007 and 2008, respectively.
The following charts illustrate the ‘before’ and ‘after’ of SK’s growth and fade profile
after the aforementioned adjustments were made on the basis of the ‘surprise’
coefficients. Given that the market has become more than adequately efficient, this
puts a ‘transitory’ upward pressure on the share’s central value to rise by 6~8%.
Assuming that the KOSPI remains unchanged as of the last closing of 1,553.13, we
expect a transitory ‘alpha’ of 6~8% over the next 10 sessions.
Double-wedged growth after the shakeout should be reflected Higher upside volatility in topline and margin now likely…
Source: DWS NumberMill Source: DWS NumberMill
IIIISSSS IIIIT AT AT AT A GGGGOODOODOODOOD TTTTIME TOIME TOIME TOIME TO BBBBUYUYUYUY NNNNOWOWOWOW????
Yes, we believe so. Over the last six months. SK displayed an alpha coefficient of
0.34 versus the broad market’s 0.11. In a risk-adjusted way, it generated a
20% more alpha than the broad market. Compared with its own daily price
distribution over the last 12 months, SK shares have been clearly more alpha-
generative with an intra-day return of 2% or more in 28 sessions out of the last 117 –
that’s 24% over the last 6 months compared to 19% (out of 234 sessions) over the
last 12 month.
6 Month daily return distribution for SK 6 Month daily return distribution for KOSPI
Source: DWS Source: DWS
7. 7
April 27, 2007 SK CorporationSK CorporationSK CorporationSK Corporation
-20
-15
-10
-5
0
5
10
15
20
2005-06-15
2005-07-15
2005-08-15
2005-09-15
2005-10-15
2005-11-15
2005-12-15
2006-01-15
2006-02-15
2006-03-15
2006-04-15
2006-05-15
2006-06-15
2006-07-15
2006-08-15
2006-09-15
2006-10-15
2006-11-15
2006-12-15
2007-01-15
2007-02-15
2007-03-15
2007-04-15
20
30
40
50
60
70
80
SK/KOSPI Relative Strength (RHS)
Long SK/Short KOSPI 60D-10D Crossing (%, LHS)
`
Inflection Point
Inflection Point
Presently, the (mid-term) volatility is a friendly entity to SK’s current or would-be
shareholders as the share’s pronounced alpha over the market is viewed in the
context of an option-pricing mechanism whereby higher volatility would equate to
higher premium.
The 60D volatility of long SK position – ‘funded’ by the KOSPI – has been climbing up
since the end of 2006, as seen on the left chart. We were naturally compelled to enter
a trade to take advantage of the clear interaction effect whereas the price of
volatility was not only low (hence, a corrective reversion), but also ripe for
an upward shift under the influence from a number of positive developments
- a hopeful speculation in the market about a possible de-merger/split; continued
share buybacks; and refining margin supported on the ‘floor.’
Despite SK’s resilient outperformance over the market since November 15, 2006, we
recently identified a case of 60D-10D volatility crossing (right chart). This signals that
it could take a while until a reversal of the 60D volatility is confirmed. We would not
be hesitant to capitalize on this stronger-than-anticipated momentum.
Option pricing in effect SK’s market-neutral alpha is not yet over…
Source: DWS Source: DWS
20
25
30
35
40
45
50
05-6-14
05-7-14
05-8-14
05-9-14
05-10-14
05-11-14
05-12-14
06-1-14
06-2-14
06-3-14
06-4-14
06-5-14
06-6-14
06-7-14
06-8-14
06-9-14
06-10-14
06-11-14
06-12-14
07-1-14
07-2-14
07-3-14
07-4-14
30
35
40
45
50
55
60
65
70
75
80
Long SK/Short KOSPI 60D volatility (%, LHS)
SK/KOSPI Relative Strength (RHS)
8. 8
IMPORTANT NOTICES Equity Research for International Investors (ERII)
As of April 10, 2007, Daewoo Securities Co., Ltd. issued equity-linked warrants with SK as an underlying asset.
As of April 10, 2007, Daewoo Securities Co., Ltd. has acted as a liquidity provider for equity-linked warrants backed by
shares of SK as an underlying asset, and other than this, Daewoo Securities has no other special interests in the covered
companies.
This report has not been distributed to any third party including institutional investors and other interest groups prior to
the public release of this report.
Analyst of the subject company or member of the analyst's household does not have any financial interest in the
securities of the subject company and the nature of the financial interest (including without limitation, whether it
consists of any option, right, warrant, future, long or short position)
This report reflects the sole opinion of the analyst (Alfred Park, Sammy Lee) without any external influences by third
parties.
Ratings DistributionRatings DistributionRatings DistributionRatings Distribution
Note:1) Our investment rating is a guide to the relative return of the stock versus the market over the next twelve months.
2) Although it is not part of the official ratings at ERII, we may call a trading opportunity in case there is a technical or short-term material
development.
Source: Daewoo Securities
Analyst Industry Ratings of ERII, Daewoo SecuritiesAnalyst Industry Ratings of ERII, Daewoo SecuritiesAnalyst Industry Ratings of ERII, Daewoo SecuritiesAnalyst Industry Ratings of ERII, Daewoo Securities
Ratings and Target PricRatings and Target PricRatings and Target PricRatings and Target Price Historye Historye Historye History
Share price (----), Target price (----------------), Not covered (░), Strong Buy (), Buy (▲), Trading Buy (■), Hold (●), Sell (◆)
Investment ratings Target return
Strong Buy Relative performance of +15% or greater with high conviction
Buy Relative performance of +15% or greater
Trading Buy Relative performance of +10% or greater, but with variability/volatility
Hold Relative performance of –10% and +10%
Sell Relative performance of -10%
Overweight Industry fundamentals are improving
Market-weight Industry fundamentals are steady without any material changes
Underweight Industry fundamentals are worsening
SK Corp. [Strong Buy /TP W120,000]
0
20,000
40,000
60,000
80,000
100,000
120,000
140,000
4/05 7/05 10/05 1/06 4/06 7/06 10/06 1/07 4/07
(W)
9. 9
IMPORTANT NOTICES Equity Research for International Investors (ERII)
Daewoo Securities Co., Ltd. may have managed or co-managed a public offering of securities for the subject company, or received
compensation for investment banking services from the subject company in the past 12 months.
This report has been provided by the ERII (Equity Research for International Investors) department of Daewoo Securities Co., Ltd.
Daewoo Securities ERII is run independently of the research division of Daewoo Securities Co., Ltd. The stock ratings, target prices,
estimates and overall viewpoints of ERII may differ from the research division of Daewoo Securities. This report must be viewed as
Daewoo Securities ERII's independent opinion and must not be interpreted by any means as an official viewpoint of the research
division of Daewoo Securities Co., Ltd. Daewoo Securities ERII was established to service international institutional investors although
the reports are released publicly. Investors can access Daewoo Securities ERII's research through Firstcall, Daewoo research direct
(www.bestez.com), Multex and Bloomberg (DWIR).
Daewoo Securities Co., Ltd. is a full-service, integrated investment banking, and brokerage firm. We are a leading underwriter of
securities and leading participant in virtually all trading markets. We have investment banking and other business relationships with a
substantial percentage of the companies covered by the research division of Daewoo Securities and Daewoo Securities ERII. Our
research professionals provide important input into our investment banking and other business selection process. Investors should
assume that Daewoo Securities Co., Ltd. are seeking or will seek investment banking or other business from the subject companies
covered by this report and that the research analysts who involved in preparing this report may participate in the solicitation of such
business. Our research analysts’ compensation is determined based upon the activities and services intended to benefit the investors of
Daewoo Securities Co., Ltd. Like all employees of Daewoo Securities Co., Ltd., analysts receive compensation that is impacted by
overall firm profitability, which includes revenues from, among other business units, the intuitional equities, investment banking,
proprietary trading, and private client division.
This document was prepared by Daewoo Securities Co., Ltd. (“Daewoo”). Information and opinions contained herein have been
compiled from sources believed to be reliable and in good faith. The information has not been independently verified. Daewoo makes no
guarantee, representation or warranty, express or implied, as to the fairness, accuracy or completeness of the information and opinions
contained in this document. Daewoo accepts no responsibility or liability whatsoever for any loss arising from the use of this document
or its contents or otherwise arising in connection therewith. Information and opinions contained herein are subject to change without
notice. This document is for information purposes only. It is not and should not be construed as an offer or solicitation of an offer to
purchase or sell any securities or other financial instruments. This document may not be reproduced, further distributed or published in
whole or in part for any purpose.
This document is for distribution in the United Kingdom only to persons who are authorized persons or exempted persons within the
meaning of the Financial Services Act 1986 or any order made thereunder.
Daewoo’s U.S. affiliate, Daewoo Securities (America) Inc., distributes this document in the U.S. solely for “major U.S. institutional
investors” as defined in Rule 15a-6 of the U.S. Securities Exchange Act of 1934. Any U.S. recipient of this document who wishes to
effect transactions in any securities discussed herein should contact and place orders with Daewoo Securities (America) Inc.
DAEWOO SECURITIES INTERNATIONAL NETWORK
DAEWOO SECURITIES CO., LTD
150-716, 34-3, Youido-dong, Yongdungpo-ku, Seoul, Korea
Tel : (822) 768-4143 Fax : (822) 768-2126
Contact: Alfred Park alfredpark@bestez.com
Daewoo Securities (Europe) Ltd.
41st floor, Tower 42, 25 Old Broad Street,
London EC2N 1HQ, U.K.
Tel : 4420-7982-8000 Fax : 4420-7982-8040
Contact: Sean Kang sean.kang@dwse.com
Daewoo Securities (America) Inc.
600 Lexington Avenue, Suite 301
New York, NY 10022 U.S.A.
Tel : 1212-407-1000 Fax : 1212-407-1010
Contact: Jean-Louis Lee jlee@dwsusa.com
Daewoo Securities (Hong Kong) Ltd.
Suite 816-819, Jardine House,
1 Connaught Place, Central, H.K., China
Tel : 852-2845-6332 Fax : 852-2845-5374
Contact: H. J. Ahn hjahn@dws.com.hk
Tokyo Representative Office
Rm. 701 Build X, 2-1-11 Nihonbashikayaba-Cho,
Chuo-Ku, Tokyo, Japan
Tel : 813-5642-6070 Fax : 813-5642-6228
Contact: John Sejung Oh johnoh@bestez.com