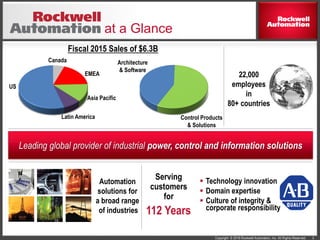
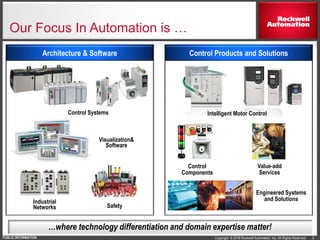
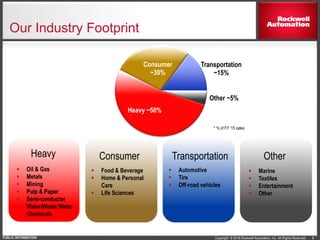
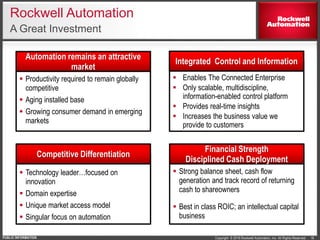
Copyright © 2016 Rockwell Automation, Inc. All Rights Reserved.Rev 5058-CO900E
Rockwell Automation
Company Overview – August 2016
Copyright © 2016 Rockwell Automation, Inc. All Rights Reserved.PUBLIC INFORMATION
Safe Harbor Statement
 This presentation includes statements related to the expected future
results of the company and are therefore forward-looking statements.
Actual results may differ materially from those projections due to a wide
range of risks and uncertainties, including those that are listed in our
SEC filings.
 This presentation also contains non-GAAP financial information and
reconciliations to GAAP are included in the appendix. All information
should be read in conjunction with our historical financial statements.
2
Copyright © 2016 Rockwell Automation, Inc. All Rights Reserved.
at a Glance
3
Leading global provider of industrial power, control and information solutions
Automation
solutions for
a broad range
of industries
22,000
employees
in
80+ countries
Fiscal 2015 Sales of $6.3B
US
Canada
EMEA
Asia Pacific
Latin America Control Products
& Solutions
Architecture
& Software
 Technology innovation
 Domain expertise
 Culture of integrity &
corporate responsibility
112 Years
Serving
customers
for
Copyright © 2016 Rockwell Automation, Inc. All Rights Reserved.PUBLIC INFORMATION
Two Segments – One Business
Broad portfolio of products, solutions and services
Control Products
& Solutions
$3.6B
Architecture &
Software
$2.7B
FY’15 Total Sales - $6.3B
4
Copyright © 2016 Rockwell Automation, Inc. All Rights Reserved.PUBLIC INFORMATION
Our Focus In Automation is …
Control Systems
Visualization&
Software
Industrial
Networks Safety
Control
Components
Value-add
Services
Engineered Systems
and Solutions
Intelligent Motor Control
…where technology differentiation and domain expertise matter!
5
Architecture & Software Control Products and Solutions
Copyright © 2016 Rockwell Automation, Inc. All Rights Reserved.PUBLIC INFORMATION
Heavy Consumer Transportation Other
Our Industry Footprint
 Food & Beverage
 Home & Personal
Care
 Life Sciences
Heavy ~50%
Consumer
~30%
Transportation
~15%
Other ~5%
 Oil & Gas
 Metals
 Mining
 Pulp & Paper
 Semi-conductor
 Water/Waste Water
 Chemicals
 Automotive
 Tire
 Off-road vehicles
 Marine
 Textiles
 Entertainment
 Other
6
* % of FY ‘15 sales
Copyright © 2016 Rockwell Automation, Inc. All Rights Reserved.PUBLIC INFORMATION
Value Creation Strategy
7
PRODUCTIVITY
 Drive productivity
to reinvest in the
business
 Working capital
management
INTELLECTUAL
CAPITAL
 Innovation
 Domain expertise
 Asset light
ABOVE-MARKET
GROWTH
 Expand served
market
 Gain market share
 Acquisitions as
catalysts
VALUE CREATION
 Above-market organic growth
 Best in class operating
margin & ROIC
 Strong cash flow
 Expand customer value;
increase shareowner value
Copyright © 2016 Rockwell Automation, Inc. All Rights Reserved.PUBLIC INFORMATION
We Help Customers Achieve…
8
Faster
Time to
Market
Improved
Asset
Utilization
$
Lower Total
Cost of
Ownership
Enterprise
Risk
Management
Business Value
Continually expanding the value we provide to customers
Copyright © 2016 Rockwell Automation, Inc. All Rights Reserved.PUBLIC INFORMATION 9
 Technology Innovation & Broad Portfolio
 The only scalable, multidiscipline, information-
enabled control platform – Logix, including a
Modern DCS
 Secure EtherNet/IP network infrastructure
 Leading market position in safety
 Intelligent motor control products and systems
 Domain Expertise & Global Support
 Application know-how
 Lifecycle support for customers in all industries
 Trusted Partners & Unique Market Access Model
 Channel partners, strategic alliances, technology
partners
Strong Foundation of Differentiation
Integrated Architecture
Intelligent Motor Control
Solutions & Services
Copyright © 2016 Rockwell Automation, Inc. All Rights Reserved.PUBLIC INFORMATION 10
Differentiated Market Access Model
Limited Distribution
OEM Machine Builder System Integrators
End User
Rockwell Automation
Copyright © 2016 Rockwell Automation, Inc. All Rights Reserved.PUBLIC INFORMATION
Attractive Growth Opportunities
11
Market
Share
 Productivity required to remain
globally competitive
 Installed base refresh
 Consumer demand in emerging
markets
 Skills gap and aging workforce
Market Growth
 High performance architecture
 Process (PlantPAx and
services)
 Midrange
 Powertrain
 Safety
Market/Customer Share
 Network infrastructure
 Security
 Information & data
management
 Operational intelligence
 Bolt-on acquisitions
PAM Expansion
The Connected Enterprise will fuel growth across the spectrum
$65
$90B
 $90B market
 Connected Enterprise added ~$8B
 5-yr CAGR of 8%
FY10 FY15
$90PAM
Product Available Market
(billions)
Copyright © 2016 Rockwell Automation, Inc. All Rights Reserved.PUBLIC INFORMATION
The Connected Enterprise
Supply
Chain
Headquarters
Distribution
Center
Smart Grid
Customers
Enterprise optimization for rapid value creation
Production
12
Copyright © 2016 Rockwell Automation, Inc. All Rights Reserved.
… enabling The Connected Enterprise
Integrated Control and Information…
13
Copyright © 2016 Rockwell Automation, Inc. All Rights Reserved. 14
How We Measure Progress
 Sales and EPS growth, FCF, ROIC
 Share gain in all market conditions
 Measurable cost productivity every year
 Customer loyalty index improvement
 Connected Enterprise adoption indicators
 Network infrastructure and services
 Logix growth
Copyright © 2016 Rockwell Automation, Inc. All Rights Reserved.Rev 5058-CO900E
Rockwell Automation
Financial Overview
Copyright © 2016 Rockwell Automation, Inc. All Rights Reserved.PUBLIC INFORMATION
Free Cash Flow Pension Contributions
Track Record of Execution
16
Return on Invested CapitalSales
Free Cash FlowAdjusted EPS
Actual Results Jul 27th 2016 Guidance
Actual Results Jul 27th 2016 Guidance Actual Results as of Fiscal Year End
Copyright © 2016 Rockwell Automation, Inc. All Rights Reserved.PUBLIC INFORMATION 17
Cash Deployment Priorities
Free Cash Flow
Acquisitions
Dividends
Share Repurchase
Returned $3.5 billion to shareowners in the last 5 years
Cash Returned to Shareowners
Copyright © 2016 Rockwell Automation, Inc. All Rights Reserved.PUBLIC INFORMATION 18
Rockwell Automation
A Great Investment
 Enables The Connected Enterprise
 Only scalable, multidiscipline,
information-enabled control platform
 Provides real-time insights
 Increases the business value we
provide to customers
Integrated Control and Information
 Technology leader…focused on
innovation
 Domain expertise
 Unique market access model
 Singular focus on automation
Competitive Differentiation
 Productivity required to remain globally
competitive
 Aging installed base
 Growing consumer demand in emerging
markets
Automation remains an attractive
market
 Strong balance sheet, cash flow
generation and track record of returning
cash to shareowners
 Best in class ROIC; an intellectual capital
business
Financial Strength
Disciplined Cash Deployment
Copyright © 2016 Rockwell Automation, Inc. All Rights Reserved.PUBLIC INFORMATION
Total Shareowner Return
19
• Includes the reinvestment of all dividends in our common stock
2008-2015 annualized total return of 18% vs. 10% for the S&P 500
Copyright © 2016 Rockwell Automation, Inc. All Rights Reserved.PUBLIC INFORMATION
Appendix
Reconciliation to Non-GAAP Measures
Copyright © 2016 Rockwell Automation, Inc. All Rights Reserved.PUBLIC INFORMATION
Return On Invested Capital
(in millions, except percentages)
Twelve
Months
Ended
Jun. 30, Twelve Months Ended September 30,
2016 2015 2014 2013 2012 2011 2010 2009 2008
(a) Return
Income from continuing operations $ 745.8 $ 827.6 $ 826.8 $ 756.3 $ 737.0 $ 697.1 $ 440.4 $ 217.9 $ 577.6
Interest expense 69.8 63.7 59.3 60.9 60.1 59.5 60.5 60.9 68.2
Income tax provision 239.3 299.9 307.4 224.6 228.9 170.5 103.8 56.0 231.3
Purchase accounting depreciation and
amortization 19.1 21.0 21.6 19.3 19.8 19.8 18.9 18.6 24.2
Special charges — — — — — — — (4.0) 46.7
Return 1,074.0 1,212.2 1,215.1 1,061.1 1,045.8 946.9 623.6 349.4 948.0
(b) Average Invested Capital
Short-term debt 158.5 166.6 275.5 209.0 207.2 — — 70.1 325.1
Long-term debt 1,504.2 1,261.9 905.3 905.0 905.0 904.9 904.8 904.6 804.5
Shareowners' equity 2,277.2 2,521.3 2,680.7 2,086.7 1,881.5 1,709.7 1,387.9 1,563.5 1,798.5
Accumulated amortization of goodwill and
intangibles 807.9 792.6 772.7 775.2 751.0 716.7 679.4 648.3 619.0
Cash and cash equivalents (1,469.9) (1,376.1) (1,210.6) (1,010.2) (878.8) (922.7) (763.3) (576.0) (728.0)
Short-term investments (784.0) (639.3) (485.2) (361.7) (232.5) — — — —
Average invested capital 2,493.9 2,727.0 2,938.4 2,604.0 2,633.4 2,408.6 2,208.8 2,610.5 2,819.1
(c) Effective Tax Rate
Income tax provision 239.3 299.9 307.4 224.6 228.9 170.5 103.8 56.0 231.3
Income from continuing operations before
income taxes $ 985.1 $ 1,127.5 $ 1,134.2 $ 980.9 $ 965.9 $ 867.6 $ 544.2 $ 273.9 $ 808.9
Effective tax rate 24.3% 26.6% 27.1% 22.9% 23.7% 19.7% 19.1% 20.4% 28.6%
(a) / (b) * (1-c) Return on Invested Capital 32.6% 32.6% 30.1% 31.4% 30.3% 31.6% 22.8% 10.7% 24.0%
Reconciliation to Non-GAAP Measures
21
Copyright © 2016 Rockwell Automation, Inc. All Rights Reserved.PUBLIC INFORMATION
Adjusted EPS
Fiscal 2016
Guidance 2015 2014 2013 2012 2011 2010 2009 2008
Diluted EPS from continuing operations $5.43 - $5.63 $ 6.09 $ 5.91 $ 5.36 $ 5.13 $ 4.79 $ 3.05 $ 1.53 $ 3.89
Non-operating pension costs per diluted share 0.58 0.46 0.40 0.55 0.25 0.16 0.07 (0.14) (0.17)
Tax effect of non-operating pension costs per
diluted share (0.21) (0.15) (0.14) (0.20) (0.09) (0.06) (0.02) 0.05 0.07
Adjusted EPS $5.80 - $6.00 $ 6.40 $ 6.17 $ 5.71 $ 5.29 $ 4.89 $ 3.10 $ 1.44 $ 3.79
Free Cash Flow
(in millions)
Twelve Months Ended September 30,
2015 2014 2013 2012 2011 2010 2009 2008
Cash provided by continuing operating activities $ 1,187.7 $ 1,033.3 $ 1,014.8 $ 718.7 $ 643.7 $ 494.0 $ 526.4 $ 596.8
Capital expenditures (122.9) (141.0) (146.2) (139.6) (120.1) (99.4) (98.0) (151.0)
Tax payments related to the gain on divestiture of Power Systems — — — — — — — 7.9
Excess income tax benefit from share-based compensation 12.4 29.9 31.9 18.5 38.1 16.1 2.4 4.6
Free cash flow $ 1,077.2 $ 922.2 $ 900.5 $ 597.6 $ 561.7 $ 410.7 $ 430.8 $ 458.3
Reconciliation to Non-GAAP Measures
22

Rockwell Automation - Q3 2016 Presentation

  • 1.
    Copyright © 2016Rockwell Automation, Inc. All Rights Reserved.Rev 5058-CO900E Rockwell Automation Company Overview – August 2016
  • 2.
    Copyright © 2016Rockwell Automation, Inc. All Rights Reserved.PUBLIC INFORMATION Safe Harbor Statement  This presentation includes statements related to the expected future results of the company and are therefore forward-looking statements. Actual results may differ materially from those projections due to a wide range of risks and uncertainties, including those that are listed in our SEC filings.  This presentation also contains non-GAAP financial information and reconciliations to GAAP are included in the appendix. All information should be read in conjunction with our historical financial statements. 2
  • 3.
    Copyright © 2016Rockwell Automation, Inc. All Rights Reserved. at a Glance 3 Leading global provider of industrial power, control and information solutions Automation solutions for a broad range of industries 22,000 employees in 80+ countries Fiscal 2015 Sales of $6.3B US Canada EMEA Asia Pacific Latin America Control Products & Solutions Architecture & Software  Technology innovation  Domain expertise  Culture of integrity & corporate responsibility 112 Years Serving customers for
  • 4.
    Copyright © 2016Rockwell Automation, Inc. All Rights Reserved.PUBLIC INFORMATION Two Segments – One Business Broad portfolio of products, solutions and services Control Products & Solutions $3.6B Architecture & Software $2.7B FY’15 Total Sales - $6.3B 4
  • 5.
    Copyright © 2016Rockwell Automation, Inc. All Rights Reserved.PUBLIC INFORMATION Our Focus In Automation is … Control Systems Visualization& Software Industrial Networks Safety Control Components Value-add Services Engineered Systems and Solutions Intelligent Motor Control …where technology differentiation and domain expertise matter! 5 Architecture & Software Control Products and Solutions
  • 6.
    Copyright © 2016Rockwell Automation, Inc. All Rights Reserved.PUBLIC INFORMATION Heavy Consumer Transportation Other Our Industry Footprint  Food & Beverage  Home & Personal Care  Life Sciences Heavy ~50% Consumer ~30% Transportation ~15% Other ~5%  Oil & Gas  Metals  Mining  Pulp & Paper  Semi-conductor  Water/Waste Water  Chemicals  Automotive  Tire  Off-road vehicles  Marine  Textiles  Entertainment  Other 6 * % of FY ‘15 sales
  • 7.
    Copyright © 2016Rockwell Automation, Inc. All Rights Reserved.PUBLIC INFORMATION Value Creation Strategy 7 PRODUCTIVITY  Drive productivity to reinvest in the business  Working capital management INTELLECTUAL CAPITAL  Innovation  Domain expertise  Asset light ABOVE-MARKET GROWTH  Expand served market  Gain market share  Acquisitions as catalysts VALUE CREATION  Above-market organic growth  Best in class operating margin & ROIC  Strong cash flow  Expand customer value; increase shareowner value
  • 8.
    Copyright © 2016Rockwell Automation, Inc. All Rights Reserved.PUBLIC INFORMATION We Help Customers Achieve… 8 Faster Time to Market Improved Asset Utilization $ Lower Total Cost of Ownership Enterprise Risk Management Business Value Continually expanding the value we provide to customers
  • 9.
    Copyright © 2016Rockwell Automation, Inc. All Rights Reserved.PUBLIC INFORMATION 9  Technology Innovation & Broad Portfolio  The only scalable, multidiscipline, information- enabled control platform – Logix, including a Modern DCS  Secure EtherNet/IP network infrastructure  Leading market position in safety  Intelligent motor control products and systems  Domain Expertise & Global Support  Application know-how  Lifecycle support for customers in all industries  Trusted Partners & Unique Market Access Model  Channel partners, strategic alliances, technology partners Strong Foundation of Differentiation Integrated Architecture Intelligent Motor Control Solutions & Services
  • 10.
    Copyright © 2016Rockwell Automation, Inc. All Rights Reserved.PUBLIC INFORMATION 10 Differentiated Market Access Model Limited Distribution OEM Machine Builder System Integrators End User Rockwell Automation
  • 11.
    Copyright © 2016Rockwell Automation, Inc. All Rights Reserved.PUBLIC INFORMATION Attractive Growth Opportunities 11 Market Share  Productivity required to remain globally competitive  Installed base refresh  Consumer demand in emerging markets  Skills gap and aging workforce Market Growth  High performance architecture  Process (PlantPAx and services)  Midrange  Powertrain  Safety Market/Customer Share  Network infrastructure  Security  Information & data management  Operational intelligence  Bolt-on acquisitions PAM Expansion The Connected Enterprise will fuel growth across the spectrum $65 $90B  $90B market  Connected Enterprise added ~$8B  5-yr CAGR of 8% FY10 FY15 $90PAM Product Available Market (billions)
  • 12.
    Copyright © 2016Rockwell Automation, Inc. All Rights Reserved.PUBLIC INFORMATION The Connected Enterprise Supply Chain Headquarters Distribution Center Smart Grid Customers Enterprise optimization for rapid value creation Production 12
  • 13.
    Copyright © 2016Rockwell Automation, Inc. All Rights Reserved. … enabling The Connected Enterprise Integrated Control and Information… 13
  • 14.
    Copyright © 2016Rockwell Automation, Inc. All Rights Reserved. 14 How We Measure Progress  Sales and EPS growth, FCF, ROIC  Share gain in all market conditions  Measurable cost productivity every year  Customer loyalty index improvement  Connected Enterprise adoption indicators  Network infrastructure and services  Logix growth
  • 15.
    Copyright © 2016Rockwell Automation, Inc. All Rights Reserved.Rev 5058-CO900E Rockwell Automation Financial Overview
  • 16.
    Copyright © 2016Rockwell Automation, Inc. All Rights Reserved.PUBLIC INFORMATION Free Cash Flow Pension Contributions Track Record of Execution 16 Return on Invested CapitalSales Free Cash FlowAdjusted EPS Actual Results Jul 27th 2016 Guidance Actual Results Jul 27th 2016 Guidance Actual Results as of Fiscal Year End
  • 17.
    Copyright © 2016Rockwell Automation, Inc. All Rights Reserved.PUBLIC INFORMATION 17 Cash Deployment Priorities Free Cash Flow Acquisitions Dividends Share Repurchase Returned $3.5 billion to shareowners in the last 5 years Cash Returned to Shareowners
  • 18.
    Copyright © 2016Rockwell Automation, Inc. All Rights Reserved.PUBLIC INFORMATION 18 Rockwell Automation A Great Investment  Enables The Connected Enterprise  Only scalable, multidiscipline, information-enabled control platform  Provides real-time insights  Increases the business value we provide to customers Integrated Control and Information  Technology leader…focused on innovation  Domain expertise  Unique market access model  Singular focus on automation Competitive Differentiation  Productivity required to remain globally competitive  Aging installed base  Growing consumer demand in emerging markets Automation remains an attractive market  Strong balance sheet, cash flow generation and track record of returning cash to shareowners  Best in class ROIC; an intellectual capital business Financial Strength Disciplined Cash Deployment
  • 19.
    Copyright © 2016Rockwell Automation, Inc. All Rights Reserved.PUBLIC INFORMATION Total Shareowner Return 19 • Includes the reinvestment of all dividends in our common stock 2008-2015 annualized total return of 18% vs. 10% for the S&P 500
  • 20.
    Copyright © 2016Rockwell Automation, Inc. All Rights Reserved.PUBLIC INFORMATION Appendix Reconciliation to Non-GAAP Measures
  • 21.
    Copyright © 2016Rockwell Automation, Inc. All Rights Reserved.PUBLIC INFORMATION Return On Invested Capital (in millions, except percentages) Twelve Months Ended Jun. 30, Twelve Months Ended September 30, 2016 2015 2014 2013 2012 2011 2010 2009 2008 (a) Return Income from continuing operations $ 745.8 $ 827.6 $ 826.8 $ 756.3 $ 737.0 $ 697.1 $ 440.4 $ 217.9 $ 577.6 Interest expense 69.8 63.7 59.3 60.9 60.1 59.5 60.5 60.9 68.2 Income tax provision 239.3 299.9 307.4 224.6 228.9 170.5 103.8 56.0 231.3 Purchase accounting depreciation and amortization 19.1 21.0 21.6 19.3 19.8 19.8 18.9 18.6 24.2 Special charges — — — — — — — (4.0) 46.7 Return 1,074.0 1,212.2 1,215.1 1,061.1 1,045.8 946.9 623.6 349.4 948.0 (b) Average Invested Capital Short-term debt 158.5 166.6 275.5 209.0 207.2 — — 70.1 325.1 Long-term debt 1,504.2 1,261.9 905.3 905.0 905.0 904.9 904.8 904.6 804.5 Shareowners' equity 2,277.2 2,521.3 2,680.7 2,086.7 1,881.5 1,709.7 1,387.9 1,563.5 1,798.5 Accumulated amortization of goodwill and intangibles 807.9 792.6 772.7 775.2 751.0 716.7 679.4 648.3 619.0 Cash and cash equivalents (1,469.9) (1,376.1) (1,210.6) (1,010.2) (878.8) (922.7) (763.3) (576.0) (728.0) Short-term investments (784.0) (639.3) (485.2) (361.7) (232.5) — — — — Average invested capital 2,493.9 2,727.0 2,938.4 2,604.0 2,633.4 2,408.6 2,208.8 2,610.5 2,819.1 (c) Effective Tax Rate Income tax provision 239.3 299.9 307.4 224.6 228.9 170.5 103.8 56.0 231.3 Income from continuing operations before income taxes $ 985.1 $ 1,127.5 $ 1,134.2 $ 980.9 $ 965.9 $ 867.6 $ 544.2 $ 273.9 $ 808.9 Effective tax rate 24.3% 26.6% 27.1% 22.9% 23.7% 19.7% 19.1% 20.4% 28.6% (a) / (b) * (1-c) Return on Invested Capital 32.6% 32.6% 30.1% 31.4% 30.3% 31.6% 22.8% 10.7% 24.0% Reconciliation to Non-GAAP Measures 21
  • 22.
    Copyright © 2016Rockwell Automation, Inc. All Rights Reserved.PUBLIC INFORMATION Adjusted EPS Fiscal 2016 Guidance 2015 2014 2013 2012 2011 2010 2009 2008 Diluted EPS from continuing operations $5.43 - $5.63 $ 6.09 $ 5.91 $ 5.36 $ 5.13 $ 4.79 $ 3.05 $ 1.53 $ 3.89 Non-operating pension costs per diluted share 0.58 0.46 0.40 0.55 0.25 0.16 0.07 (0.14) (0.17) Tax effect of non-operating pension costs per diluted share (0.21) (0.15) (0.14) (0.20) (0.09) (0.06) (0.02) 0.05 0.07 Adjusted EPS $5.80 - $6.00 $ 6.40 $ 6.17 $ 5.71 $ 5.29 $ 4.89 $ 3.10 $ 1.44 $ 3.79 Free Cash Flow (in millions) Twelve Months Ended September 30, 2015 2014 2013 2012 2011 2010 2009 2008 Cash provided by continuing operating activities $ 1,187.7 $ 1,033.3 $ 1,014.8 $ 718.7 $ 643.7 $ 494.0 $ 526.4 $ 596.8 Capital expenditures (122.9) (141.0) (146.2) (139.6) (120.1) (99.4) (98.0) (151.0) Tax payments related to the gain on divestiture of Power Systems — — — — — — — 7.9 Excess income tax benefit from share-based compensation 12.4 29.9 31.9 18.5 38.1 16.1 2.4 4.6 Free cash flow $ 1,077.2 $ 922.2 $ 900.5 $ 597.6 $ 561.7 $ 410.7 $ 430.8 $ 458.3 Reconciliation to Non-GAAP Measures 22