Fund flow statement
•Fund flow statements is a report on the movement of funds or
working capital .It explains how working capital is raised and used
during an accounting period.
• It can be defined as,” a statement of sources and application of funds
is a technical device designed to analyses in the financial condition of
a business enterprise between two dates” - Foulke.
Various titles:
• Fund flow statement is called by various names such as statement of
sources and application of funds. Sources and uses of funds, statement
of changes in financial position, where got where gone statement,
analysis of working capital changes and movement of funds statement.
3.
Objectives of FFS
•The main objectives of FFS are:
1.To show how the resources have been obtained and used.
2.To indicate the results of current financial management.
3.To throw light upon the most important changes that have taken place
during a specific period.
4.To show how the general expansion of the business has been
financed.
5.To indicate the relationship between profits from operations,
distribution of dividend and raising of new capital or term loans.
6.To have an assessment of the working capital position of the concern.
4.
Funds &flow offunds
• Funds : The term “funds” has been defined in a number of ways. In a
narrow sense, it means cash only. A fund flow statement prepared on
cash basis is called a cash flow statement.
• In a broader sense, the term ‘funds’ refers to all financial resources.
However, the concept of funds as working capital is the most popular
and widely accepted. Working capital is the excess of current assets over
current liabilities.
• Concept of flow of funds: The term ‘flow’ means change and therefore
the term ‘flow of funds’ means ‘change in funds’ or change in working
capital. In other words, ‘flow of funds’ means any increase or decrease
in working capital. If the transaction results in increase of funds it is
called a sources of funds, if it is results in the decrease of funds it is
known as an application of funds. If the transaction does not affect the
working capital, there is no flow of funds.
5.
***
• The flowof funds occurs only when a transaction involves one current
account and another non –current account. When a transaction
involves non-current account only , no flow of fund occurs since
working capital is not altered e.g issue of share in consideration for
machinery.
• Similarly, if a transaction affects current account only, no flow of fund
occurs e.g collection of cash from debtors or payment of cash to
creditors.. Thus, to facilitate a flow of funds, the transaction must
affect one current account and another non-current account. i.e issues
of share in consideration for stock required, cash payment for building
etc.,
6.
Managerial uses
The fundflow statement is the primary importance to the financial
management. It is an essential tool for financial analysis. It is widely
used by the financial institution, financial managers and analyst.
The following are the significance;
1.Analysis financial operations
2.Evaluation of the firm’s financing
3.Answer the questions : how the loans were repaid? How much funds
were generated from operations? How were the funds used? How was
the increase in working capital financed?
4.Allocation of working capital management
5.Acts as guide to future
6.Helps financial institutions
7.
Limitation of FFS
1.It is not a substitute for an income statement or balance sheet .it
provides only some additional information regarding changes in
working capital.
2. Changes in cash more important and relevant for financial
management than the working capital.
3. It is not an original statement .it is only rearrangement of data given
in financial statements.
4. It is essentially historic in nature. A projected funds flow statement,
on the basis of it can not be prepared with much accuracy.
5. It can not reveal continuous changes.
8.
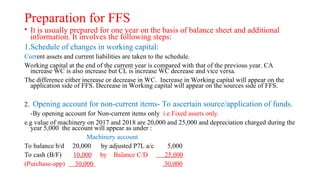
Preparation for FFS
•It is usually prepared for one year on the basis of balance sheet and additional
information. It involves the following steps:
1.Schedule of changes in working capital:
Current assets and current liabilities are taken to the schedule.
Working capital at the end of the current year is compared with that of the previous year. CA
increase WC is also increase but CL is increase WC decrease and vice versa.
The difference either increase or decrease in WC. Increase in Working capital will appear on the
application side of FFS. Decrease in Working capital will appear on the sources side of FFS.
2. Opening account for non-current items- To ascertain source/application of funds.
-By opening account for Non-current items only i.e Fixed assets only.
e.g value of machinery on 2017 and 2018 are 20,000 and 25,000 and depreciation charged during the
year 5,000 the account will appear as under :
Machinery account
To balance b/d 20,000 by adjusted P7L a/c 5,000
To cash (B/F) 10,000 by Balance C/D 25,000
(Purchase-app) 30,000 30,000
9.
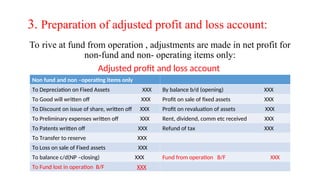
3. Preparation ofadjusted profit and loss account:
To rive at fund from operation , adjustments are made in net profit for
non-fund and non- operating items only:
Adjusted profit and loss account
Non fund and non –operating items only
To Depreciation on Fixed Assets XXX By balance b/d (opening) XXX
To Good will written off XXX Profit on sale of fixed assets XXX
To Discount on issue of share, written off XXX Profit on revaluation of assets XXX
To Preliminary expenses written off XXX Rent, dividend, comm etc received XXX
To Patents written off XXX Refund of tax XXX
To Transfer to reserve XXX
To Loss on sale of Fixed assets XXX
To balance c/d(NP –closing) XXX Fund from operation B/F XXX
To Fund lost in operation B/F XXX
10.
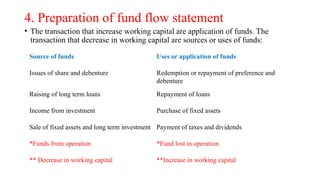
4. Preparation offund flow statement
• The transaction that increase working capital are application of funds. The
transaction that decrease in working capital are sources or uses of funds:
Source of funds Uses or application of funds
Issues of share and debenture Redemption or repayment of preference and
debenture
Raising of long term loans Repayment of loans
Income from investment Purchase of fixed assets
Sale of fixed assets and long term investment Payment of taxes and dividends
*Funds from operation *Fund lost in operation
** Decrease in working capital **Increase in working capital
11.
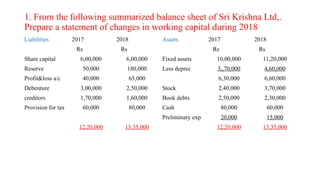
1. From thefollowing summarized balance sheet of Sri Krishna Ltd,.
Prepare a statement of changes in working capital during 2018
Liabilities 2017 2018 Assets 2017 2018
Rs Rs Rs Rs
Share capital 6,00,000 6,00,000 Fixed assets 10,00,000 11,20,000
Reserve 50,000 180,000 Less deprec 3,,70,000 4,60,000
Profit&loss a/c 40,000 65,000 6,30,000 6,60,000
Debenture 3,00,000 2,50,000 Stock 2,40,000 3,70,000
creditors 1,70,000 1,60,000 Book debts 2,50,000 2,30,000
Provision for tax 60,000 80,000 Cash 80,000 60,000
Preliminary exp 20,000 15,000
12,20,000 13,35,000 12,20,000 13,35,000
12.
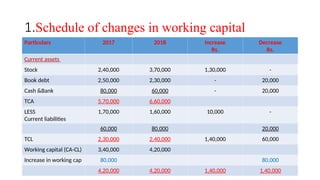
1.Schedule of changesin working capital
Particulars 2017 2018 Increase
Rs.
Decrease
Rs.
Current assets
Stock 2,40,000 3,70,000 1,30,000 -
Book debt 2,50,000 2,30,000 - 20,000
Cash &Bank 80,000 60,000 - 20,000
TCA 5,70,000 6,60,000
LESS
Current liabilities
1,70,000 1,60,000 10,000 -
60,000 80,000 20,000
TCL 2,30,000 2,40,000 1,40,000 60,000
Working capital (CA-CL) 3,40,000 4,20,000
Increase in working cap 80,000 80,000
4,20,000 4,20,000 1,40,000 1,40,000
13.
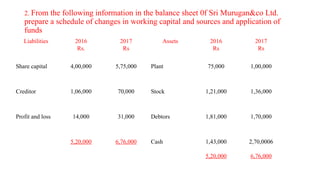
2. From thefollowing information in the balance sheet 0f Sri Murugan&co Ltd.
prepare a schedule of changes in working capital and sources and application of
funds
Liabilities 2016
Rs.
2017
Rs
Assets 2016
Rs
2017
Rs
Share capital 4,00,000 5,75,000 Plant 75,000 1,00,000
Creditor 1,06,000 70,000 Stock 1,21,000 1,36,000
Profit and loss 14,000 31,000 Debtors 1,81,000 1,70,000
5,20,000 6,76,000 Cash 1,43,000
5,20,000
2,70,0006
6,76,000
14.
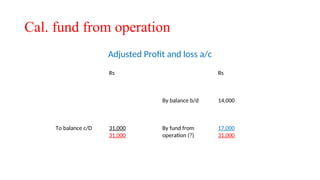
Cal. fund fromoperation
Adjusted Profit and loss a/c
Rs Rs
By balance b/d 14,000
To balance c/D 31,000
31,000
By fund from
operation (?)
17,000
31,000
15.
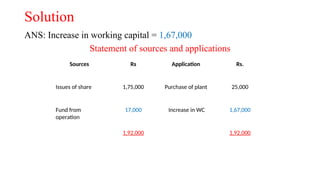
Solution
ANS: Increase inworking capital = 1,67,000
Statement of sources and applications
Sources Rs Application Rs.
Issues of share 1,75,000 Purchase of plant 25,000
Fund from
operation
17,000 Increase in WC 1,67,000
1,92,000 1,92,000
16.
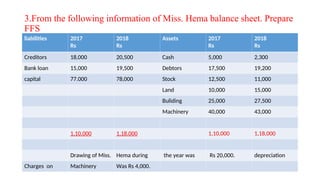
3.From the followinginformation of Miss. Hema balance sheet. Prepare
FFS
liabilities 2017
Rs
2018
Rs
Assets 2017
Rs
2018
Rs
Creditors 18,000 20,500 Cash 5,000 2,300
Bank loan 15,000 19,500 Debtors 17,500 19,200
capital 77.000 78,000 Stock 12,500 11,000
Land 10,000 15,000
Buliding 25,000 27,500
Machinery 40,000 43,000
1,10,000 1,18,000 1,10,000 1,18,000
Drawing of Miss. Hema during the year was Rs 20,000. depreciation
Charges on Machinery Was Rs 4,000.
17.
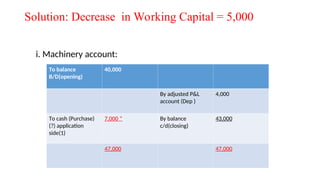
Solution: Decrease inWorking Capital = 5,000
i. Machinery account:
To balance
B/D(opening)
40,000
By adjusted P&L
account (Dep )
4,000
To cash (Purchase)
(?) application
side(1)
7,000 * By balance
c/d(closing)
43,000
47,000 47,000
18.
***
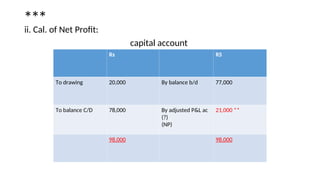
ii. Cal. ofNet Profit:
capital account
Rs RS
To drawing 20,000 By balance b/d 77,000
To balance C/D 78,000 By adjusted P&L ac
(?)
(NP)
21,000 **
98,000 98,000
19.
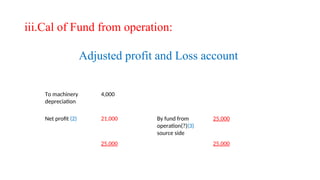
iii.Cal of Fundfrom operation:
Adjusted profit and Loss account
To machinery
depreciation
4,000
Net profit (2) 21,000 By fund from
operation(?)(3)
source side
25,000
25,000 25,000
20.
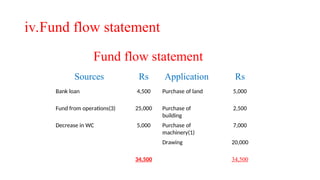
iv.Fund flow statement
Fundflow statement
Sources Rs Application Rs
Bank loan 4,500 Purchase of land 5,000
Fund from operations(3) 25,000 Purchase of
building
2,500
Decrease in WC 5,000 Purchase of
machinery(1)
7,000
Drawing 20,000
34,500 34,500
21.
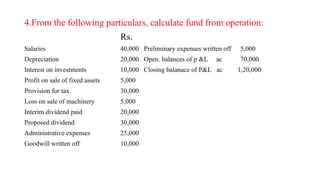
4.From the followingparticulars, calculate fund from operation:
Rs.
Salaries 40,000 Preliminary expenses written off 5,000
Depreciation 20,000 Open. balances of p &L ac 70,000
Interest on investments 10,000 Closing balanace of P&L ac 1,20,000
Profit on sale of fixed assets 5,000
Provision for tax 30,000
Loss on sale of machinery 5,000
Interim dividend paid 20,000
Proposed dividend 30,000
Administrative expenses 25,000
Goodwill written off 10,000
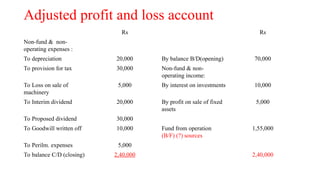
22.
Adjusted profit andloss account
Rs Rs
Non-fund & non-
operating expenses :
To depreciation 20,000 By balance B/D(opening) 70,000
To provision for tax 30,000 Non-fund & non-
operating income:
To Loss on sale of
machinery
5,000 By interest on investments 10,000
To Interim dividend 20,000 By profit on sale of fixed
assets
5,000
To Proposed dividend 30,000
To Goodwill written off 10,000 Fund from operation
(B/F) (?) sources
1,55,000
To Perilm. expenses 5,000
To balance C/D (closing) 2,40,000 2,40,000
23.
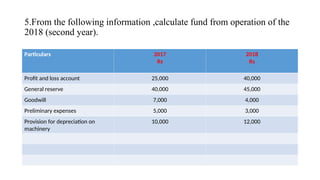
5.From the followinginformation ,calculate fund from operation of the
2018 (second year).
Particulars 2017
Rs
2018
Rs
Profit and loss account 25,000 40,000
General reserve 40,000 45,000
Goodwill 7,000 4,000
Preliminary expenses 5,000 3,000
Provision for depreciation on
machinery
10,000 12,000
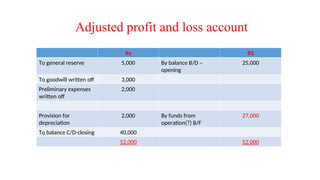
24.
Adjusted profit andloss account
Rs RS
To general reserve 5,000 By balance B/D –
opening
25,000
To goodwill written off 3,000
Preliminary expenses
written off
2,000
Provision for
depreciation
2,000 By funds from
operation(?) B/F
27,000
To balance C/D-closing 40,000
52,000 52,000
25.
***
Note:
•Non-fund and non-operatingitems are taken into account in the
preparation of adjusted profit and loss account.
•Changes during the second year are ascertained by comparison with
first year. For instance, transfer to general reserve, during the second
year is (45,000-40,0000) Rs.5,000
26.
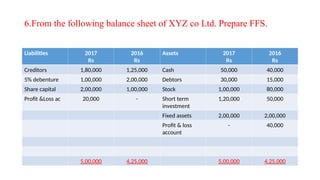
6.From the followingbalance sheet of XYZ co Ltd. Prepare FFS.
Liabilities 2017
Rs
2016
Rs
Assets 2017
Rs
2016
Rs
Creditors 1,80,000 1,25,000 Cash 50,000 40,000
5% debenture 1,00,000 2,00,000 Debtors 30,000 15,000
Share capital 2,00,000 1,00,000 Stock 1,00,000 80,000
Profit &Loss ac 20,000 - Short term
investment
1,20,000 50,000
Fixed assets 2,00,000 2,00,000
Profit & loss
account
- 40,000
5,00,000 4,25,000 5,00,000 4,25,000
27.
***
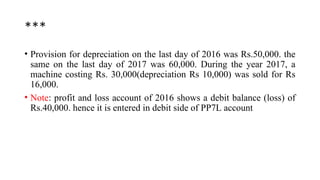
• Provision fordepreciation on the last day of 2016 was Rs.50,000. the
same on the last day of 2017 was 60,000. During the year 2017, a
machine costing Rs. 30,000(depreciation Rs 10,000) was sold for Rs
16,000.
• Note: profit and loss account of 2016 shows a debit balance (loss) of
Rs.40,000. hence it is entered in debit side of PP7L account
28.
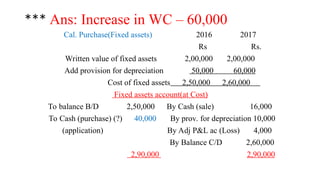
*** Ans: Increasein WC – 60,000
Cal. Purchase(Fixed assets) 2016 2017
Rs Rs.
Written value of fixed assets 2,00,000 2,00,000
Add provision for depreciation 50,000 60,000
Cost of fixed assets 2,50,000 2,60,000
Fixed assets account(at Cost)
To balance B/D 2,50,000 By Cash (sale) 16,000
To Cash (purchase) (?) 40,000 By prov. for depreciation 10,000
(application) By Adj P&L ac (Loss) 4,000
By Balance C/D 2,60,000
2,90,000 2,90,000
29.
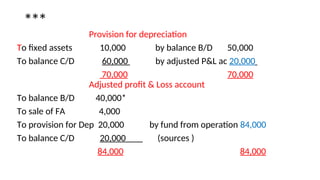
***
Provision for depreciation
Tofixed assets 10,000 by balance B/D 50,000
To balance C/D 60,000 by adjusted P&L ac 20,000
70,000 70,000
Adjusted profit & Loss account
To balance B/D 40,000*
To sale of FA 4,000
To provision for Dep 20,000 by fund from operation 84,000
To balance C/D 20,000 (sources )
84,000 84,000
30.
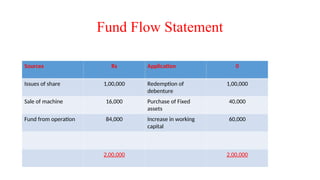
Fund Flow Statement
SourcesRs Application 0
Issues of share 1,00,000 Redemption of
debenture
1,00,000
Sale of machine 16,000 Purchase of Fixed
assets
40,000
Fund from operation 84,000 Increase in working
capital
60,000
2,00,000 2,00,000
31.
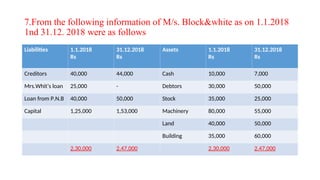
7.From the followinginformation of M/s. Block&white as on 1.1.2018
1nd 31.12. 2018 were as follows
Liabilities 1.1.2018
Rs
31.12.2018
Rs
Assets 1.1.2018
Rs
31.12.2018
Rs
Creditors 40,000 44,000 Cash 10,000 7,000
Mrs.Whit’s loan 25,000 - Debtors 30,000 50,000
Loan from P.N.B 40,000 50,000 Stock 35,000 25,000
Capital 1,25,000 1,53,000 Machinery 80,000 55,000
Land 40,000 50,000
Building 35,000 60,000
2,30,000 2,47,000 2,30,000 2,47,000
32.
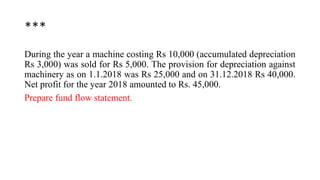
***
During the yeara machine costing Rs 10,000 (accumulated depreciation
Rs 3,000) was sold for Rs 5,000. The provision for depreciation against
machinery as on 1.1.2018 was Rs 25,000 and on 31.12.2018 Rs 40,000.
Net profit for the year 2018 amounted to Rs. 45,000.
Prepare fund flow statement.
33.
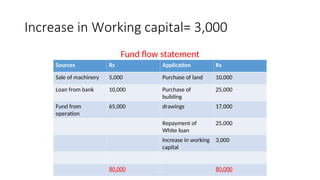
Increase in Workingcapital= 3,000
Fund flow statement
Sources Rs Application Rs
Sale of machinery 5,000 Purchase of land 10,000
Loan from bank 10,000 Purchase of
building
25,000
Fund from
operation
65,000 drawings 17,000
Repayment of
White loan
25,000
Increase in working
capital
3,000
80,000 80,000
34.
Working
• Cost ofmachinery 1.1.18 31.12.18
Written down value of machinery 80,000 55,000
Add provision for dep 25,000 40,000
Cost of the machinery 1,05,000 95,000
Machinery ac ( at cost)
To Balance B/D 1,05,000 by cash (sale) 5,000
by provision for Dep 3000
by Adjusted P&L 2000
by Balance C/d 95,000
1,05,000 105,000
Provision for Dep on Machinery account
To machinery(dep. on sold) 3,000 by balance B/D 25,000
To balance C/D 40,000 by adjusted p&l ac(?) 18,000
43,000 43,000
35.
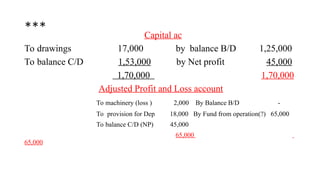
*** Capital ac
Todrawings 17,000 by balance B/D 1,25,000
To balance C/D 1,53,000 by Net profit 45,000
1,70,000 1,70,000
Adjusted Profit and Loss account
To machinery (loss ) 2,000 By Balance B/D -
To provision for Dep 18,000 By Fund from operation(?) 65,000
To balance C/D (NP) 45,000
65,000
65,000
36.
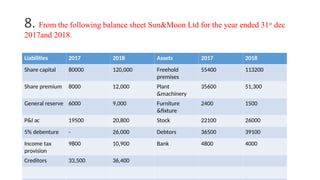
8. From thefollowing balance sheet Sun&Moon Ltd for the year ended 31st
dec
2017and 2018.
Liabilities 2017 2018 Assets 2017 2018
Share capital 80000 120,000 Freehold
premises
55400 113200
Share premium 8000 12,000 Plant
&machinery
35600 51,300
General reserve 6000 9,000 Furniture
&fixture
2400 1500
P&l ac 19500 20,800 Stock 22100 26000
5% debenture - 26,000 Debtors 36500 39100
Income tax
provision
9800 10,900 Bank 4800 4000
Creditors 33,500 36,400
37.
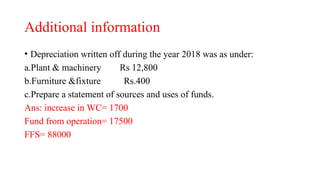
Additional information
• Depreciationwritten off during the year 2018 was as under:
a.Plant & machinery Rs 12,800
b.Furniture &fixture Rs.400
c.Prepare a statement of sources and uses of funds.
Ans: increase in WC= 1700
Fund from operation= 17500
FFS= 88000