Downloaded 14 times


![© 2022 Neo4j, Inc. All rights reserved.
Exercise 2: Hello World
Instructions
• Create a folder under /src called /components
• Create a file called Hello.js under /components
Hello.js
16
import React, { useState } from "react";
export function Hello (props) {
const [name, setName] = useState('Eric');
return (
<h1>Hello, {name}</h1>
)
}
Exercise
Use your own name](https://image.slidesharecdn.com/oazembztqgaermueqshv-full-stack-visualization-build-a-react-app-with-a-sankey-diagram-eric-monk-220719173443-2aa19647/85/Full-Stack-Visualization-Build-A-React-App-With-A-Sankey-Diagram-16-320.jpg)


![© 2022 Neo4j, Inc. All rights reserved.
Exercise 3: Integrate Sankey (continued)
23
Exercise
export const data = [
["From", "To", "Weight"],
["A", "X", 5],
["A", "Y", 7],
["A", "Z", 6],
["B", "X", 2],
["B", "Y", 9],
["B", "Z", 4],
["X", "W", 5],
["X", "W", 7],
["W", "Y", 1],
["W", "Z", 9],
];
// ...continued on next page...](https://image.slidesharecdn.com/oazembztqgaermueqshv-full-stack-visualization-build-a-react-app-with-a-sankey-diagram-eric-monk-220719173443-2aa19647/85/Full-Stack-Visualization-Build-A-React-App-With-A-Sankey-Diagram-23-320.jpg)


![© 2022 Neo4j, Inc. All rights reserved.
Next Steps
27
We passed hard-coded data into the Sankey
We want to make this dynamic and stateful with useState
const [sankeyData, setSankeyData] = useState(data);
<Chart
...
data={sankeyData}
options={options}
/>
We need to update Chart to use sankeyData
Change from data to
sankeyData](https://image.slidesharecdn.com/oazembztqgaermueqshv-full-stack-visualization-build-a-react-app-with-a-sankey-diagram-eric-monk-220719173443-2aa19647/85/Full-Stack-Visualization-Build-A-React-App-With-A-Sankey-Diagram-27-320.jpg)


![© 2022 Neo4j, Inc. All rights reserved.
Sample Graph
35
MATCH p1=(cs:CommodityStat)-[:COMMODITY]->(c), p2=(cs)-[:BY]->(mode),
p3=(senderType:GeoType)<-[:TYPE]-(sender:Geo)-[:SENT]->(cs)-[:TO]->
(dest:Geo)-[:TYPE]->(destType:GeoType)
RETURN p1, p2, p3 LIMIT 3](https://image.slidesharecdn.com/oazembztqgaermueqshv-full-stack-visualization-build-a-react-app-with-a-sankey-diagram-eric-monk-220719173443-2aa19647/85/Full-Stack-Visualization-Build-A-React-App-With-A-Sankey-Diagram-35-320.jpg)
![© 2022 Neo4j, Inc. All rights reserved.
Need to Query data in format Sankey needs
36
Sankey needs data in form of
[
["A", "X", 5],
["A", "Y", 7],
...
]
An array of 3-element arrays. Where each 3 element array is:
• First element: start node/item
• Second element: destination node/item
• Third element: quantity value between start/destination](https://image.slidesharecdn.com/oazembztqgaermueqshv-full-stack-visualization-build-a-react-app-with-a-sankey-diagram-eric-monk-220719173443-2aa19647/85/Full-Stack-Visualization-Build-A-React-App-With-A-Sankey-Diagram-36-320.jpg)
![© 2022 Neo4j, Inc. All rights reserved.
Query to return sender, dest, value
37
WITH {
geotype: 'Division',
commodityType: '02'
} as params
MATCH (stat:CommodityStat)-[:COMMODITY]->(c:Commodity {id: params.commodityType}), (geoType:GeoType
{name:params.geotype})
MATCH (geoType)<-[:TYPE]-(sender:Geo)-[:SENT]->(stat:CommodityStat)-[:TO]->(dest:Geo)-[:TYPE]-
>(geoType)
WITH sender.name as sender, sum(stat.tonsInThousands) as tons1000, dest.name as dest
WHERE tons1000 > 0
RETURN sender, tons1000, dest](https://image.slidesharecdn.com/oazembztqgaermueqshv-full-stack-visualization-build-a-react-app-with-a-sankey-diagram-eric-monk-220719173443-2aa19647/85/Full-Stack-Visualization-Build-A-React-App-With-A-Sankey-Diagram-37-320.jpg)


![© 2022 Neo4j, Inc. All rights reserved.
Example Schema
type Movie {
title: String!
year: Int
plot: String
actors: [Person]
}
type Person {
name: String!
movies: [Movie]
}
type Query {
searchMovieByTitle(title: String!): [Movie!]
}
42
Specific types like Movie and Person describe your data
Type Query is special and defines a resolver function signature](https://image.slidesharecdn.com/oazembztqgaermueqshv-full-stack-visualization-build-a-react-app-with-a-sankey-diagram-eric-monk-220719173443-2aa19647/85/Full-Stack-Visualization-Build-A-React-App-With-A-Sankey-Diagram-42-320.jpg)

![© 2022 Neo4j, Inc. All rights reserved.
Neo4j Schema annotations
type Movie {
title: String!
year: Int
plot: String
actors: [Person] @relationship(type: "ACTED_IN", direction: IN)
}
type Person {
name: String!
movies: [Movie] @relationship(type: "ACTED_IN", direction: OUT)
}
type Query {
searchMovieByTitle(title: String!): [Movie!] @cypher(statement: """
MATCH (m:Movie) WHERE toLower(m.title) CONTAINS toLower($title) RETURN m
""")
}
44
@cypher used to provide
an in-line resolver
@relationship annotation
used to auto-generate code](https://image.slidesharecdn.com/oazembztqgaermueqshv-full-stack-visualization-build-a-react-app-with-a-sankey-diagram-eric-monk-220719173443-2aa19647/85/Full-Stack-Visualization-Build-A-React-App-With-A-Sankey-Diagram-44-320.jpg)


![© 2022 Neo4j, Inc. All rights reserved.
Architecture Data Flow
54
getSankeyData()
MATCH (...) RETURN (...)
[start, end, value]
[start, end, value]
updateSankey()](https://image.slidesharecdn.com/oazembztqgaermueqshv-full-stack-visualization-build-a-react-app-with-a-sankey-diagram-eric-monk-220719173443-2aa19647/85/Full-Stack-Visualization-Build-A-React-App-With-A-Sankey-Diagram-54-320.jpg)
![© 2022 Neo4j, Inc. All rights reserved.
Enhance GraphQL to return Sankey data
type SankeyRelationship {
start: String
end: String
value: Int
}
type Query {
sankeyByGeoTypeAllCommoditiesByTransportMode(geoType: String!):
[SankeyRelationship] @cypher(statement: """
MATCH (stat:CommodityStat)-[:COMMODITY]->(c:Commodity)
...more cypher...
RETURN {
start: sender,
value: tons1000,
end: dest
}
""")
55
create SankeyRelationship to hold
start, end, value data
pull Cypher statement from previous
section and add with cypher directive
modify RETURN to return a map of
start, value, end
(we'll convert to an array in UI)](https://image.slidesharecdn.com/oazembztqgaermueqshv-full-stack-visualization-build-a-react-app-with-a-sankey-diagram-eric-monk-220719173443-2aa19647/85/Full-Stack-Visualization-Build-A-React-App-With-A-Sankey-Diagram-55-320.jpg)
![© 2022 Neo4j, Inc. All rights reserved.
Exercise 7: Enhance GraphQL API
56
Exercise
Follow steps in exercise7/exercise7.md
Things to note:
• We use UNION to return 2 lists of [start, end, value] in
the same response.
• An input parameter called geoType: String! is used
• Parameter $geoType is used in the @cypher directive](https://image.slidesharecdn.com/oazembztqgaermueqshv-full-stack-visualization-build-a-react-app-with-a-sankey-diagram-eric-monk-220719173443-2aa19647/85/Full-Stack-Visualization-Build-A-React-App-With-A-Sankey-Diagram-56-320.jpg)


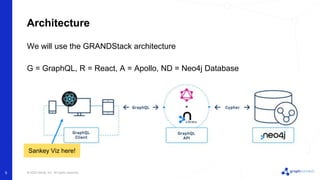
The document outlines an agenda for a presentation on building a full-stack visualization with React and a Sankey diagram, including introducing React, integrating the Sankey diagram with React Google Charts, loading and modeling commodity flow data from the US Census Bureau in Neo4j, and using GraphQL to query the Neo4j database. The presentation will take the audience through setting up a React project, rendering a Sankey diagram, modeling and loading sample data into Neo4j, and implementing GraphQL to retrieve sankey data from Neo4j.