The document discusses various aspects of quantitative fairness in computational journalism, focusing on biases in algorithmic decisions related to criminal justice, lending, and child maltreatment screening. It examines experimental versus observational bias measurements, the implications of machine learning on fairness, and the challenges of achieving equitable outcomes for different demographic groups. The analysis includes examples of racial bias in judicial decisions, sentencing disparities, and the complexities of machine-driven risk assessments.
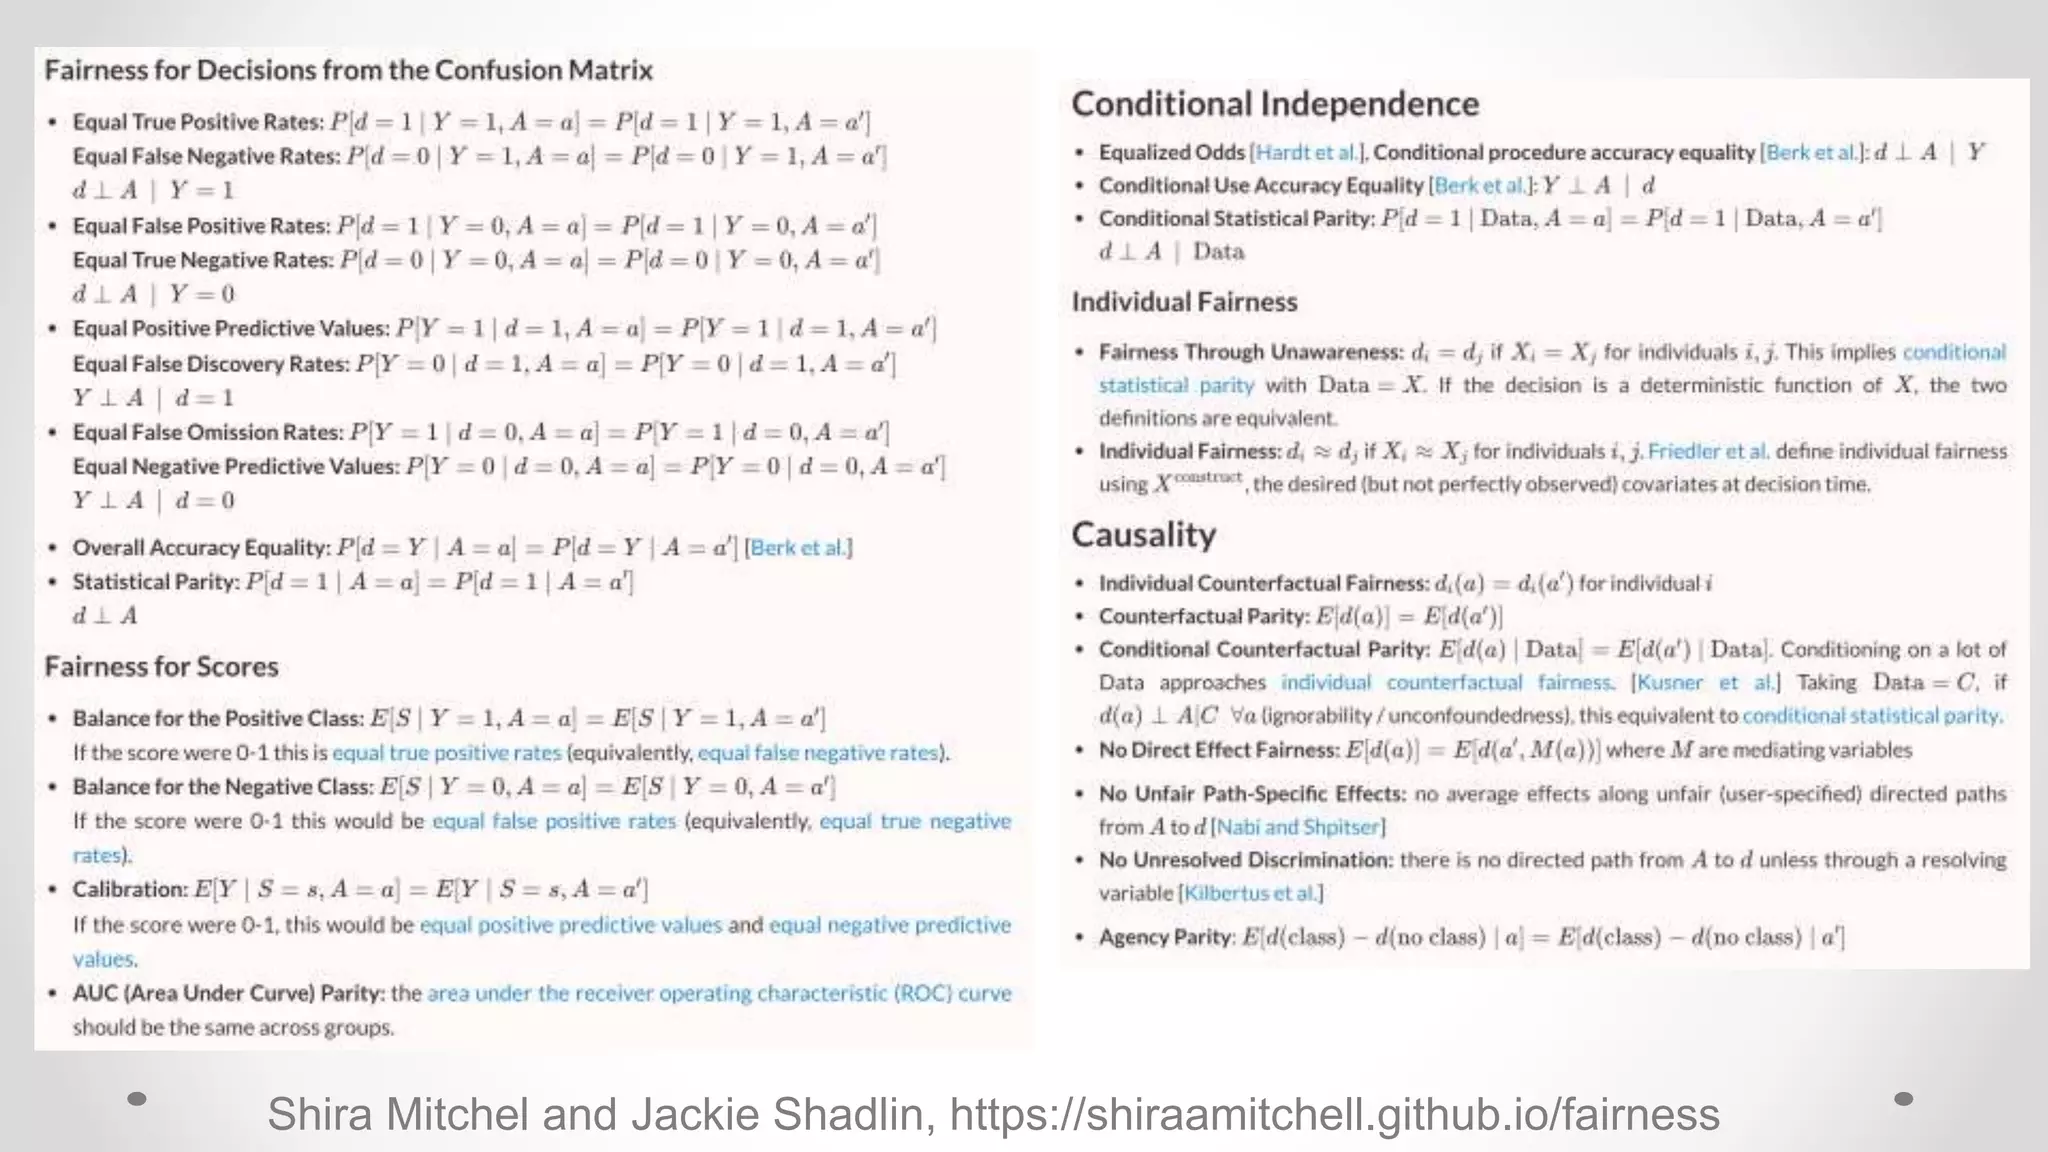
![Notation for fairness properties
Observable features of each case are a vector X
The class or group membership of each case is A
Model outputs a numeric “score” R
R = r(X,A) ∊ [0,1]
We turn the score into a binary classification C by thresholding at t
C = r > t
The true outcome (this is a prediction) is the binary variable Y
A perfect predictor would have
C = Y](https://image.slidesharecdn.com/lecture6algorithmicaccountability2-181021180630/75/Frontiers-of-Computational-Journalism-week-6-Quantitative-Fairness-25-2048.jpg)