
Downloaded 46 times
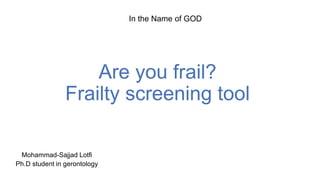
![• (Frailty[Title]) AND tool[Title]=23
• (Frailty[Title]) AND Diagnostic[Title]=7
• (Frailty[Title]) AND screening[Title]= 65
• (Frailty[Title]) AND instrument[Title]=18
• ((validation[Title/Abstract]) AND index[Title]) AND
Frailty[Title]=18
•](https://image.slidesharecdn.com/frailtyscreeningtool-181114104028/85/Frailty-screening-tool-2-320.jpg)


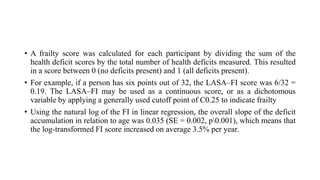


![• The GFST showed a sensitivity of 71.0%, a specificity of 70.2%, a
positive predictive value of 75.9% and a negative predictive value of
64.7% at the identification of non-disabled frail elders. The positive
and negative likelihood ratios were 2.38 and 0.41, respectively. In
logistic regression models only slow gait speed (odds ratio [OR]:
19.65, 95% confidence interval [95% CI]: 4.69–82.35) and mobility
issues (OR: 18.04, 95% CI: 3.11–104.78) were significantly
associated with the condition of frailty in the absence of disability](https://image.slidesharecdn.com/frailtyscreeningtool-181114104028/85/Frailty-screening-tool-21-320.jpg)


The document discusses various screening tools that can be used to assess frailty. It provides descriptions of 20 different frailty screening tools, including what components they assess (such as physical functioning, cognition, nutrition), how they are scored, and their validation results showing sensitivity, specificity and ability to predict frailty. It also includes links to online calculators for tools like the SHARE Frailty Index and provides examples of how to interpret the scores from tools like the Groningen Frailty Index.


