Download to read offline
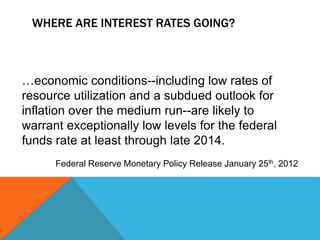


The document discusses the Federal Reserve's monetary policy outlook. It states that given current economic conditions, including low rates of resource utilization and subdued inflation projections, the Federal Reserve expects to maintain exceptionally low interest rates through at least late 2014.


