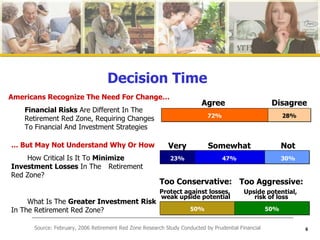
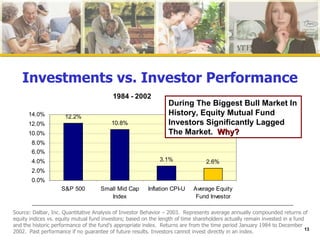
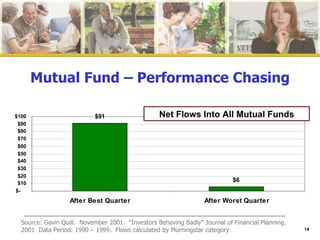
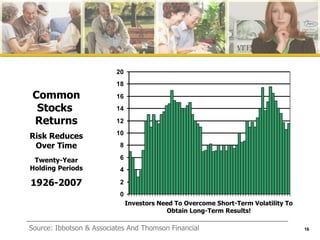
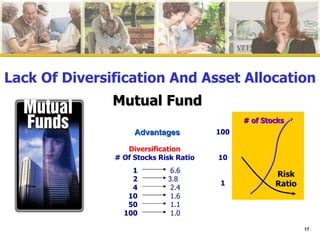
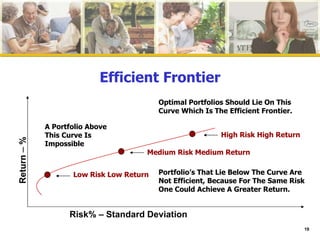
Decision Time Starts With   PLANNING DAN  PYLE FINANCIAL Money Concepts
Planning For An Enriched Retirement Lifestyle  Financial Planning / Wealth Management  Insurance Needs Legal Affairs Estate Issues
Self-Assessment Retirement Satisfaction Exercise  What Do I Need To Make Me Feel Happy And Satisfied? What Do I Want My Life To Be Like?  What Personal And Financial Resources Do I Have? Lifestyle
What Is Your Vision For Retirement? Lifestyle Homebodies Snowbirds Globetrotters Part-Timers “ What Do I Want To Do With The Rest Of My Life?”
Decision Time In A Recent Survey Conducted By Guardian Life Insurance, 80% Of Baby Boomers Expressed Concern About Having Adequate Retirement Income.  Approximately Half Of Boomers, Meanwhile, Were Uncertain About How Much Money They Need To Retire. 1 A Principal Financial Survey Found That Two-thirds Of Workers Older Than 55 Expect That Their Standard Of Living Will Decline Once They Enter Retirement. 1 1 Retirement Services Roundtable, “The Next Generation: Strengthening Relationships with the Upcoming Generations of Retirees,” 2005
Decision Time Americans Recognize The Need For Change… Financial Risks  Are Different In The  Retirement Red Zone, Requiring Changes To Financial And Investment Strategies …  But May Not Understand Why Or How How Critical Is It To  Minimize  Investment   Losses  In The  Retirement Red Zone? What Is The  Greater Investment  Risk  In The Retirement Red Zone? 72% 28% Agree Disagree Very Not Somewhat 23% 30% 47% Too Aggressive: Upside potential,  risk of loss Too Conservative: Protect against losses,  weak upside potential 50% 50% Source: February, 2006 Retirement Red Zone Research Study Conducted by Prudential Financial
The Pitfalls You Must Avoid Lifestyle Outliving Your Assets Understanding The Effects Of Inflation And Taxes  Not Knowing The Difference Between Compound Growth And Simple Interest Taking Too Much Or To Little Risk Lack Of Diversification And Asset Allocation  Reacting To Short Term Results In A Long Term Strategy Failing To Plan For The Unexpected
62%  Have Annual Incomes Under $25,000 9%   Have Annual Incomes Over $70,000 12%  Have Annual Incomes Between $40,000 and $70,000 17%  Have Annual Incomes Between  $25,000 and $40,000 Retirement Statistics Source: Social Security Administration, The Office of Policy, Income of the Population 55 or older 2002, table 3.1; released May 2004. 62% 17% 12% 9%
Source: U.S. Department of Health and Human Services . Source of Income Sources of Baby Boomers’ Retirement Income: Beliefs vs. Reality Belief Reality Company Pensions 45% 20% Social Security 26% 18% Private Savings 22% 33% Other 4% 2% Work Earnings 3% 27%
1980  1000 1981   897 1982   850 1983   823 1984  788 1985  759 1986   745 1987  718 1988  689 1989   655 1990   620 1991   594 1992   576 1993   559 1994   545 1995   529 1996  513 502 494 483 466 453 445 434 422 406 25 Year Average Inflation Rate 3.15%
’ 26  ’65   ‘06 Source: Ibbotson & Associates And Morning Star Common Stocks Returns One-Year Holding Period 1926-2007
Reacting To Short Term Results  In A Long Term Strategy The Stock Market Fluctuates Dramatically  Over The Long Term The Results Are Positive  Time Is Your Ally When You Invest; While The Stock Market Has A 28.8% Chance Of Going Down In Any One Year, The Chance Of Losing Money Over 15 Years is 0* *Past Performance Does Not Guarantee Future Results
Investments vs. Investor Performance During The Biggest Bull Market In History, Equity Mutual Fund Investors Significantly Lagged The Market.  Why? Source: Dalbar, Inc. Quantitative Analysis of Investor Behavior – 2003.  Represents average annually compounded returns of equity indices vs. equity mutual fund investors; based on the length of time shareholders actually remain invested in a fund and the historic performance of the fund’s appropriate index.  Returns are from the time period January 1984 to December 2002.  Past performance if no guarantee of future results. Investors cannot invest directly in an index.
Source: Gavin Quill.  November 2001.  “Investors Behaving Badly” Journal of Financial Planning. 2001  Data Period: 1990 – 1999.  Flows calculated by Morningstar category Mutual Fund – Performance Chasing Net Flows Into All Mutual Funds
Don’t Allow Emotions To Dictate Decisions Riding The Emotional Wave Of Investing Confident Time To Invest Euphoric Invest Everything Aggressively Defeated Sell Everything Confident Hopeful Maybe Things Are Turning  Around (I’ll Wait And See) Nervous What’s Going On The Very Ease Of Moving Investments From One To The Other Carries With It The Risk  Of Being Emotionally Whipsawed Into Selling At The Bottom And Buying At The Top
Source: Ibbotson & Associates And Thomson Financial Investors Need To Overcome Short-Term Volatility To Obtain Long-Term Results! 1926  1930   1940  1950  1960  1970  1984  2006 Common Stocks  Returns Twenty-Year Holding Periods 1926-2007 Risk Reduces Over Time
Lack Of Diversification And Asset Allocation 100 10 1 # of Stocks Risk Ratio Advantages Mutual Fund 1 2 4 10 50 100 6.6 3.8  2.4 1.6 1.1 1.0 Diversification # Of Stocks Risk Ratio
Asset Allocation Three Major Benefits To An Investor It Provides Management Discipline. It Emphasizes The Development Of An Asset Allocation Policy. When Followed Over Several Market Cycles, It May Deliver A Higher Return For The Risk Taken.
Efficient Frontier Risk% – Standard Deviation Return  –  % Low Risk Low Return Medium Risk Medium Return High Risk High Return A Portfolio Above This Curve Is Impossible Optimal Portfolios Should Lie On This Curve Which Is The Efficient Frontier. Portfolio’s That Lie Below The Curve Are Not Efficient, Because For The Same Risk One Could Achieve A Greater Return.
Asset Allocation Without Rebalancing Without Periodic Rebalancing Your Asset Allocation Can Drift Substantially From Your Targets Peak Equity Exposures Occur At Peaks In the Equity Market, Increasing Your Risk Data is from December 1985 to December 1999.  Fixed Income is represented by the Lehman Brothers Aggregate Index.  Equities are represented by the S&P 500 Index.  The Starting portfolio of 50% fixed income and 50% equities is not rebalanced for the entire period shown. 50% 50% 77% 23% Fixed Income Equities 1985 1999
Data is from January 1981 – March 2005.  Portfolios consist of 12% International Stocks (MSCI EAFE), 10% small-mid capitalization stocks (Russell 2500), 28% Large-cap stocks (SP500) and 50% (Lehman Brothers Aggregate), Rebalanced portfolio is rebalanced quarterly.  Source: MPI Style, LFA Rebalancing Helps Reduce Risk 1981 - 2005
Guarantees Help People Think Differently about Risk If An Investment Product Offered: Guarantee Against Principal Loss, And/Or Guarantee Minimum Annual Return With Further Upside Potential… …  How Would It Affect Your Investment Behaviors? 74% 72% 63% Stay In Stock Market Even If Short-Term Losses Choose More Aggressive Investments With Greater Potential For Returns Invest For Longer-Term Horizon Source: February, 2006 Retirement Red Zone Research Study Conducted by Prudential Financial. All guarantees are based on the claims-paying ability of the issuing insurance company.
The Effect of Market Returns on Portfolio Balances Hypothetical Example * (5% Withdrawals Begin At Age 62) Source: February, 2006 Retirement Red Zone Research Study Conducted by Prudential Financial. * This example does not represent the performance of any particular investment. Early Market Decline Late Market Decline Annual Return Account Balance Annual Return Account Balance Starting account value $250,000 $250,000 Age 62 -17.6% $193,500 16.6% $279,000 Age 63 -12.8% $155,857 7.4% $286,771 Age 64 -3.5% $137,141 12.0% $307,922 Age 69 7.1% $108,440 11.3% $394,055 Age 70 16.9% $110,932 14.9% $416,444 Age 77 -3.2% $34,841 -3.2% $605,061 Age 79 14.9% $0 16.9% $690,067 Age 88 11.3% $0 7.1% $1,132,926 Age 89 12.0% $0 -3.5% $1,065,507 Age 90 7.4% $0 -12.8% $900,523 Age 91 16.6% $0 -17.6% $712,574 Average annual rate of  return for 30-year period 7.0% 7.0%
Money Concepts International. Inc. 11440 N. Jog Road Palm Beach Gardens, FL 33418 Tel:. 561.472.2000  www.moneyconcepts.com All Securities Through Money Concepts Capital Corp. Member FINRA/SIPC Money Concepts Advisory Service Is A Registered Investment Advisor With The SEC All Non Securities And Non Advisory Products Through Money Concepts International, Inc. Providers of Financial Services Since 1979

Linked In

  • 1.
    Decision Time StartsWith PLANNING DAN PYLE FINANCIAL Money Concepts
  • 2.
    Planning For AnEnriched Retirement Lifestyle Financial Planning / Wealth Management Insurance Needs Legal Affairs Estate Issues
  • 3.
    Self-Assessment Retirement SatisfactionExercise What Do I Need To Make Me Feel Happy And Satisfied? What Do I Want My Life To Be Like? What Personal And Financial Resources Do I Have? Lifestyle
  • 4.
    What Is YourVision For Retirement? Lifestyle Homebodies Snowbirds Globetrotters Part-Timers “ What Do I Want To Do With The Rest Of My Life?”
  • 5.
    Decision Time InA Recent Survey Conducted By Guardian Life Insurance, 80% Of Baby Boomers Expressed Concern About Having Adequate Retirement Income. Approximately Half Of Boomers, Meanwhile, Were Uncertain About How Much Money They Need To Retire. 1 A Principal Financial Survey Found That Two-thirds Of Workers Older Than 55 Expect That Their Standard Of Living Will Decline Once They Enter Retirement. 1 1 Retirement Services Roundtable, “The Next Generation: Strengthening Relationships with the Upcoming Generations of Retirees,” 2005
  • 6.
    Decision Time AmericansRecognize The Need For Change… Financial Risks Are Different In The Retirement Red Zone, Requiring Changes To Financial And Investment Strategies … But May Not Understand Why Or How How Critical Is It To Minimize Investment Losses In The Retirement Red Zone? What Is The Greater Investment Risk In The Retirement Red Zone? 72% 28% Agree Disagree Very Not Somewhat 23% 30% 47% Too Aggressive: Upside potential, risk of loss Too Conservative: Protect against losses, weak upside potential 50% 50% Source: February, 2006 Retirement Red Zone Research Study Conducted by Prudential Financial
  • 7.
    The Pitfalls YouMust Avoid Lifestyle Outliving Your Assets Understanding The Effects Of Inflation And Taxes Not Knowing The Difference Between Compound Growth And Simple Interest Taking Too Much Or To Little Risk Lack Of Diversification And Asset Allocation Reacting To Short Term Results In A Long Term Strategy Failing To Plan For The Unexpected
  • 8.
    62% HaveAnnual Incomes Under $25,000 9% Have Annual Incomes Over $70,000 12% Have Annual Incomes Between $40,000 and $70,000 17% Have Annual Incomes Between $25,000 and $40,000 Retirement Statistics Source: Social Security Administration, The Office of Policy, Income of the Population 55 or older 2002, table 3.1; released May 2004. 62% 17% 12% 9%
  • 9.
    Source: U.S. Departmentof Health and Human Services . Source of Income Sources of Baby Boomers’ Retirement Income: Beliefs vs. Reality Belief Reality Company Pensions 45% 20% Social Security 26% 18% Private Savings 22% 33% Other 4% 2% Work Earnings 3% 27%
  • 10.
    1980 10001981 897 1982 850 1983 823 1984 788 1985 759 1986 745 1987 718 1988 689 1989 655 1990 620 1991 594 1992 576 1993 559 1994 545 1995 529 1996 513 502 494 483 466 453 445 434 422 406 25 Year Average Inflation Rate 3.15%
  • 11.
    ’ 26 ’65 ‘06 Source: Ibbotson & Associates And Morning Star Common Stocks Returns One-Year Holding Period 1926-2007
  • 12.
    Reacting To ShortTerm Results In A Long Term Strategy The Stock Market Fluctuates Dramatically Over The Long Term The Results Are Positive Time Is Your Ally When You Invest; While The Stock Market Has A 28.8% Chance Of Going Down In Any One Year, The Chance Of Losing Money Over 15 Years is 0* *Past Performance Does Not Guarantee Future Results
  • 13.
    Investments vs. InvestorPerformance During The Biggest Bull Market In History, Equity Mutual Fund Investors Significantly Lagged The Market. Why? Source: Dalbar, Inc. Quantitative Analysis of Investor Behavior – 2003. Represents average annually compounded returns of equity indices vs. equity mutual fund investors; based on the length of time shareholders actually remain invested in a fund and the historic performance of the fund’s appropriate index. Returns are from the time period January 1984 to December 2002. Past performance if no guarantee of future results. Investors cannot invest directly in an index.
  • 14.
    Source: Gavin Quill. November 2001. “Investors Behaving Badly” Journal of Financial Planning. 2001 Data Period: 1990 – 1999. Flows calculated by Morningstar category Mutual Fund – Performance Chasing Net Flows Into All Mutual Funds
  • 15.
    Don’t Allow EmotionsTo Dictate Decisions Riding The Emotional Wave Of Investing Confident Time To Invest Euphoric Invest Everything Aggressively Defeated Sell Everything Confident Hopeful Maybe Things Are Turning Around (I’ll Wait And See) Nervous What’s Going On The Very Ease Of Moving Investments From One To The Other Carries With It The Risk Of Being Emotionally Whipsawed Into Selling At The Bottom And Buying At The Top
  • 16.
    Source: Ibbotson &Associates And Thomson Financial Investors Need To Overcome Short-Term Volatility To Obtain Long-Term Results! 1926 1930 1940 1950 1960 1970 1984 2006 Common Stocks Returns Twenty-Year Holding Periods 1926-2007 Risk Reduces Over Time
  • 17.
    Lack Of DiversificationAnd Asset Allocation 100 10 1 # of Stocks Risk Ratio Advantages Mutual Fund 1 2 4 10 50 100 6.6 3.8 2.4 1.6 1.1 1.0 Diversification # Of Stocks Risk Ratio
  • 18.
    Asset Allocation ThreeMajor Benefits To An Investor It Provides Management Discipline. It Emphasizes The Development Of An Asset Allocation Policy. When Followed Over Several Market Cycles, It May Deliver A Higher Return For The Risk Taken.
  • 19.
    Efficient Frontier Risk%– Standard Deviation Return – % Low Risk Low Return Medium Risk Medium Return High Risk High Return A Portfolio Above This Curve Is Impossible Optimal Portfolios Should Lie On This Curve Which Is The Efficient Frontier. Portfolio’s That Lie Below The Curve Are Not Efficient, Because For The Same Risk One Could Achieve A Greater Return.
  • 20.
    Asset Allocation WithoutRebalancing Without Periodic Rebalancing Your Asset Allocation Can Drift Substantially From Your Targets Peak Equity Exposures Occur At Peaks In the Equity Market, Increasing Your Risk Data is from December 1985 to December 1999. Fixed Income is represented by the Lehman Brothers Aggregate Index. Equities are represented by the S&P 500 Index. The Starting portfolio of 50% fixed income and 50% equities is not rebalanced for the entire period shown. 50% 50% 77% 23% Fixed Income Equities 1985 1999
  • 21.
    Data is fromJanuary 1981 – March 2005. Portfolios consist of 12% International Stocks (MSCI EAFE), 10% small-mid capitalization stocks (Russell 2500), 28% Large-cap stocks (SP500) and 50% (Lehman Brothers Aggregate), Rebalanced portfolio is rebalanced quarterly. Source: MPI Style, LFA Rebalancing Helps Reduce Risk 1981 - 2005
  • 22.
    Guarantees Help PeopleThink Differently about Risk If An Investment Product Offered: Guarantee Against Principal Loss, And/Or Guarantee Minimum Annual Return With Further Upside Potential… … How Would It Affect Your Investment Behaviors? 74% 72% 63% Stay In Stock Market Even If Short-Term Losses Choose More Aggressive Investments With Greater Potential For Returns Invest For Longer-Term Horizon Source: February, 2006 Retirement Red Zone Research Study Conducted by Prudential Financial. All guarantees are based on the claims-paying ability of the issuing insurance company.
  • 23.
    The Effect ofMarket Returns on Portfolio Balances Hypothetical Example * (5% Withdrawals Begin At Age 62) Source: February, 2006 Retirement Red Zone Research Study Conducted by Prudential Financial. * This example does not represent the performance of any particular investment. Early Market Decline Late Market Decline Annual Return Account Balance Annual Return Account Balance Starting account value $250,000 $250,000 Age 62 -17.6% $193,500 16.6% $279,000 Age 63 -12.8% $155,857 7.4% $286,771 Age 64 -3.5% $137,141 12.0% $307,922 Age 69 7.1% $108,440 11.3% $394,055 Age 70 16.9% $110,932 14.9% $416,444 Age 77 -3.2% $34,841 -3.2% $605,061 Age 79 14.9% $0 16.9% $690,067 Age 88 11.3% $0 7.1% $1,132,926 Age 89 12.0% $0 -3.5% $1,065,507 Age 90 7.4% $0 -12.8% $900,523 Age 91 16.6% $0 -17.6% $712,574 Average annual rate of return for 30-year period 7.0% 7.0%
  • 24.
    Money Concepts International.Inc. 11440 N. Jog Road Palm Beach Gardens, FL 33418 Tel:. 561.472.2000 www.moneyconcepts.com All Securities Through Money Concepts Capital Corp. Member FINRA/SIPC Money Concepts Advisory Service Is A Registered Investment Advisor With The SEC All Non Securities And Non Advisory Products Through Money Concepts International, Inc. Providers of Financial Services Since 1979

Editor's Notes

  • #3 Early planning lets us have some control over the ways change will affect our lives. This key to creating a satisfying retirement is not new and mysterious. It is a personal planning process that most of us have used before. For your transition to retirement, you will need to work out your plans in such areas as: Lifestyle Financial planning Legal affairs Retirement income Insurance needs The remainder of this session will help you assess your situation in each of these areas, identify sources of additional information, set goals for yourself, and begin to develop an action plan to help you plan for a happy and satisfying retirement.
  • #4 Self-Assessment Self-assessment is the first step for good personal planning. It is extremely important, and it is often overlooked. The focus is on you and your answers to questions such as: What do I need to make me feel happy and satisfied? What do I want my life to be like? What personal and financial resources do I have? These may seem like simple questions, yet it will take time and thoughtful work to figure out your answers. As you work, remember that you are looking for your personal answers. If you compare your answers to those of others, you are likely to find differences. These differences are what make this step so important as the first step in personal planning. Your plans for retirement can only lead to real satisfaction if they are individually tailored to your needs and desires. The results of your work on this self-assessment step provide you with a strong base for the personal goal setting and action planning that you will need to do as part of the planning process.
  • #5 “ Born in 1946, the first baby boomers are now in their 60’s and entering the homestretch toward retirement. Even the youngest of the generation, who are 40-something and decades away from retirement, are thinking about it. Why? Because medical advances and healthy lifestyles continue to drive the average live expectancy upward. And though today’s boomers, who number 75 million, have accumulated more wealth than previous generations, they still wonder; Have I saved enough?” (USAA Magazine – Spring 2006) Before you can answer that question, you need to ask yourself, “What do I want to do with the rest of my life?”
  • #8 “ Born in 1946, the first baby boomers are now in their 60’s and entering the homestretch toward retirement. Even the youngest of the generation, who are 40-something and decades away from retirement, are thinking about it. Why? Because medical advances and healthy lifestyles continue to drive the average live expectancy upward. And though today’s boomers, who number 75 million, have accumulated more wealth than previous generations, they still wonder; Have I saved enough?” (USAA Magazine – Spring 2006) Before you can answer that question, you need to ask yourself, “What do I want to do with the rest of my life?”
  • #9 Most people are very concerned about their prospect for financial independence. Over 70% believe they won’t have enough money at retirement. Of those between the ages of 30 and 54, almost 80% feel this way. One of the factors in their uncertainty is Social Security. In the mid-1970’s, two-thirds of those surveyed said they were confident that Social Security benefits would be there for them at retirement. In the 1980’s this was completely reversed. Two-thirds said they were not confident that Social Security would be there at retirement, and if it were, it would net be adequate to provide a reasonable standard of living. There does, however, seem to be agreement that being financially independent at retirement requires putting money aside while you’re working and earning income … even if it means making some short-term sacrifices along the way.
  • #19 It Provides Management Discipline Which Will Help The Investor Avoid Reacting To Short Term Market Swings, Emotions and Fads. It Emphasizes The Development of An Asset Allocation Policy – One of the Most Important Factors For Achieving Investment Returns. When Followed Over Several Market Cycles, It May Deliver A Higher Return For The Risk Taken.
  • #20 The Efficient Frontier Represents Those Combinations of Asset Classes That Provide The Highest Rate of Return For Any Given Level of Risk or In Other Words, The Lowest Risk Portfolio For Any Desired Rate of Return.