Formation of lunar surface water associated with high-energy electrons in Earth’s magnetotail

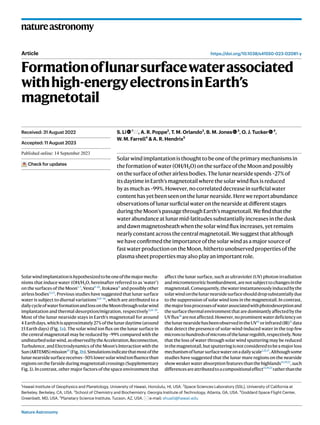
Solar wind implantation is thought to be one of the primary mechanisms in the formation of water (OH/H2O) on the surface of the Moon and possibly on the surface of other airless bodies. The lunar nearside spends ~27% of its daytime in Earth’s magnetotail where the solar wind flux is reduced by as much as ~99%. However, no correlated decrease in surficial water content has yet been seen on the lunar nearside. Here we report abundance observations of lunar surficial water on the nearside at different stages during the Moon’s passage through Earth’s magnetotail. We find that the water abundance at lunar mid-latitudes substantially increases in the dusk and dawn magnetosheath when the solar wind flux increases, yet remains nearly constant across the central magnetotail. We suggest that although we have confirmed the importance of the solar wind as a major source of fast water production on the Moon, hitherto unobserved properties of the plasma sheet properties may also play an important role.

Recommended
More Related Content
What's hot
What's hot (20)
Similar to Formation of lunar surface water associated with high-energy electrons in Earth’s magnetotail
Similar to Formation of lunar surface water associated with high-energy electrons in Earth’s magnetotail (20)
More from Sérgio Sacani
More from Sérgio Sacani (20)
Recently uploaded
Recently uploaded (20)
Formation of lunar surface water associated with high-energy electrons in Earth’s magnetotail
- 1. Nature Astronomy natureastronomy https://doi.org/10.1038/s41550-023-02081-y Article Formationoflunarsurfacewaterassociated withhigh-energyelectronsinEarth’s magnetotail S. Li 1 , A. R. Poppe2 , T. M. Orlando3 , B. M. Jones 3 , O. J. Tucker 4 , W. M. Farrell4 & A. R. Hendrix5 Solarwindimplantationisthoughttobeoneoftheprimarymechanismsin theformationofwater(OH/H2O)onthesurfaceoftheMoonandpossibly onthesurfaceofotherairlessbodies.Thelunarnearsidespends~27%of itsdaytimeinEarth’smagnetotailwherethesolarwindfluxisreduced byasmuchas~99%.However,nocorrelateddecreaseinsurficialwater contenthasyetbeenseenonthelunarnearside.Herewereportabundance observationsoflunarsurficialwateronthenearsideatdifferentstages duringtheMoon’spassagethroughEarth’smagnetotail.Wefindthatthe waterabundanceatlunarmid-latitudessubstantiallyincreasesinthedusk anddawnmagnetosheathwhenthesolarwindfluxincreases,yetremains nearlyconstantacrossthecentralmagnetotail.Wesuggestthatalthough wehaveconfirmedtheimportanceofthesolarwindasamajorsourceof fastwaterproductionontheMoon,hithertounobservedpropertiesofthe plasmasheetpropertiesmayalsoplayanimportantrole. Solarwindimplantationishypothesizedtobeoneofthemajormecha- nisms that induce water (OH/H2O, hereinafter referred to as ‘water’) on the surfaces of the Moon1–7 , Vesta8–10 , Itokawa11 and possibly other airless bodies12,13 . Previous studies have suggested that lunar surface water is subject to diurnal variations3,14–16 , which are attributed to a dailycycleofwaterformationandlossontheMoonthroughsolarwind implantation and thermal desorption/migration, respectively3,14–19 . Most of the lunar nearside stays in Earth’s magnetotail for around 4 Earthdays,whichisapproximately27%ofthelunardaytime(around 15 Earth days) (Fig. 1a). The solar wind ion flux on the lunar surface in the central magnetotail may be reduced by ~99% compared with the undisturbedsolarwind,asobservedbytheAcceleration,Reconnection, Turbulence, and Electrodynamics of the Moon’s Interaction with the Sun(ARTEMIS)mission20 (Fig.1b).Simulationsindicatethatmostofthe lunarnearsidesurfacereceives~50%lowersolarwindionfluencethan regions on the farside during magnetotail crossings (Supplementary Fig. 1). In contrast, other major factors of the space environment that affect the lunar surface, such as ultraviolet (UV) photon irradiation andmicrometeoriticbombardment,arenotsubjecttochangesinthe magnetotail.Consequently,thewaterinstantaneouslyinducedbythe solarwindonthelunarnearsidesurfaceshoulddropsubstantiallydue to the suppression of solar wind ions in the magnetotail. In contrast, themajorlossprocessesofwaterassociatedwithphotodesorptionand the surface thermal environment that are dominantly affected by the UVflux18 arenotaffected.However,noprominentwaterdeficiencyon thelunarnearsidehasbeenobservedintheUV16 orinfrared(IR)21 data that detect the presence of solar-wind-induced water in the top few micronstohundredsofmicronsofthelunarregolith,respectively.Note that the loss of water through solar wind sputtering may be reduced inthemagnetotail,butsputteringisnotconsideredtobeamajorloss mechanismoflunarsurfacewateronadailyscale1,12,17 .Althoughsome studies have suggested that the lunar mare regions on the nearside showweakerwaterabsorptionfeaturesthanthehighlands14,19,22 ,such differencesareattributedtoacompositionaleffect15,19,22 ratherthanthe Received: 31 August 2022 Accepted: 11 August 2023 Published online: xx xx xxxx Check for updates 1 Hawaii Institute of Geophysics and Planetology, University of Hawaii, Honolulu, HI, USA. 2 Space Sciences Laboratory (SSL), University of California at Berkeley, Berkeley, CA, USA. 3 School of Chemistry and Biochemistry, Georgia Institute of Technology, Atlanta, GA, USA. 4 Goddard Space Flight Center, Greenbelt, MD, USA. 5 Planetary Science Institute, Tucson, AZ, USA. e-mail: shuaili@hawaii.edu
- 2. Nature Astronomy Article https://doi.org/10.1038/s41550-023-02081-y Thediurnaltrendsforwatercontentsonthelunarfarside(notaffected by the magnetotail) were used to correct for the effects of local time on the water contents in regions that were shielded by the magneto- tail (Methods). Any remaining variations of the water contents in the nearside regions can be attributed to the effects of the magnetotail. We analysed M3 data that were acquired in six lunar phase periods for regionswithinandoutsidethemagnetotail(Methods). Results The Moon’s passage through Earth’s magnetotail provides a natural laboratoryforstudyingtheformationprocessesoflunarsurfacewater correlated with solar wind implantation. We found ten, two and no repeatM3 observationsofthesameregionsamongtwo,threeandmore thanthreelunarphases,respectively(MethodsandTable1).Although thereisalackofrepeatM3 observationsamongonecontinuouscycleof sixlunarphaseperiods,12repeatedobservationsamongtwoandthree ofthosesixlunarphases(Table1andSupplementaryFig.3)shouldbe sufficient to characterize the trends for water contents on the lunar surface during the passage of the magnetotail. The mapped water was binned into three latitude zones to reduce shadowing effects from rough topographies that exhibit dependence on the local time, defined as: 30° S to 30° N (low latitudes), 30° to 60° N and S (mid-latitudes) and 60° to 75° N and S (high latitudes) (Methods and SupplementaryFig.3).Polarregions(above75°)wereexcludeddueto strong shadowing effects. The water contents of 12 regions in low- and high-latitude zones exhibit a tight correlation with the local time (Supplementary Fig.3a,c).However,thewatercontentsinregionsinthemagnetosheath strongly deviate from those in regions in the undisturbed solar wind in the mid-latitude zone (Supplementary Fig. 3b). To further assess how the lunar surface water in the magnetosheath deviates from that in the undisturbed solar wind, we removed the early morning data (~8.30 a.m.)inSupplementaryFig.3b—noneofwhichwasacquiredin the magnetosheath—and show the remaining data in Fig. 2. To derive the diurnal trend of the magnetosheath, we used a quadratic poly- nomial to fit the five data points in the magnetosheath and two data points near the magnetosheath boundary (Supplementary Fig. 3b). The water contents of regions in the magnetosheath and those in the undisturbed solar wind fall into two distinct diurnal trends (Fig. 2a). Thediurnaltrendforwaterintheundisturbedsolarwindonthelunar magnetotail.Furthermore,thehighlandregionsareapproximatelytwo timesbrighterthanthemareregions23 ,andthewaterabsorptionofthe formerispredictedtobestrongerthanthelatteratthesamewatercon- tentduetothealbedodependenceofwaterabsorption24 .Thehighland and mare regions may have similar water contents, and the stronger water absorption of the highland regions reported in3,19,22,25 may be mostlybecausetheyhaveahigheralbedothanthemareregions.Itis, therefore,suggestedthattheremaybeadditionalformationprocesses ornewsourcesofwaternotdirectlyassociatedwiththeimplantation of solar wind protons in the magnetotail. For instance, water migra- tion16 and water sourced from the Earth wind26 have been proposed as possible new sources responsible for the similar hydration levels of regions within and outside the Earth’s magnetotail. Our analysis of water variations on the lunar nearside surface during the passage of Earth’smagnetotailindeedsuggeststhatwater-formationprocessesare alteredandmaybedifferentfromthosethoughttobedominantwhen theMoonisoutsidethemagnetotail.Theseprocessesmayhavebeen overlookedandarelikelytobeactiveonotherairlessbodiesincluding but not limited to Mercury. We analysed the water content of the same regions on the lunar nearsidemappedfromMoonMineralogyMapper(M3 )reflectancedata toassesshowitvariesduringthepassageoftheMoonthroughEarth’s magnetotail(Methods).Ourpreviousstudyshowedthatthelatitude, opticalmaturityandlocaltimearethreemajorfactorscontrollinglunar surfacewater15 .Assessingwatervariationsforthesameregionavoids complicationsfromthefirsttwoofthethreefactors.However,theeffect of the local time is overprinted on that of the lunar phase in the same region due to the synchronization between the rotational and orbital periodsoftheMoon.Thus,wecorrectedthewaterobservedinthesame regions at different lunar phases and local times to local noon. This correction also allowed us to correlate the variation of water with the solarwindionfluxtotheMoonthathadbeenmeasuredbytheARTEMIS mission. Our previously mapped water contents from the global lunar surface exhibit no dependence on composition (for example, mare versus highland)15 . It has been suggested that the pyroclastic depositsontheMoonretainwaterfromtheinterior27 ,whichmayskew thediurnaltrendsofsolar-wind-inducedwater,sotheseweremasked inourstudiedregions.Itis,thus,reasonabletoassumethatthewater variationswithinthemareandhighlandregionswouldfollowthesame diurnal trends, if they are not affected by the magnetotail (Methods). Sun Magnetotail lobe Magnetotail lobe Magnetosheath Magnetosheath Plasma sheet –90o 0o 180o 90o –90 –45 0 45 90 Lunar phase (°) 10 7 10 8 Solar wind ion flux (particles per cm 2 per s) Lobes/ plasma sheet a b Dawn Tail centre Dusk Solar wind Solar wind Not to scale Lunar orbit Fig.1|ConfigurationsofEarth’smagnetotailandaprofileofthesolar windionfluxmeasuredbytheARTEMISmission. a,Side-viewschematic diagramshowingtheconfigurationofthemagnetotail.TheMoonpasses throughthemagnetotailinthefollowingsequence:theduskmagnetosheath, themagnetotaillobesandplasmasheet,andfinally,thedawnmagnetosheath. b,Solarwindionfluxatdifferentlunarphases(−90°to90°)measuredby theARTEMISmissionatthesubsolarpointoftheMoon20 .Inbothpanels,the dark-reddashedlinesmarktheboundarybetweentheregularsolarwindand themagnetosheath.Thebluedashedlinesindicatetheboundarybetweenthe magnetosheathandthemagnetotaillobe.Thereddashedlineoutlinesthe plasmasheet(theredshadedregion).Thepositionoftheplasmasheetishighly variableinthemagnetotail,andthus,wegroupthemagnetotaillobesandthe plasmasheetasthe‘magnetotailcentre’.
- 3. Nature Astronomy Article https://doi.org/10.1038/s41550-023-02081-y nearside (Fig. 2a) is identical to that on the farside (Supplementary Fig.4),whichdemonstratesourassumptionthatthewatervariations within the nearside mare and farside highland regions follow the same diurnal trends as if they were not affected by the magnetotail (Methods).Thewatercontentinregionsinthemagnetosheathisnota- blyhigherthanthatinregionsintheundisturbedsolarwindatasimilar localtime(Fig.2a).Figure2bshowsaregionthatwasobservedinthree lunarphasesbyM3 .Thewatercontentinthisregionincludesdatathat were collected in the solar wind and in the magnetotail. These fall on the farside diurnal trend. The water content in the magnetosheath is much higher than would be predicted in the undisturbed solar wind despite the data in the magnetotail being collected closer to local noon (Fig. 2b). M3 observations also show that the water contents in regionsinthecentralmagnetotailwhenthesolarwindprotonsource wasshutoffexhibitnosuppressionincomparisontothoseinregions in the undisturbed solar wind at a similar local time (Supplementary Fig. 3). Altogether, this indicates that there are distinct formation or lossprocessesforwaterassociatedwiththemagnetotail. We averaged the water contents of the 12 different regions (Table 1 and 12 pairs of coloured symbols in Fig. 3) to assess the water variation during the Moon’s passage through the magnetotail. The diurnaltrendsforwatercontentsinthelunarfarside(Supplementary Fig. 4) were used to correct for the effect of local time on water in the nearside (Methods). The corrected data were then used to assess how the lunar surface water varies with the lunar phase at the same local time. The water content exhibits substantial variations in the mid-latitudezonebutvarieslittleatlowandhighlatitudes(Fig.3).Ifthe watercontentvariedbymorethan10,17or32 ppm(partspermillion) inthelow-,mid-andhigh-latitudezones,respectively,thevariationwas greater than our mapping uncertainties and, thus, could be detected by M3 (Methods). Note that the error bars in Fig. 3 represent the heterogeneityofwatercontentsineachbinnedzoneandarenotobser- vationuncertainties(Methods).Duetotheheterogeneityofthewater contentsinthose12regions(SupplementaryFig.3),wecouldnotuse rigorousstatisticstoassesswhetherthewatervariationwassignificant (Methods). Thus, the size of the water variations is only a first-order estimation of the magnetotail effects with unknown uncertainties. Surprisingly, the water content in the low- and mid-latitude zones exhibited almost no variations across the central magnetotail (Fig. 3, from lunar phases −33° to 25°), which apparently deviates from the significant decrease (~80%–99%) of the solar wind ion flux (Fig. 1b). The water content did not exhibit substantial changes for around 1–2 Earth days after the Moon exited the magnetotail (lunar phases: ~50°–75°) (Fig. 3). The minimum water content in the low-latitude zone was near the boundary between the magnetotail lobe and the dawn magnetosheath (Fig. 3, the lunar phase near 20°), whereas in comparison, the water content in the mid-latitude zone reached the lowestpointneartheboundarybetweentheduskmagnetosheathand themagnetotaillobe(Fig.3,thelunarphasenear−20°),notwithstand- ingtheinitiallylowlevelofwaterwhilethesurfacewasinthesolarwind beforetransitingthemagnetotail.Thewatercontentinthelow-latitude zone was mostly around 40 ppm, and there were strong deviations in those 12 regions (Fig. 3). The water content in the high-latitude zone remainedstableataround140 ± 7(2σ) ppm(Fig.3)duringtheMoon’s passagethroughthemagnetotail,whichisconsistentwithourprevious findingthatthelunarsurfacewaterexhibitssmallvariationsatlatitudes higherthanaround60°(ref.15). A major source of uncertainty in our assessments of water varia- tions on the lunar surface could be from the correction of local-time effects. Nevertheless, we found that these uncertainties are insuffi- cientlylargetoskewthetrendsforlunarsurfacewater.M3 observations Table 1 | Summary of repeat observations of the surface water at the same regions made by M3 and acquired at different lunar phasesa Dusk (K) First half tail (F) Second half tail (S) Dawn (N) 1–2days after (A) 1–2days before (B) BK BF BS BKF Dusk (K) KF KS First half of the tail (F) FS FN FNA Second half of the tail (S) SN SA Dawn (N) NA a The letter combinations in the table represent two or three lunar phases during which M3 observed the same region. For instance, BK represents two repeat M3 observations of the same region for the 1–2Earth days before the Moon entered the magnetotail (B) and for when it was in the dusk magnetosheath (K). FNA represents three repeat observations of the same region for when the Moon was in the first half of the magnetotail (F), for when it was in the dawn magnetosheath (N) and for the 1–2Earth days after it exited the magnetotail (A). Local time (hour) 50 100 150 200 Water content (ppm) a 30° – 60° N and S Areal extent: 10 6 km 2 Areal extent: 10 5 km 2 Areal extent: 10 4 km 2 In solar wind I n m a g n e t o s h e a t h Farside diurnal trend 8 10 12 14 8 10 12 14 Local time (hour) 80 90 100 110 120 130 140 150 Water content (ppm) Farside diurnal trend In solar wind (Lunar phase: –74°) In magnetosheath (Lunar phase: –40°) In magnetotail (Lunar phase: –22°) b Fig.2|Thediurnaltrendforwatercontentsinregionsinthemagnetosheath stronglydeviatesfromthatinregionsintheundisturbedsolarwindbefore thelocal-timecorrectioninthemid-latitudezone. a,Watercontentsof regionsinthemagnetosheath(outlinedwithabluedashedline)andregions intheundisturbedsolarwind(outlinedwithablackdashedline)onthelunar nearside.Thesizeofeachsymbolrepresentsthearealextentofthatregion. b,Variationofwatercontentsinthesameregion(centrednear35° E),whichwas observedinthreelunarphasesbyM3 .Thedatapointsarethesamegreencircles asina.Thegreendashedcircle(indicatedbythegreyarrow)markswhatthe watercontentinthisregionwouldhavebeenifithadfollowedthesamediurnal trendasthatonthelunarfarside.Symbolsinthesamecolourarefromthesame regions.Errorbarsindicate1σ frombinningM3 data.
- 4. Nature Astronomy Article https://doi.org/10.1038/s41550-023-02081-y in several regions clearly show that diurnal trends in water contents between observations in only the solar wind versus in the central magnetotail versus in the magnetosheath deviate from each other (Fig. 2 and Supplementary Fig. 3b). Additionally, similar corrections were performed on the M3 data for the low-, mid- and high-latitude zones. However, the trends for water contents after the corrections aredifferentforthosethreelatitudezones(Fig.3).Thestrongestvari- ationofwaterinthehigh-latitudezoneaftercorrectionisonlyaround 7 ppm(Fig.3),whichisfarlessthanthemappinguncertaintyof32 ppm (Methods). In comparison, the strongest variations in water content with lunar phase at low- and mid-latitudes are around 15 and 27 ppm, respectively(Fig.3),whichishigherthantherespectiveuncertainties of 10 and 17 ppm (Methods). It is reasonable to believe that the varia- tions of water in the low- and mid-latitude zones during the passage of the magnetotail are real and not due to the local-time corrections. Otherwise,asimilarpatternofwatervariationsshouldalsobeobserved inthehigh-latitudezone. Theincreaseofthewatercontentsobservedatmid-latitudesinthe duskanddawnmagnetosheathrelativetothewatercontentsobserved in the undisturbed solar wind directly supports the idea that solar wind implantation is a major contributor to the lunar surface water, asrevealedbyIRmeasurements.Italsoindicatesthattheformationof water through solar wind implantation is a fast process, as suggested in previous studies3,15 . The water contents in the mid-latitude zone increased by over 20 ppm during the passage of the dusk and dawn magnetosheath(Fig.3).Suchincreasesofwatercontentscorrespond promptlywiththeincreasesofthesolarwindionfluxbyaround50%in theduskanddawnmagnetosheathincomparisontotheundisturbed solar wind (Fig. 1b). Other known sources, such as meteoritic impact delivery, interior degassing and terrestrial ionospheric outflow (also knownastheEarthwind)26,28 ,areunlikelytobeabletoaccountforthe increasesinwatercontentsintheduskanddawnmagnetosheathovera timescaleof~2 Earthdays.Thelow-latitudezonegainedlesswaterthan themid-latitudezone(<15 ppmversus>20 ppm)intheduskanddawn magnetosheath,whichcouldbeduetothemuchhighertemperatures and,thus,moreefficientlossofwaterinthelow-latituderegions. Thelowestwatercontentsinthelow-andmid-latitudezoneswere not observed at the time of the lowest solar wind flux when the Moon was near zero lunar phase (Fig. 3). The water contents in the low- and mid-latitude zones near the zero lunar phase are almost the same as those at other lunar phases when the solar wind flux is much higher (forexample,theduskmagnetosheath;Fig.3).Thisimpliesthatsome typeofreplenishmentmaypreventorcounterbalancethedecreaseof thewatercontentsthatwouldotherwisebecorrelatedwithaminimum incident ion flux (Fig. 1b). This could be different from the source of waterinducedbytypicalsolarwindimplantation. Observations by the electron reflectometer onboard the Lunar Prospector mission suggest that the Moon spends around 44% of the duration of the magnetotail crossing in the plasma sheet29 , which is generallyalongtheeclipticplane30 .ARTEMISmeasurementsdemon- stratethattheionsandelectronsintheplasmasheetaremuchhotter and extend to higher energies than those in the solar wind (Fig. 4). Laboratory experiments of proton irradiation onto SiO2 suggest that theOHformationyieldisindependentofirradiationenergiesfrom2to 10 keVbeforetheprotonfluencereachessaturationat~3 ⨉ 1016 H+ cm−2 (ref. 31). In comparison, the daytime fluence of the solar wind ions is around1014 H+ cm−2 and1.5 ⨉ 1014 H+ cm−2 withinandoutsidethewhole magnetotail (Supplementary Fig. 1), respectively, which is well below the saturation level. The higher-energy protons from both the solar windandtheplasmasheetaregenerallyimplanteddeeperintoregolith grain rims and, thus, may sustain longer lifetimes32 , which may pre- ventthesignificantlossofthelunarsurfacewaterinthemagnetotail. –50 0 50 Lunar phase (°) 10 30 50 70 40 60 80 100 120 100 150 200 Corrected water content (ppm) Dusk Tail centre Dawn 30°–60° N and S 30° N–30° S Areal extent: 106 km2 Areal extent: 105 km2 Areal extent: 104 km2 60°–75° N and S Fig.3|Repeatobservationsofwatercontentsinthesameregionsfor differentlunarphases.Symbolsinthesamecolourarefromthesameregionin eachlatitudezone.Squares:60°–75°inthenorthernandsouthernhemispheres. Circles:30°–60°inthenorthernandsouthernhemispheres.Diamonds:30° S to30° N.Thesizeofeachsymbolrepresentsthearealextentoftherepeated observationsineachlatitudezone.Theverticaldashedlinesinredandblack marktheboundariesamongeachsectionofthemagnetotail(Fig.1).Theblack dottedlinesineachlatitudezonearedoublysmoothedwatercontentsto illustratethetrend.Thegreybarsontherightsideofeachsubplotrepresent thetotaluncertaintiesfrommappingandlocal-timecorrections(Methods). Theerrorbars(1σ)paralleltotheyaxisforeachsymbolareduetobinningof theheterogeneouswatercontentsinthestudyregions,andtheyshouldbenot comparedwiththegreybars(seetextformoredetails). Solar wind Magnetosheath Magnetotail lobe Plasma sheet 10 10 10 8 10 6 10 2 10 4 10 0 1 10 100 Energy (eV) 1,000 10,000 Differential flux (s −1 cm −2 sr −1 eV −1 ) Fig.4|Typicalionandelectrondifferentialnumberfluxesforthesolarwind, magnetosheath,plasmasheetandmagnetotaillobesasobservedbythe ARTEMISmission.Solidlinesareforelectronsanddashedlinesareforions. ARTEMISdataforeachdistributionarefromthesolarwind:7November2020, 18.10to18.40;magnetosheath:26December2020,03.20to03.30;plasmasheet: 30December2020,08.40to09.00andmagnetotaillobe:29December2020, 16.00to16.20.
- 5. Nature Astronomy Article https://doi.org/10.1038/s41550-023-02081-y However, these high-energy ion fluxes within the plasma sheet are typically around 1%–5% of that in the solar wind (Fig. 4). Thus, the ion flux in the plasma sheet seems too low to account for the observed lack of water suppression in the central magnetotail, and thus, there may be other mechanisms of water formation or retention, which we considerhere. We explored a possible mechanism in which the observed water variations across the magnetotail were due to the diffusion of implantedsolarwindhydrogen33 .ResultsfromMonteCarlosimulations inref.33predictedtheincreasesofwatercontentsintheduskanddawn magnetosheaththatisobservedintheM3 data(Figs.2and3),whichis attributedtothe~50%increaseofthesolarwindionfluxinthemagne- tosheath.Thesteady-statewatercontentacrossthecentralmagnetotail (Fig.3)canbeexplainedbylongerretentionlifetimeswithinlunarrego- lithgrainsofhigher-bonding-energyhydrogen,evenduringthemaxi- mumsurfacetemperaturesexperiencednearlocalnoon.Somestrong variationsofthesurfacewaterinthecentralmagnetotailareobserved inthelow-andmid-latitudezones.Wethinkthatthesevariationscould beduetothehighlyvariableplasmaenvironmentassociatedwiththe plasma sheet (Fig. 1). Note that more than 50% of the M3 observations inthecentralmagnetotailwerenearlocalnoon(SupplementaryFig.3). The implanted solar wind hydrogen, which has lower bonding ener- gies, has shorter lifetimes32,33 and may diffuse out before local noon. Consequently, the retained high-bonding-energy hydrogen is stable inthelunarregolithsothatnosubstantialwatervariationisobserved across the central magnetotail. However, M3 observations during the local morning (~8.30 a.m.) did not exhibit notable decreases of the watercontentswhenthesolarwindionsourcewasshutoffinthecentral magnetotailcomparedtointheundisturbedsolarwind(Supplemen- taryFig.3andFig.2).Thelowerwatercontentsintheundisturbedsolar windobservedlaterinthemorning(~9.30 a.m.,SupplementaryFig.3 and Fig. 2) could be due to thermal losses as the surface temperature rises.Theindiscernibledifferencesinwatercontentsintheearlymorn- ing,bothwithinandoutsidethecentralmagnetotailinthemid-latitude zone,maybeexplainedbythelowtemperatures(~300 Kat~8.30 a.m.at latitude45°;ref.34),andthus,mostofthewaterisretainedduetothe slow diffusion processes at such low temperatures32 (Supplementary Fig.3b).However,multipleM3 observationsinthecentralmagnetotail across the morning in the low-latitude zone (for example, ~8.30 a.m., ~10.00 a.m. and ~11.30 a.m.; Supplementary Fig. 3c) exhibit no sup- pression compared with those outside the central magnetotail at a similarlocaltime.Thediffusionlossofwaterneartheequatorisquite significantaround10.00 a.m.and11.30 a.m.32 ,whichimpliesthatthere are additional formation processes for lunar surface water that are different from but otherwise equivalent to the implantation of solar windprotonsoutsidethemagnetotail. Note that the electron energies in the plasma sheet are much higher than those in the solar wind or magnetosheath (Fig. 4). The electron energies in the solar wind are mostly less than a few tens of electronvolts,whereasthoseintheplasmasheetcanreachover10 keV (Fig.4).Thenumberfluxesofelectronsabove20 eVintheplasmasheet andintheundisturbedsolarwindaresimilarat~1011 cm−2 s−1 (Fig.4;note that all flux curves were normalized by their energies). Irradiation of thelunarsurfacebyhigh-energyelectronswillproducedefectsinthe form of non-bonding oxygen centres35,36 in regolith grains, allowing any trapped atomic H, either directly from the solar wind or from the dissociationoftrappedmolecularH2,toreactwiththedefect,resulting intheformationof–OHorH2O.Previousexperimentsalsosuggestthat the secondary electrons produced by high-energy electrons can be trappedingrainrims37–40 .Incontrast,secondaryelectronsgeneratedby low-energyelectrons(<~100 eV),suchasthoseintheundisturbedsolar wind, can efficiently leave the regolith grain surface due to their low energies. The trapped high-energy electrons as well as their induced secondary electrons can lead to a negative potential, which has been documentedasaffectingthemobilityofimplantedprotons41 thereby allowing for the greater retention of implanted hydrogen in the form of–OH/H2O.High-energyelectronsintheplasmasheetandsolarener- geticparticlesmayalsoenterthepermanentlyshadedregions42,43 and contribute to the formation of the observed water ice44 . However, it is unclear whether these processes are sufficient to account for the observed formation of water in the central magnetotail and water ice depositsinpermanentlyshadedregions. TheaboveassessmentisbasedonirradiationexperimentsonSiO2 and olivine with proton energies of 2–10 keV. The lunar regolith may haveadistinctyieldofhydroxylgroupsandpossiblyH2Oundersimilar irradiation conditions45 . In addition, most solar wind ions are within 0.5–2 keVandionsintheplasmasheetarebroadlydistributedinenergy from0.2to>25 keV(Fig.4).Futureirradiationexperimentsusinglunar samplesandtherelevantionandelectronenergycharacteristicsofthe solarwindandplasmasheetarewarrantedtoreassesswhethertheions andelectronsintheplasmasheetcanaccountfortheobservedwater formationinthecentralmagnetotail.Theseexperimentsarealsocriti- calforunderstandingtheprocessesofwaterformationassociatedwith solarenergeticparticlesthatmayoperatesimilarlyonallairlessbodies suchastheMoon,Vesta,Mercuryandnear-Earthobjects. It is surprising to observe that the water content near zero lunar phasedidnotdecreasewhentheionfluxwasthelowest.Duringcross- ingsofthecentralmagnetotail,theMoonmayperiodicallyencounter the plasma sheet, and we hypothesize that there may be additional water-formation processes associated with the plasma sheet, par- ticularly the high-energy electrons in it. Simultaneous observations oflunarsurfacewaterandambientplasmafluxes,includingbothions andelectrons,tothelunarsurfaceduringtheMoon’spassagethrough themagnetotailbyfutureorbitalandsurface-basedmissionswillhelp to constrain how the lunar surface water content varies with ion and electron fluxes. Additionally, future irradiation experiments using protons and electrons with energies like those in the plasma sheet may be necessary to reveal the detailed processes of water formation thatoperateintheplasmasheetorareduetosolarenergeticparticles. Methods Mapping lunar surface water using M3 data The M3 onboard India’s Chandrayaan-1 mission measured the hyper- spectral reflectance at the lunar surface from 0.43 to 3.0 μm (ref. 46). AbsorptionbythefundamentalstretchingofOHandbytheovertoneof H2Obendingbothoccurnear3 μm,andthisabsorptioncanbedetected inM3 data.UsingthisM3 dataset,weattemptedtoassessthevariation ofthewatercontentsonthesurfacewhentheMoonwaseitherwithin or outside the magnetotail. It is very challenging to discriminate OH fromH2Obasedontheiroverlappingabsorptionsignalsnear3 μm,so theyaregroupedtogetheras‘water’15 .M3 dataweregroupedintofive optical periods (OPs; OP1A, OP1B, OP2A, OP2B and OP2C) according to the mission status when the data were acquired46 . M3 data for the former four OPs have a spatial resolution of 140 m per pixel and were acquired during the 100 km orbit. OP2C data have the best cover- age of the lunar surface, yet their spatial resolution is downgraded to ~280 mperpixelduetotheascentofthemissionaltitudetothe200 km orbit46 .StudiessuggestthattheM3 reflectancedatareleasedinnodes of NASA’s Planetary Data System were under-corrected for thermal contamination14,47,48 .Thedaytimetemperaturesofthelunarsurfacein theequatorialregionscanreachover400 Kandthethermalemission atsuchhightemperaturescansignificantlyreduceandevenmaskany absorptionbetweenaround2and3 μminM3 data49 .Wedevelopedan empiricalmodelbasedonthespectralfeaturesoftheApolloandLuna samples48 and applied it to update the thermal correction of M3 data. Our modelled lunar surface temperatures were validated with the bolometrictemperaturesderivedfromthedataacquiredbytheDiviner radiometer onboard the Lunar Reconnaissance Orbiter50 . Our model was further validated using the reflectance data returned by China’s Chang'e 4 rover51 and Chang'e 5 lander52 . M3 radiance (RDN, level 1b),
- 6. Nature Astronomy Article https://doi.org/10.1038/s41550-023-02081-y observation (OBS) and location (LOC) files were downloaded from the NASA Planetary Data System (https://pds-imaging.jpl.nasa.gov/ volumes/m3.html).WeprocessedallM3 imagesinthefiveOPsusingthe calibrationpipelinedefinedinref.48.Wecalculatedthelunarphaseof eachM3 imagecubeusingSPICEkernelsprovidedbytheJetPropulsion LaboratoryinconjunctionwiththeM3 dataacquisitiontime. In our previous study, we mapped the absolute water content of each M3 image cube of the global lunar surface from the absorption strengthnear3 μm15 .Ourpreviouslaboratoryexperimentsusingterres trialanaloguesandsynthesizedlunarsamplesshowedthattheabsolute watercontentslinearlycorrelatewiththeabsorptionstrengthsofour samplesnear3 μm15 .Wethencharacterizedtheabsorptionstrengths near3 μminM3 datausingtheHapkeeffectivesingle-particleabsorp- tion thickness (ESPAT)15,53 and mapped the water contents15 . Our pre- vious study suggests that the lunar surface water content primarily depends on the latitude, optical maturity and local time15 . Although it is suggested that there possibly exist subtle differences among M3 dataacquiredunderdifferentoperationalconditions,suchasoptical periods and detector temperatures54 , our mapped water abundance across the global lunar surface exhibits no apparent dependence on theOPofM3 data15,55 .Thus,weusedM3 datainallOPstoobtainthebest coverage in this study. The mapping uncertainty was estimated to be 20%ofmappedwaterfromourlaboratoryexperiments15 . Theboundarybetweentheregionwithinthemagnetotailandthat outsideitwasempiricallydeterminedfromthesolarwindionfluxpro- filemeasuredbytheARTEMISmission20 (Fig.1b).Themajorsubregions ofEarth’smagnetotailincludetheduskmagnetosheath,magnetotail lobes, plasma sheet and dawn magnetosheath. The dawn and dusk magnetosheathsareformedbytheshockedsolarwindplasma,which isdivertedaroundtheobstacleofEarth’sgeomagneticfield.Withinthe magnetopause, the plasma sheet serves as a boundary layer between the two magnetotail lobes. However, the boundaries between the plasmasheetandthemagnetotaillobesarehighlyvariabledepending ontheseason,upstreamsolarwindandinterplanetarymagneticfield conditions56 .Weempiricallydeterminedtheboundariesbetweenthe solarwind,theduskmagnetosheath,themagnetotailcentre(consist- ing of the magnetotail lobes and plasma sheet together), the dawn magnetosheath and the solar wind at lunar phases of −63°, −33°, 25° and50°,respectively(Fig.1b).WethenusedM3 datainsixlunarphase periodstoinvestigatehowthewatercontentvariesduringtheMoon’s passage through the magnetotail. There are six lunar phase periods. The first spans the 1–2 Earth days that the Moon is in the solar wind beforeenteringthemagnetotail(lunarphases:−88°to−63°).Thenext four are when the Moon is in the dusk magnetosheath (lunar phases: −63° to −33°), in the first half of the magnetotail (lunar phases: −33° to 0°), in the second half of the magnetotail (lunar phases: 0° to 25°) and in the dawn magnetosheath (lunar phases: 25° to 50°). The sixth lunar phase period spans the 1–2 Earth days when the Moon is again in the solar wind after exiting the magnetotail (lunar phases: 50° to 75°)(Fig.1b).Wesplitthemagnetotailcentreintothefirstandsecond halvestounderstandhowthelunarsurfacewatercontentvarieswithin thecentralmagnetotail.Eachlunarphaseperiodroughlycovers25°. ThelunarphaseperiodforanM3 imagecubewaspickedbasedon the lunar phase when the data were acquired. There are 92, 72, 75, 49, 56 and 72 M3 image cubes that were acquired for the six lunar phase periods:the1–2 EarthdaysbeforetheMoonenteredthemagnetotail, whenitwasintheduskmagnetosheath,whenitwasinthefirsthalfof themagnetotailcentre,whenitwasinthesecondhalfofthemagneto- tail centre, when it was in the dawn magnetosheath and the 1–2 Earth daysafteritexitedthemagnetotail.ThenamesofthoseM3 imagecubes arelistedinSupplementaryTable1. The water content of each M3 image cube was derived from band 83 (2.85 μm) using the method in ref. 15. We found that the absorp- tion centres of water in our analogue and synthesized lunar samples were consistently near 2.85 μm, that is band 83 in the M3 data15 . We used the maximum reflectance between 2.5 and 2.7 μm in the M3 data (band73–78)tocastaflatlinecontinuum,whichwaslimitedbytheM3 spectral range, as that covers only half of the water absorptions from around2.6to4 μm(ref.15).WeconvertedM3 reflectancedataforbands 73–78 and 83 into single-scattering albedo using Hapke’s model15,53 . The continuum was then removed for the single-scattering albedo in band 83. The ESPAT parameter at 2.85 μm was then calculated15 . The water content was finally derived using this empirical relationship: H2O (ppm) = 5,000 ⨉ ESPAT2.85 μm (ref. 15). We mosaiced the mapped waterfromM3 imagecubesineachlunarphaseperiodusingthesimple cylindricalmethodataresolutionof280 mperpixel(Supplementary Figs. 5–10). M3 pixels with the minimum phase angles were used for the overlapping observations in the mosaicking, which like what we didinourpreviouswork2,15 .Therespectivelocaltime(Supplementary Figs. 11–16) and lunar phases (Supplementary Figs. 17–22) were also mosaicedinthesameway. Weusedquadraticpolynomialsempiricallyderivedforthelunar farsideinthelow-,mid-andhigh-latitudezones(SupplementaryFig.4) tocorrectthelocal-timeeffectsofourmappedwateronthenearside, as the water contents may have been affected by the magnetotail. We foundthatthelocaltimeofM3 datainourstudiedregionswasmostly around8 a.m.,10 a.m.,12 p.m.and2 p.m.(SupplementaryFigs.11–16). M3 image cubes acquired at similar local times on the lunar farside were chosen and mosaiced in the same way as those in the magneto- tail. We then searched repeat M3 observations of the same region to empirically determine the diurnal trend of the water contents on the lunar farside (Supplementary Fig. 4). The two major water reservoirs on the lunar surface are solar-wind-induced water in regolith grain rims11,57–59 andwatertrappedinagglutinates7 andvolcanicglasses60–62 . Solar-wind-induced water in the space-weathered rims of the lunar regolithmainlycontributestotheobserveddiurnalvariations,whereas water trapped in agglutinates and glasses provides a background that may be less affected by the lunar surface thermal environment and mostly stable across the daytime. Irradiation experiments using protonsshowthattheyieldofwaterisindependentofthecomposition of the host grains31 . Thus, it is reasonable to assume that the diurnal trends for solar-wind-induced water in regolith grains are similar on the lunar nearside and on the farside, whereas the diurnal trends for background water trapped in impact and volcanic glasses can differ duetothedistincthistoriesofimpactgardeningandvolcanicactivities (forexample,lavaflows).Regionalpyroclasticdepositsweremasked. Thecorrectionwasperformedintwosteps.Thedifferenceintheback- groundwatercontentindifferentregionsisreflectedintheintercepts oftheempiricalquadraticpolynomialswiththeyaxis(Supplementary Fig.4).ForeachM3 pixel,wefirstcalculatedthenewinterceptforeach latitudezone(b1,b2 andb3)ofthequadraticpolynomialforthediurnal trendofourstudiedregions: b1 = w − 3.9 × LT 2 + 95.2 × LT , if a pixel is between 30° S and 30° N b2 = w − 6.4 × LT 2 + 155.8 × LT , if a pixel is within 30° S to 60° S or 30° N to 60° Nb3 = w − 5.2 × LT 2 + 124.2 × LT , if a pixel is within 60° S to 75° S or 60° N to 75° N, where w is our mapped water contentofeachM3 pixelandLTisthelocaltimeofthatM3 pixel. We then corrected the water content of each M3 pixel to the local noon (12 p.m., wnew): wnew = 3.9 × 12 2 − 95.2 × 12 + b1 , if a pixel is between 30° S and 30° N;wnew = 6.4 × 12 2 − 155.8 × 12 + b2, if a pixel is within30° Sto60° Sor30° Nto60° N wnew = 5.2 × 12 2 − 124.2 × 12 + b3, ifapixeliswithin60° Sto75° Sor60° Nto75° N Wesearchedforregionsthathadrepeatobservationsacrossmore thanonelunarphase.Thereare15,20,15,6and1region(s)withrepeat observationsacrosstwo,three,four,fiveandsixlunarphaseperiods, respectively.Toensurethatourresultswerestatisticallysignificant,we usedonlyrepeatobservationscoveringatleast0.5longitudedegrees. Inourfinalresults,thereweretenobservationsthathadrepeatcover- age of a single region over two lunar phases, two observations that hadrepeatcoverageofasingleregionoverthreelunarphases,andno
- 7. Nature Astronomy Article https://doi.org/10.1038/s41550-023-02081-y observationsofanyregionsthathadrepeatcoverageoverfour,fiveor sixlunarphases(Table1).TherepeatM3 observationsinaregionafter the local-time correction were binned into three latitude zones and plotted in Fig. 3. To better illustrate the trend for the water contents, weusedthemovingaveragealgorithmtosmoothourdata.Wedoubly smoothed (smoothed twice) the mean water contents to reduce the effect of spiky data points for the three latitude zones in Fig. 3 using a moving average window of 25°. A trend line was derived for each latitude zone (the black dashed lines in Fig. 3). The binned M3 data withoutanycorrectionareshowninSupplementaryFig.3. Two main sources of uncertainty are considered in this study. Oneisthemappinguncertainty,whichwasestimatedtobe20%ofthe mappedwatercontent15 .Theotherisfromtheresidualofthelocal-time correction. We used the root mean squared errors of the quadratic polynomial fits of the diurnal trends (Supplementary Fig. 4) as the uncertainties of the local-time correction. The root mean squared errors for the low-, mid- and high-latitude zones are 3, 1 and 3 ppm, respectively. We used the mean water contents of the low-, mid- and high-latitudezonestoestimateourmappinguncertainties.Themap- pinguncertaintiesare7 ppm(37 ppm ⨉ 20%),16 ppm(79 ppm ⨉ 20%) and29 ppm(143 ppm ⨉ 20%)forthelow-,mid-andhigh-latitudezones, respectively.So,thetotaluncertaintiesinourmappedwatercontents afterthelocal-timecorrectionare10,17and32 ppmforthelow-,mid- andhigh-latitudezones,respectively. Interpretingtheerrorbarsinthebinnedwatercontentdata The error bars in the binned water data (Figs. 2 and 3 and Supplemen- taryFigs.3and4)representtheheterogeneityofthewatercontentsin each binned zone, which is due to the dependence of the water distri- bution on the latitude, optical maturity and local time15 . They are not observationuncertainties.Itismeaninglesstocomparetheerrorbars andwaterheterogeneitywiththemappinguncertainties.Weillustrate thedifferencebetweenthetwoparametersinSupplementaryFig.23. Thefigureshowsthatthedifferenceinthewatercontentbetweenlunar phasesAandBexceedstheassumedmappinguncertaintyof10 ppmin allpixelsinthisbinnedlatitudezone,whichmeansthattheincreasein watercontentcanbedetectedbytheinstrumentinallpixels.Themeans and standard deviations of the water contents for the same region in lunarphasesAandBare:32 ± 14 ppmand44 ± 14 ppm,respectively.In thisstudy,wecomparedthemeanvaluesforlunarphasesAandBand foundthattheincreaseofthewatercontentis12 ppm,whichisgreater than the mapping uncertainty of 10 ppm and, thus, can be detected. There is no reason to compare the standard deviations of the water contents in each lunar phase with the mapping uncertainty due to thedistinctphysicalmeaningsthatthesetwoparametersrepresent. Whycalculatingstatisticsforthebinnedwatercontentisnot appropriate Weaveragedthebinnedwatercontentineachlunarphaseperiod(Fig.3) toassessthevariationinthewatercontentduringtheMoon’spassage throughthemagnetotail.However,thereisalackofM3 coverageforthe entirecycleofsixlunarphaseperiods.Wefoundonlytenandtworepeat observations among two and three of those six lunar phase periods, respectively(Table1).Thus,weaveragedthewatercontentsfromdif- ferentregionswhenassessinghowthewatervariesfromonetoanother lunarphase.Thewatercontentofoneregioncanbeverydifferentfrom anotherduetovariationsinthesurfaceopticalmaturity15 (forexample, foralarge,young,impactregionversusatypical,mature,mareregion), althoughthetworegionscouldbeinthesamelatitudezoneandwere correctedforthelocal-timeeffect.Forinstance,assumethatthereare four regions (1, 2, 3 and 4) in lunar phase A and that their mean water contentsare35,38,41and37 ppm,respectively.However,inlunarphase B,onlyregions1,2and3arethesameasthoseinlunarphaseAandtheir watercontentsare48,49and52.AnewregioninlunarphaseBisfrom a giant, young impact (for example, Tycho) and the water content in this region is only 24 ppm. We can see that the increase of the water content in all regions 1–3 exceeds our assumed mapping uncertainty of10 ppm.Themeansandstandarddeviationsofthewatercontentsin lunarphasesAandBare30 ± 3 ppmand43 ± 13 ppm,respectively.The increaseofthemeanwatercontentis13 ppm,whichisgreaterthanthe mappinguncertainty.However,thestandarddeviationforlunarphase Bisgreaterthanthemappinguncertainty,whichisstronglyskewedby theheterogeneityofthewatercontentinthenewregion,whichhasno repeat observations. This simplified case explains why we could not rigorously calculate statistics for the binned water contents of those 12regionsinFig.3and,thus,assesswhetherthevariationofthewater content from one lunar phase to another is significant. However, any variation of the water content greater than the mapping uncertainty canbedetectedbytheM3 instrument. Dataavailability The Moon Mineralogy Mapper L1B data are available at https:// pds-imaging.jpl.nasa.gov/volumes/m3.html.Thederivedwatermaps and their associated local time and lunar phases are archived to the NASAPlanetaryDataSystemCartographyandImagingSciencesnode athttps://doi.org/10.17189/gmce-w279. References 1. Watson, K., Murray, B. C. & Brown, H. The behavior of volatiles on the lunar surface. J. Geophys. Res. 66, 3033–3045 (1961). 2. Li, S. & Garrick-Bethell, I. Surface water at lunar magnetic anomalies. Geophys. Res. Lett. 46, 14318–14327 (2019). 3. Sunshine, J. M. et al. Temporal and spatial variability of lunar hydration as observed by the Deep Impact spacecraft. Science 326, 565–568 (2009). 4. Pieters, C. M. et al. Character and spatial distribution of OH/H2O on the surface of the Moon seen by M3 on Chandrayaan-1. Science 326, 568–572 (2009). 5. Clark, R. N. Detection of adsorbed water and hydroxyl on the Moon. Science 326, 562–564 (2009). 6. Greer, J. et al. Atom probe tomography of space-weathered lunar ilmenite grain surfaces. Meteorit. Planet. Sci. 55, 426–440 (2020). 7. Liu, Y. et al. Direct measurement of hydroxyl in the lunar regolith and the origin of lunar surface water. Nat. Geosci. 5, 779–782 (2012). 8. De Sanctis, M. C. et al. Detection of widespread hydrated materials on Vesta by the VIR imaging spectrometer on board the Dawn mission. Astrophys. J. Lett. 758, L36 (2012). 9. Rivkin, A., McFadden, L., Binzel, R. & Sykes, M. Rotationally- resolved spectroscopy of Vesta I: 2–4μm region. Icarus 180, 464–472 (2006). 10. Hasegawa, S. et al. Evidence of hydrated and/or hydroxylated minerals on the surface of asteroid 4 Vesta. Geophys. Res. Lett. https://doi.org/10.1029/2003GL018627 (2003). 11. Daly, L. et al. Solar wind contributions to Earth’s oceans. Nat. Astron. 5, 1275–1285 (2021). 12. Jones, B., Sarantos, M. & Orlando, T. A new in situ quasi- continuous solar-wind source of molecular water on Mercury. Astrophys. J. Lett. 891, L43 (2020). 13. Praet, A. et al. Hydrogen abundance estimation and distribution on (101955) Bennu. Icarus 363, 114427 (2021). 14. Wöhler, C., Grumpe, A., Berezhnoy, A. A. & Shevchenko, V. V. Time-of-day-dependent global distribution of lunar surficial water/hydroxyl. Sci. Adv. 3, e1701286 (2017). 15. Li, S. & Milliken, R. E. Water on the surface of the Moon as seen by the Moon Mineralogy Mapper: distribution, abundance, and origins. Sci. Adv. 3, e1701471 (2017). 16. Hendrix, A. R. et al. Diurnally migrating lunar water: evidence from ultraviolet data. Geophys. Res. Lett. 46, 2417–2424 (2019).
- 8. Nature Astronomy Article https://doi.org/10.1038/s41550-023-02081-y 17. Tucker, O., Farrell, W., Killen, R. & Hurley, D. Solar wind implan tation into the lunar regolith: Monte Carlo simulations of H retention in a surface with defects and the H2 exosphere. J. Geophys. Res. 124, 278–293 (2019). 18. Jones, B. M., Aleksandrov, A., Hibbitts, K., Dyar, M. & Orlando, T. M. Solar wind‐induced water cycle on the Moon. Geophys. Res. Lett. 45, 10,959–910,967 (2018). 19. Laferriere, K., Sunshine, J. & Feaga, L. Variability of hydration across the Southern Hemisphere of the Moon as observed by Deep Impact. J. Geophys. Res. 127, e2022JE007361 (2022). 20. Poppe, A. R., Farrell, W. M. & Halekas, J. S. Formation timescales of amorphous rims on lunar grains derived from ARTEMIS observations. J. Geophys. Res. Planets 123, 37–46 (2018). 21. Wang, H. et al. Lunar water spatial distribution and its temporal variations. In Proc. 48th Annual Lunar and Planetary Science Conference, 1831 (2017). 22. McCord, T. B. et al. Sources and physical processes responsible for OH/H2O in the lunar soil as revealed by the Moon Mineralogy Mapper (M3 ). J. Geophys. Res. Planets https://doi.org/10.1029/ 2010JE003711 (2011). 23. Lucey, P. et al. The global albedo of the Moon at 1064nm from LOLA. J. Geophys. Res. 119, 1665–1679 (2014). 24. Milliken, R. E. & Mustard, J. F. Estimating the water content of hydrated minerals using reflectance spectroscopy. I. Effects of darkening agents and low-albedo materials. Icarus 189, 550–573 (2007). 25. Wöhler, C. et al. Temperature regime and water/hydroxyl behavior in the crater Boguslawsky on the Moon. Icarus 285, 118–136 (2017). 26. Wang, H. et al. Earth wind as a possible exogenous source of lunar surface hydration. Astrophys. J. Lett. 907, L32 (2021). 27. Milliken, R. & Li, S. Remote detection of widespread indigenous water in lunar pyroclastic deposits. Nat. Geosci. 10, 561–565 (2017). 28. Terada, K. et al. Biogenic oxygen from Earth transported to the Moon by a wind of magnetospheric ions. Nat. Astron. 1, 0026 (2017). 29. Halekas, J. S., Lin, R. P. & Mitchell, D. L. Large negative lunar surface potentials in sunlight and shadow. Geophys. Res. Lett. https://doi.org/10.1029/2005GL022627 (2005). 30. Ness, N. F. The geomagnetic tail. Rev. Geophys. 7, 97–127 (1969). 31. Schaible, M. J. & Baragiola, R. A. Hydrogen implantation in silicates: the role of solar wind in SiOH bond formation on the surfaces of airless bodies in space. J. Geophys. Res. 119, 2017–2028 (2014). 32. Farrell, W., Hurley, D. & Zimmerman, M. Solar wind implantation into lunar regolith: hydrogen retention in a surface with defects. Icarus 255, 116–126 (2015). 33. Tucker, O. J., Farrell, W. M. & Poppe, A. R. On the effect of magnetospheric shielding on the lunar hydrogen cycle. J. Geophys. Res. 126, e2020JE006552 (2021). 34. Williams, J.-P., Paige, D., Greenhagen, B. & Sefton-Nash, E. The global surface temperatures of the Moon as measured by the Diviner Lunar Radiometer Experiment. Icarus 283, 300–325 (2017). 35. Griscom, D. L. Nature of defects and defect generation in optical glasses. In Proc. Radiation Effects on Optical Materials (ed. Levy, P.) 38–59 (SPIE, 1985). 36. Wolf, A., Friebele, E., Griscom, D., Acocella, J. & Tomozawa, M. Radiation-induced defects in glasses with high water content. J. Non-Cryst. Solids 56, 349–354 (1983). 37. Lemelle, L., Beaunier, L., Borensztajn, S., Fialin, M. & Guyot, F. Destabilization of olivine by 30-keV electron irradiation: a possible mechanism of space weathering affecting interplanetary dust particles and planetary surfaces. Geochim. Cosmochim. Acta 67, 1901–1910 (2003). 38. Vance, E., Cann, C. & Richardson, P. Electron irradiation-induced amorphism of some silicates. Radiat. Eff. 98, 71–81 (1986). 39. Jones, B. M. et al. Electron-stimulated formation and release of molecular hydrogen and oxygen from boehmite nanoplatelet films. J. Phys. Chem. C. 126, 2542–2547 (2022). 40. Jones, B. M., Aleksandrov, A., Zhang, X., Rosso, K. M. & Orlando, T. M. Electron-and thermal-stimulated synthesis of water on boehmite (γ-AlOOH) nanoplates. J. Phys. Chem. C. 123, 18986–18992 (2019). 41. Chen, Y., Gonzalez, R. & Tsang, K. Diffusion of deuterium and hydrogen in rutile TiO2 crystals at low temperatures. Phys. Rev. Lett. 53, 1077 (1984). 42. Jordan, A. P. et al. Deep dielectric charging of regolith within the Moon’s permanently shadowed regions. J. Geophys. Res. 119, 1806–1821 (2014). 43. Arnold, J. R. Ice in the lunar polar regions. J. Geophys. Res. Solid Earth 84, 5659–5668 (1979). 44. Li, S. et al. Direct evidence of surface exposed water ice in the lunar polar regions. Proc. Natl Acad. Sci. 115, 8907–8912 (2018). 45. Ichimura, A., Zent, A., Quinn, R., Sanchez, M. & Taylor, L. Hydroxyl (OH) production on airless planetary bodies: evidence from H+ /D+ ion-beam experiments. Earth Planet. Sci. Lett. 345, 90–94 (2012). 46. Green, R. O. et al. The Moon Mineralogy Mapper (M3 ) imaging spectrometer for lunar science: instrument description, calibration, on-orbit measurements, science data calibration and on-orbit validation. J. Geophys. Res. Planets https://doi.org/ 10.1029/2011JE003797 (2011). 47. Bandfield, J. L., Poston, M. J., Klima, R. L. & Edwards, C. S. Widespread distribution of OH/H2O on the lunar surface inferred from spectral data. Nat. Geosci. 11, 173 (2018). 48. Li, S. & Milliken, R. E. An empirical thermal correction model for Moon Mineralogy Mapper data constrained by laboratory spectra and Diviner temperatures. J. Geophys Res-Planet 121, 2081–2107 (2016). 49. Clark, R. N., Pieters, C. M., Green, R. O., Boardman, J. W. & Petro, N. E. Thermal removal from near-infrared imaging spectroscopy data of the Moon. J. Geophys. Res. Planets https://doi.org/10.1029/2010JE003751 (2011). 50. Paige, D. A. et al. Diviner lunar radiometer observations of cold traps in the Moon’s South Polar Region. Science 330, 479–482 (2010). 51. Lin, H. et al. Thermal modeling of the lunar regolith at the Chang'E-4 landing site. Geophys. Res. Lett. 48, e2020GL091687 (2021). 52. Lin, H. et al. In situ detection of water on the Moon by the Chang'E-5 lander. Sci. Adv. 8, eabl9174 (2022). 53. Hapke, B. Bidirectional reflectance spectroscopy: 1. Theory. J. Geophys. Res. Solid Earth 86, 3039–3054 (1981). 54. Lundeen, S., Stephanie, M. & Rafael, A. Moon Mineralogy Mapper: Data Product Software Interface Specification (2011). 55. Li, S. Water on the Lunar Surface as Seen by the Moon Mineralogy Mapper: Distribution, Abundance, and Origins. PhD thesis, Brown Univ. (2016). 56. Sibeck, D. & Lin, R. Q. Size and shape of the distant magnetotail. J. Geophys. Res. Space Phys. 119, 1028–1043 (2014). 57. Tombrello, T. Ion-beam analysis of meteoritic and lunar samples. Nucl. Instrum. Methods 168, 459–467 (1980). 58. Greer, J. et al. Investigating space-weathering on the moon using APT. Microsc. Microanal. 27, 2052–2054 (2021). 59. Bradley, J. P. et al. Detection of solar wind-produced water in irradiated rims on silicate minerals. Proc. Natl Acad. Sci. 111, 1732–1735 (2014). 60. Saal, A. E. et al. Volatile content of lunar volcanic glasses and the presence of water in the Moon’s interior. Nature 454, 192–195 (2008).
- 9. Nature Astronomy Article https://doi.org/10.1038/s41550-023-02081-y 61. Saal, A. E., Hauri, E. H., Van Orman, J. A. & Rutherford, M. J. Hydrogen isotopes in lunar volcanic glasses and melt inclusions reveal a carbonaceous chondrite heritage. Science 340, 1317–1320 (2013). 62. Hauri, E. H., Weinreich, T., Saal, A. E., Rutherford, M. C. & Van Orman, J. A. High pre-eruptive water contents preserved in lunar melt inclusions. Science 333, 213–215 (2011). Acknowledgements S.L. acknowledges the support of the Lunar Data Analysis programme (Grant No. 80NSSC19K0369). A.R.P. was supported by the NASA SSERVI LEADER team (Grant No. 80NSSC20M0060). We acknowledge NASA contract NAS5-02099 and V. Angelopoulos for use of data from the THEMIS-ARTEMIS Mission, specifically C.W. Carlson and J.P. McFadden for use of ESA data. B. Jones and T. Orlando were supported by the NASA Solar System Exploration Research Virtual Institute (SSERVI) under cooperative agreement number 80ARC017M0007 (REVEALS). Authorcontributions S.L. conceived the project and performed the data analysis and interpretation. A.R.P. prepared the ARTEMIS data. A.R.P., T.M.O., B.M.J., O.J.T., W.M.F. and A.R.H. contributed to the data analysis. T.M.O. and B.M.J. contributed to the discussion of the role of electrons on the formation of water. O.J.T. and W.M.F. contributed to the discussion of the diffusion of the implanted solar wind hydrogen. S.L. wrote the paper. All coauthors read, commented and agreed on the submitted paper. Competinginterests The authors declare no competing interests. Additionalinformation Supplementaryinformation The online version contains supplementary material available at https://doi.org/10.1038/s41550-023-02081-y. Correspondence and requests for materialsshould be addressed to S. Li. Peer review information Nature Astronomy thanks Quanqi Shi and the other, anonymous, reviewer(s) for their contribution to the peer review of this work. Reprints and permissions informationis available at www.nature.com/reprints. Publisher’s note Springer Nature remains neutral with regard to jurisdictional claims in published maps and institutional affiliations. Springer Nature or its licensor (e.g. a society or other partner) holds exclusive rights to this article under a publishing agreement with the author(s) or other rightsholder(s); author self-archiving of the accepted manuscript version of this article is solely governed by the terms of such publishing agreement and applicable law. © The Author(s), under exclusive licence to Springer Nature Limited 2023