1. A Climatological Relationship between MJO/ENSO Phases and Tropical
Cyclone Interactions with Saharan Dust Storms across the Tropical Atlantic
Jordan Rabinowitz1, Anthony R. Lupo2
1,2Department of Soil, Environmental & Atmospheric Sciences
University of Missouri-Columbia
Introduction/Background
Saharan Air Layer (SAL): dry air masses (1.5 to 3 km in depth) that form over the Sahara Desert (late spring to early
fall) and usually move across the Atlantic Ocean every 3 to 5 days.
Over the past decade, research has investigated SAL impacts on tropical cyclones.
Saharan Dust has been known to be unfavorable to TC genesis/maintenance due to:
1) African Easterly Jet (20-50 kt winds) increases environmental vertical wind shear.
2) Dry air injected into TC; promotes downdrafts in the vicinity of developing VHTs.
3) Radiative dust enhancing trade wind inversion; less potential for deep convection.
Methodology
Analyzed satellite-derived parameters from the University of Wisconsin’s Cooperative Institute for Meteorological
Satellite Studies (CIMSS) tropical archive: 24-hour Wind Shear Tendency, Deep-Layer Shear, SAL Imagery and Atlantic
IR/IR NHC-Enhanced Satellite Imagery.
Objectives
Evaluate potential relationship(s) between the Madden-Julian Oscillation and the El Nino Southern Oscillation with
respect to SAL impacts on TC structure and intensity. This work was conducted on the 96 TCs in this study.
Conclusions
MJO Wet Phases across the W. Hemisphere and E. Pacific enhance TCs via enhanced deep-layer moisture.
TC symmetry increased in the majority of cases within 12 to 24 hours after SAL influences decreased.
Future Work
Assess how the MJO may act to enhance ENSO conditions and subsequent impacts on TC intensity/structure.
Expand upon the dynamics of the MJO/ENSO relationship and implications on TC intensity changes.
Assess Saharan Dust plume concentration/origin with respect to the filamentation of Saharan Dust into TC vortices.
References
Atlantic Oceanographic & Meteorological Laboratory, Hurricane Research Division.
'TCFAQ A17) What Is The Saharan Air Layer (SAL) ?'. Aoml.noaa.gov. N.p., 2010. Web.
10 Nov. 2015.
Braun, Scott A. 'Reevaluating The Role Of The Saharan Air Layer In Atlantic Tropical
Cyclogenesis And Evolution'. Monthly Weather Review. N.p., 2009. Web. 10 Nov. 2015.
Dunion, Jason P., and Christopher S. Velden. 'THE IMPACT OF THE SAHARAN AIR LAYER
ON ATLANTIC TROPICAL CYCLONE ACTIVITY'. Journals.ametsoc.org. N.p., 2003. Web. 10
Nov. 2015.
Goldman, Jana. 'NOAA News Online (Story 2206)'. Noaanews.noaa.gov. N.p., 2004.
Web. 1 Dec. 2015.
Meted.ucar.edu,. 'Schematic Of Saharan Air Layer'. N.p., 2015. Web. 20 Nov. 2015.
Michalak, Arthur E. 'Properties And Influences Of The Saharan Air Layer On Tropical
Cyclogenesis'. Department of Physics, and Program in Atmospheric and Oceanic
Sciences. N.p., 2004. Web. 10 Nov. 2015.
Nhc.noaa.gov,. 'NHC Data Archive'. N.p., 2015. Web. 10 Nov. 2015.
University of Wisconsin (CIMSS)
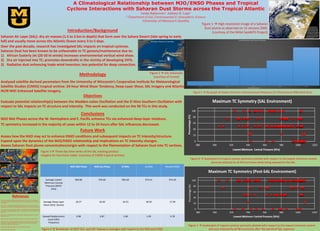
Figure 6 Scatterplot of tropical cyclone symmetry plotted with respect to the lowest minimum central
pressure attained by all 96 hurricanes while being exposed to the SAL.
Figure 7 Scatterplot of tropical cyclone symmetry plotted with respect to the lowest minimum central
pressure attained by all 96 hurricanes after the period of SAL exposure.
Figure 5 Bar graph of lowest minimum central pressure frequency (21 hPa pressure differential bins).
Figure 4 Breakdown of MCP, DLS, and ERC frequency averages with respect to the MJO and ENSO
Figure 3 Three-day time-series of the SAL tracking product
imagery for Hurricane Isabel. (courtesy of CIMSS tropical archive)
Figure 2 SAL Schematic
(courtesy of Comet)
MJO Wet Phase MJO Dry Phase El Niño La Niña Neutral-ENSO
Average Lowest
Minimum Central
Pressure (MCP)
(hPa)
969.86 976.60 965.69 973.41 974.20
Average Deep-Layer
Shear (DLS) (knots)
18.27 18.40 19.23 18.59 17.94
Eyewall Replacement
Cycle (ERC)
Frequency
0.98 0.87 1.08 1.09 0.78
Figure 1 High-resolution image of a Saharan
Dust plume as observed on 12 January 2000.
(courtesy of the NASA SeaWiFS Project)