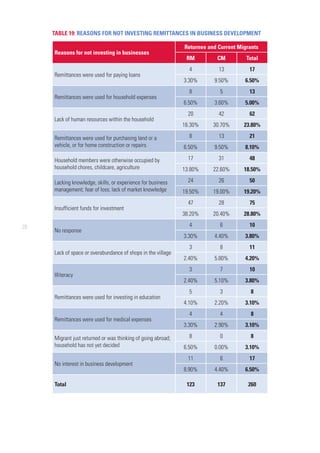
SlideShare a Scribd company logo
Foreign Labor Migration
Remittances and their Impact
A S t u dy f r o m N e pa l
Copyright Combatting Trafficking in Persons (CTIP) program, World Education, Inc., United States
Agency for International Development (USAID), May 2016
Lead Authors: Sabina Pradhan, Sangita Bista
Contributing authors: Ishwar Mainali, Emma Tobin
World Education, Inc. acknowledges the technical and financial support provided by the United States
Agency for International Development's Combating Trafficking in Persons program, implemented by
The Asia Foundation, in the publication of this document.
This study is made possible by the support of the American People through the United States Agency
for International Development (USAID) and The Asia Foundation (TAF). The contents of this study are
the sole responsibility of World Education, Inc and do not necessarily reflect the views of USAID or the
United States Government and The Asia Foundation (TAF).
Executive Summary 	 1
Chapter 1	 5
1.1 Introduction	 5
1.2 Research Problem/rational for the study	 5
1.3 Objective and Research questions	 6
Chapter 2 	 6
2.1 Literature Review	 6
Chapter 3 	 8
3.1 Research methodology and design	 8
3.2 Data collection	 9
3.3 Analysis of Data	 9
3.4 Ethical considerations	 9
3.5 Reliability and Validity	 9
3.6 Risks and Challenges	 9
3.7 Study Scope and Limitations 	 10
Chapter 4	 10
4.1 Analysis and Findings	 10
4.2 Qualitative Analysis:	 37
Chapter 5	 38
5.1 Recommendations: 	 38
REFERENCES	 41
Annex 1	 43
Ta b l e o f C o n t e n t s
CBS Central Bureau of Statistics
CM Current Migrant
DOFE Department of Foreign Employment
FE Foreign Employment
FEPB Foreign Employment Promotion Board
FGD Focus Group Discussion
GDP Gross Domestic Product
GoN Government of Nepal
HHs Households
IME International Money Express
NLSS Nepal Living Standard Survey
NRs Nepali Rupees
RM Returnee Migrant
SPSS Statistical Package for Social Science
TAF The Asia Foundation
VDC Village Development Committee
WEI World Education, Inc.
L i st o f A c r o n y m s
F o r e w o r d
Remittances from foreign employment constitute a substantial portion of Nepal’s GDP, and most
rural households now depend on at least one member's earnings from employment away from
home, and often from abroad. As remittances are primarily routed through families, they can
influence family dynamics in both positive and negative ways. Remittances permit families to
increase their consumption level, enabling better health care, nutrition, housing and education,
thus reducing poverty levels.
Despite the significant contributions of remittances from foreign labor migration for improving the
standard of living of migrant households, critics point out that remittances are rarely invested in
productive sectors. The Nepal Living Standard Survey 2010/11 reported that of the total remittances
sent to Nepal, 79% are used for daily consumption, 7% for paying back loans, 4% for education, while
only 2% is used for capital formation. This evidence cautions us to think about the role of remittances
in strengthening the economy of Nepal since consumption alone does not promote economic growth.
In addition, migration and remittances have affected traditional social structures and power relations
within the household due to absence of family members, either male or female, and availability of
additional financial resources.
With the increasing trend of foreign labor migration and its changing dimensions, the present study
assesses the inflow of remittances in relation to the migration process followed—either safe (regular)
or unsafe (irregular)—and its impact in terms of social, economic, and human capital on migrant-
sending households. The results of this study will be used to inform financial literacy programming and
the messages in pre-departure programming for migrant workers. This information is very timely as
many of these households will be relying on remittances to reconstruct homes and revive livelihoods
after the massive earthquakes of April and May 2015.
This study was carried out by World Education, Inc., through the Combating Trafficking in Persons
program, led by The Asia Foundation and supported by USAID-Nepal.
This report would not have been possible without the support of TAF and USAID and the tireless
efforts of the staff of partner organizations, Change Nepal, Pourakhi Nepal, and Gramin Mahila
Swabalamban Sastha (GMSS), in Kathmandu, Sindhupalchok and Makwanpur, respectively who were
directly involved in the data collection process.
World Education welcomes comments and feedback on the study with the aim of strengthening
both future research and ongoing programming to prevent trafficking and promote safe migration.
Helen Sherpa
Country Director
1
E x e c u t i v e S u m m a ry
The primary objective of the present study is to assess the larger migration process (“safer
migration” versus “unsafe migration”) and its relationship with earnings, savings, and remittance-
sending behaviors of Nepali labor migrants. The study outlines channels used for transferring
remittances, use of remittances at the household level, and explores the impact of remittances
in terms of economic, social, and human capital. The study was carried out in the 300 remittance-
receiving households (150 households of returned migrants and 150 households of current migrants)
in 7 Village Development Committees (VDCs) in Nepal: Chitlang and Gadi of Makwanpur district;
Chhaimale, Talku, and Satungal of Kathmandu district; and Sanosiruwari and Dubachaur of
Sindhupalchok district.
Mixed research methods were utilized; both quantitative and qualitative data was collected.
A purposive sampling method was employed to gather quantitative data via a household level survey.
Furthermore, non-probability purposive sampling was used to select the participants for Focus Group
Discussions (FGD) including both Returned Migrants (RM) and/or current migrants’ household heads.
Socio-demographic Profile of Respondents:
Three hundred households participated in the study; each household had a member who was a
current or returned migrant. Of these migrants, 94.7% were male and 5.3% were female; 69.3%
were married and 30.7% unmarried. Only 2% were illiterate while 98% were literate or had some
formal education; 59.3% of respondents received at least a secondary education. Participating
migrant workers’ ages ranged from 16 to 46 years. The average age of the migrant workers
represented in the study is 25.3 years. Approximately three quarters of migrants represented
in the study were between 18 and 29 years at the first time of movement abroad for migration,
whereas 23% were 30 years old or older. Only 3.3% of the total 300 migrants were under 18 at
the time of their first migration. However, this percentage is higher (25%) among the 16 females who
participated in the study in comparison to 2.1% among 284 males.
The Process of Migration:
Pre-departure orientation is a prerequisite from the Government of Nepal for foreign employment.
However, only one fifth (19.3%) of returnee migrants in the study had received the orientation. Out
of 139 male returnee migrants, one fifth (20.9%) had participated whereas zero female migrants had
attended an orientation. Of the total 150 returnee migrants, only 27.4% used what are considered
to be safe channels of migration: manpower agencies or the Government. The remainder arranged
their foreign employment through private agents (44%) and relatives, friends, or neighbors (28.7%).
Of the total 150 returnee migrants, 8% had gone abroad (to a third country) via an Indian airport which
is considered irregular or unsafe migration, as it is not documented or monitored by the Government
of Nepal. However, it was found that the proportion of women (54.4% out of 11 returnee migrants)
who had used Indian airports was higher in comparison to men (4.2% of 139 male returnees). Though
only 8% of returnee migrants had used an Indian airport, less educated migrants were found more
likely to do so. Twenty five percent of non-literate participants (4 total); 13.3% of literate participants
(15 total); 10.2% of participants with primary education (49 total); 5.3% of participants with secondary
educations (57 total); and only 4.0% of participants with higher secondary educations had used an
Indian airport to go abroad. This strongly suggests that there is an inverse correlation between the
education status of migrant workers and irregular or unsafe migration.
2
Both returnee migrants (RM) and current migrants (CM) had used multiple sources to cover the
expenses of going abroad. The majority (72%) had taken a formal loan; 20% had utilized household
savings; 18.7% had borrowed from a personal source; and 9.3% had used personal savings. In
addition, smaller numbers of respondents had sold ornaments (3%); sold property (2.3%); and had
their expenses covered by hiring company (1%). Two thirds (63.3%) of both RMs and CMs had paid
over Nepali Rupees (NRs.) 80,000 as a service charge for migration, whereas the other 26.3% paid
less than 80,000 NRs. This is significant as, up until June 20151
, the Government of Nepal stipulated
that no migrant should pay over 80,000 for foreign labor migration.
Earning, Sending, and Utilizing Remittances:
The data shows that the longer the length of stay in the destination country, the more funds that
were sent to the country of origin. 56% of migrants who stayed abroad for less than five years sent
up to 500,000 (5 lakh) NRs. whereas 62% of migrants who stayed abroad for five years or more
had sent over 5 lakh.
Of the total 300 migrants (RM = 150, CM = 150), 25% of male migrants had sent more than
10 lakh NRs; however, only 6% of female migrants had remitted as much. Further, there was
a correlation between a migrant’s education status and the amount of money that he or she
was able to remit, with more educated migrants sending more money. 14% of respondents with
only a primary education (up to class 5) had sent more than 10 lakh NRs. whereas 24% of migrants
with a secondary education or higher had done so.
The majority (93.1%) of returnee migrants who participated in a pre-departure orientation (29 migrants)
were aware of the salary and benefits offered by his/her hiring company whereas only 68.6% of those
who had not taken pre-departure orientation (121 migrants) possessed this information. Among all
300 migrants, 58% had received a salary of NRs. 25,000 per month or more, followed by 22.3% who
received less than 20,000; 13.75% who received 20 to 25 thousand; and 6% who did not state their
salary.
Out of 300 migrants, 214 (71.3%) had chosen money transfer centers (IME, Western Union, Prabhu,
Himal Remit, etc.) as a means for sending remittances while 23.7% had chosen banks and the
remainder had used a Hundi2
(2.3%), friends or relatives (1.3%), and self-delivery (1%). Ninety five
percent of migrants used official channels to send remittances due to the perceived trustworthiness
of these methods, efficient services, and the easy access of funds for recipients.
A total of NRs. 248,585,500 (approximately $2,399,103 U.S. dollars) was remitted by 281 respondents
to Nepal. This does not include funds sent by the nineteen respondents who elected not to respond
to the question. The average respondent remitted NRs. 884,644 throughout his or her foreign work
period (ranging from less than 1 year to over 10 years).3
Migrants who had chosen irregular channels of
migration (namely Indian airports) sent an average of NRs. 814,167, whereas the average remittance
amount sent by foreign workers who migrated through authorized channels (Nepalese airports) is
higher: NRs. 867,040. In addition, 251 migrants also sent or brought back goods equivalent to an
average of NRs. 94,610 per migrant.
1
Since June 2015, the Government’s “free-visa, free-ticket” scheme requires the employer to cover the costs of round-trip
airfare and visas for migrants traveling to six Gulf states and Malaysia, and reduces the maximum charge for manpower
agencies to NRs. 10,000. (The Kathmandu Post, “Free-visa, free ticket,” May 2, 2016). Further, since April 2015, the
Government of Qatar has deemed that employers should cover all costs for Nepali migrants coming to the country (Nepal
Times, “Zero cost migration, really?”, April 2015). Despite these changes in policy, migrants are still frequently charged
high fees for the costs associated with migration.
2
A Hundi is an informal transfer of money through non-banking sources.
3
Households of current migrants were still receiving remittances from their migrant worker family member at the time
of the study.
3
In addition, foreign labor migration has created social changes among remittance-receiving
households, with the overall workload of household members having shifted due to the effect
of foreign employment. For instance, the roles and responsibilities of non-migrated spouses in the
households of respondents have increased in cooking (47.3% to 57.3%), washing dishes (52% to
58%), washing clothes (50.7% to 59.3%) and cleaning the house (49.3% to 58.0%). The roles and
responsibilities of spouses have shifted even more significantly for work outside of the home; the
responsibilityforshoppingorgoingtothemarkethasincreasedfrom19.7%to46.2%;theresponsibility
for going to the office of electricity to pay bills has increased from 16.8 % to 45.6%; and attending
financial institutions to make transitions has increased from 18.8% to 45.6% among the spouses of
migrants. These findings imply that, for non-migrated family members, labor migration creates a small
increase in responsibilities within the home, and a much more significant increase in responsibilities
for tasks and errands outside of the home.
Remittance has a direct impact on access to physical facilities and increases sources of potable
drinking water. Among the 300 migrants represented in the study, the number of concrete roofs on
the family home increased from 6.7% to 17.7%. Further, 17% of respondents previously used the
river, pond, or lake as a source of drinking water but this was reduced to 7.7% due to the increased
percentage of water taps in the homes of respondents from 21% before migration and 36% after.
The use of gas in the personal kitchens of respondents has also increased from 7.7% to 46.3%.
Approximately 22% of respondent had no toilet before going abroad but this has decreased
to only 4.3%.
Remittance also has a direct impact on receiving households’ access to various means of
communication. There is a significant increase in the use of mobile phones (51.4%), televisions
(31.3%), and computers (19.4%) by the family members of migrants.
Migrants' families have also invested money in the education of their children. The data shows that
the proportion of children enrolled in Government schools has increased from 62.9% to 67.7%. At the
same time, the proportion of enrollment in private schools has decreased from 37.1% to 32.3%, with
increased engagement in private tuition from 9.7% to 33.9% Although the reason for the increase in
enrollment in Government schools is undetermined, it may be connected to the Government school
children’s relatively easy access to higher education scholarships, or it may reflect parents’ preference
to send their children to Government schools while paying for private tuition versus paying for private
schooling.
Based on the above findings, it is concluded that there is an improvement in standard of living for
migrants’ families within Nepal due to remittance. Therefore, while working together to mitigate
vulnerability and risks of migration at the community level through effective information and
services, policy makers and program implementers should also be aware of the positive outcomes
of remittance, and promote programs that encourage its responsible use.
4
5
C h a p t e r 1
1.1 Introduction
Nepal has a long history of foreign labor migration dating back to nineteenth century when
Nepalese used to travel for Lahore to join the army of Sikh ruler Ranjit Singh.4
The agreement
between Nepal and colonial British government in India in May 1915 formalized the opportunity
for foreign employment for Nepalese, especially in the Indian and British armed forces. Since
then, Nepalese have been migrating to North-East India in search of work.5
The Government of Nepal
(GoN) officially recognized the value of foreign labor migration beyond the Indian subcontinent with
the approval of Nepal’s Labor Act of 1985.
The economic boom in the Middle East over the last two decades has lead to increased demand
for workers, consequently increasing the rate of foreign labor migration from Nepal to the region.6
Though this strong pull factor was evident in attracting Nepali migrants to overseas jobs, the push
factor of instability in Nepal played an important role after 2000, when the Maoist insurgency
intensified and the manufacturing sector was severely affected by the worsening investment
climate. Several community-level studies reported the lack of employment opportunities and
inadequate earnings to bear household expenses as two crucial push factors for migration.7
In
addition, the Government decision to decentralize the passport issuing process through the District
Development Office in 2000 created a synergistic effect for encouraging foreign labor migration
towards the Middle East. The major destination countries during the latter part of the 1990s were
Saudi Arabia, the United Arab Emirates (UAE), Kuwait, and Qatar.8
The situation has not much
changed over the past decade; Department of Foreign Employment (DoFE) data from FY 2006/07
to 2011/12 showed that major destination countries of Nepali labor migrants as Malaysia (31%),
Qatar (28%), Saudi Arabia (20%) and UAE (13%).9
1.2 Research Problem/rational for the study
Despite the increasing trend as well as the changing dimensions of foreign labor migration and
the huge contribution of foreign labor migrants to Nepalese macro and micro economy, the GoN and
developmental agencies have been very slow to recognize the significance of foreign labor migration
and have done little to protect and promote the rights of migrants in Nepal and in destination
countries. As a result, the increase in foreign labor migration has been accompanied by various
problems including forgery, fraud, and deception in foreign employment. According to the study by
Amnesty International, 93% out of 114 returnee migrants reported being deceived in terms of salary,
and three female migrants had been trafficked into prostitution.10
Furthermore, the recent trend of
increasing numbers of deaths of foreign labor migrants reported from Malaysia and Gulf countries
has raised concerns as to whether these countries are primarily providing safe labor opportunities
or presenting significant risks to migrants. Moreover, while the direct economic impact of remittance
to improve the living standard of labor migrants’ households is not controversial, the non-monetary
4
Seddon DA, Adhikari Jagannath, .Gurung, Ganesh. Foreign labor migration and Remittance Economy of Nepal. Critical Asian
Studies. 2010;34(1):19-40
5
New Era. Study in inter-regional migration in Nepal. 1981
6
Seddon D. Nepal's Dependence on Exporting labor 2005: Available from:http://www.migrationpolicy.org/article/nepals-
dependence-exproting-lobour
7
Bahdra C. International Labour Migration of Nepalese Women: The impact of their remittances on poverty reduction 2007.
8
World Bank. Large-scale migration and Remittance in Nepal: issues, challenges, and opportunities.
9
National Human Rights Commission. Foreign Labor Migration and Trafficking in Person in Nepal:
10
International. A OUT ON A LIMB Nepalese Migrant Workders Failed by State and Recruitment Industries 2011
6
effect of remittances—such as impact on health, education, gender issues, social participation,
politics, and women’s empowerment—are unexplored areas.
Therefore, this study assesses the inflow of remittances in relation to the migration process
followed (safe and unsafe) and its impact in terms of the social, economic, and human capital
of remittance sending/receiving households.11
1.3 Objectives
The study aims to fulfill knowledge gaps by exploring the link between remittance inflow and the
migration process, and its social and economic impacts on migrant-sending and remittance-receiving
households in selected areas.
Specific Objectives:
•	 Identify the process of labor migration for first-time migrants
•	 Describe the socio-demographic profile of migrants and their households
•	 Identify the earning, savings, and remittance-sending behaviors of labor migrants, including
the channels used for transferring remittances
•	 Determine the ways in which remittance-receiving households utilize remittance monies
•	 Explore the household and family-level impacts of remittances in terms of economic, social,
and human capital formation
C h a p t e r 2
2.1 Literature Review
Background and context
Every year, huge numbers of people around the world migrate to foreign countries in search better
economic opportunities and an improved quality of life for themselves and their families. In 2013, the
United Nations Populations Division estimated that there were 232 million foreign migrants globally.12
Over the past 20 years, Nepal has become a source country for millions of foreign labor migrants,
largely as a result of limited employment opportunities domestically, the Government’s liberal policies
on out-migration since the early 1990s, and the growing demand for labor in the Middle East and
beyond. 1,466 Nepali nationals depart for foreign labor migration each day.13
Half a million Nepalis,
primarily youth, went abroad for foreign employment in the fiscal year 2013/14 alone.14
However, these
figures exclude undocumented migrants15
and those working in India -the top destination country for
Nepali migrant workers. Although the 2011 Census put the total foreign migrant population at just
over 2 million, the actual number of Nepali foreign labor migrants is arguably unknown due to the high
occurrence of irregular migration and a lack of comprehensive research.16
11
Nepal Rastriya Bank. Impact Evaluation of Remittances: A case study of Dhanusha District, 2012.
12
GIZ and ILO. Labour Market Trends Analysis and Labour Migration from South Asia to Gulf Cooperation Council Countries,
India and Malaysia, 2015.
13
Department of Foreign Employment (DoFE) Annual Report 2014/15
14
GIZ and ILO. Analysis of Labor Market and Migration Trends in Nepal, 2015.
15
Documented migrants depart for foreign labor destinations via Nepal’s airport; undocumented or irregular migrants
travel to India and then on to a third country via an India airport.
16
Department of Foreign Employment, Labour Migration for Employment, A Status Report for Nepal, 2013/2014
7
17
World Bank, http://data.worldbank.org/country/nepal
18
Central Bureau of Statistics. Nepal National Population and Housing Census, 2011
19
GIZ and ILO. Analysis of Labor Market and Migration Trends in Nepal, 2015.
20
World Bank Group. Large-Scale Migration and remittance in Nepal: Issues, Challenges, and Opportunities, p. ii, 2011.
21
GIZ and ILO. Analysis of Labor Market and Migration Trends in Nepal,. P. 18, 2015
22
Although the ban was in place at the time of this research, as of May 2016, the Government of Nepal has revised the
restriction. Women 24 years of age and above will soon be able to legally pursue employment as domestic workers in the
Gulf and Malaysia. (Kathmandu Post, “Ban on women going for domestic jobs lifted,” May 13, 2016).
23
GIZ and ILO. Labour Market Trends Analysis and Labour Migration from South Asia to Gulf Cooperation Council Countries,
India and Malaysia, p. 20-21, 2015.
24
A proportion of this group may be absent from their home communities but engaged elsewhere within Nepal, as domestic
labor migration is also common.
25
National Institute of Development Studies. Nepal Migration Year Book 2009
26
National Institute of Development Studies. Nepal Migration Year Book 2009
27
Adhikari, Samik. “Reducing the Cost of Migration in Nepal”, Harvard Kennedy School SYPA written in fulfillment of degree
requirement, May 2015. http://www.hks.harvard.edu/content/download/76406/1714127/file/Samik%20Adhikari%20
SYPA.pdf
28
World Bank Group. Large-Scale Migration and remittance in Nepal: Issues, Challenges, and Opportunities, p. ii, 2011.
Socio-demographic profile of Nepali labor migrants
With a population over 28 million17
and 57% of these of legal working age18
, the demand for jobs
in Nepal is significant. According to A World Bank Group report, “almost everyone is migrating –
the rich, the poor, people from the Mountains, Hills, and Terai, and from all of the country’s five
development regions.” However, they are not migrating in equal proportion. Nepal’s poorest and
least educated citizens are least likely to seek foreign employment beyond India, as the costs of
migration are prohibitive, while those with the highest levels of education are likely to be “absorbed
domestically”19
. It is therefore those with primary to secondary educations who are most likely to
go abroad for foreign employment; the World Bank Group report confirms that “middle class” families
are most likely to have a member working abroad.
The likelihood of foreign labor migration differs substantially by sex, as well. Nepali men
are significantly more likely to seek foreign employment than women, as evidenced in the 2011
census data on absent populations. Although it is not a guarantee that the entire absent population
has gone abroad for foreign employment, it is estimated that only 6-7% of current foreign labor
migrants are female20
. This is in part due to socio-cultural, patriarchal norms in which men are
considered appropriate providers21
and in part to the Government’s ban on migration for women under
30 years old22
, a law that drives many younger women to migrate through undocumented channels,
namely through India.23
In contrast, men are eligible for foreign migration at the age of 18 in Nepal.
According the National Population and Housing Census of 2011, the largest group of absentees
(44.8%) was between the ages of 15 and 2424
, while the World Bank Group report shows that
the majority of foreign labor migrants are between 20 and 44 years old.
Safe migration, unsafe migration, and risk of human trafficking
Human trafficking and exploitative labor are ever-present risks in Nepal, and those seeking
foreign employment are often the targets of scams by brokers and manpower agencies, abuse by
employers, and forced labor. Undocumented migrants’ rights are at even greater risk, both throughout
the migration process and upon arrival, as their exact numbers and whereabouts are unknown;
further, an undocumented status may be associated with a lack of access to services in destination
countries25
. The human rights abuses that have and continue to occur against Nepali labor migrants
in Gulf countries and elsewhere are well-documented26
, and policies concerning labor migration
have therefore been criticized for failing to protect migrants.27
Attempts have been made to reduce
the risk of sex trafficking, particularly for female migrants, but the resulting policies (such as the
age ban and additional steps in the migration process for women) may actually drive aspiring female
migrants to make riskier migration decisions.28
8
29
Department of Foreign Employment, Labour Migration for Employment, A Status Report for Nepal, 2013/2014
30
GIZ and ILO. Analysis of Labor Migration Trends in Nepal,. p. 1, 2015
31
Department of Foreign Employment, Labour Migration for Employment, A Status Report for Nepal, 2013/2014
32
GIZ and ILO. Analysis of Labor Market and Migrations Trends in Nepal, p. XXI, 2015
Remittances and their economic and social impact
Despite the very real potential risks of foreign employment, there is no denying the substantial
impacts of remittances from foreign labor migrants on Nepal’s economy. According to the
Government of Nepal,“…migration and remittances contribute to the development and adaptation
needs of recipient families and origin communities…in the form of employment, food security,
asset creation, livelihood diversification…disaster risk reduction, (and) changes in attitudes or
skills.”29
The Government estimates that if remittances ceased, the rate of poverty would increase
from 19.3% to 35.3%. The 2009 Migration Year Book demonstrates how the ratio of remittances
to GDP gradually increased between 2005 and 2009. According to the World Bank Group report, 2.7
billion U.S. dollars were remitted to Nepal in 2009, accounting for 22% of the GDP. A joint report
by the International Labor Organization and GIZ states that the remittances received in just the
first 9 months of fiscal year 2013/2014 were equivalent to 4.1 billion U.S. dollars, or nearly 30%
of Nepal’s GDP30
.
Policy planning
Scholars and policy makers have traditionally thought of labor migration in terms of “push” and
“pull factors.” In contrast, today “…scholars are increasingly looking at global migration patterns
as “systems” produced through interaction between macro-level and micro-level processes.”31
However, policy-making in Nepal has not kept pace with research; according to some experts,
“existing policies on labour and migration have not envisaged the management of migration in a
holistic manner and a broader framework for maximising the economic impacts of migration,
remittance transfer, and skills enhancement of workers alongside protection of migrant workers
is lacking.”32
The present study aims to contribute to evidence base to help inform policy making
in Nepal in regard to foreign labor migration.
C h a p t e r 3
3.1 Research methodology and design
3.1.1 Research Methodology
An Action Research Approach was used as the study aims to use its findings to develop action, i.e.
to inform strategy to make migration a worthwhile venture; to prevent unsafe labor migration; and
to generate recommendations for making migration a “triple win” strategy for migrants, the societies
that receive them, and for their country of origin.
A cross-sectional study design was developed, incorporating quantitative and qualitative methods.
A purposive sampling method was used to identify the potential households for the household level
survey. Furthermore, non-probability purposive sampling was used to select participants for Focus
Group Discussions (FGD) among RM and/or HH head of RM and CM
9
3.2 Data collection
The data for the fulfillment of the stated objectives of the study is based on primary sources and
was elicited by the researchers through surveys from the field specified. The data collection tool
was designed to elicit responses from 150 current migrants’ families and 150 returnee migrants
of 3 districts (Kathmandu, Sindhupalchok and Makwanpur).
A semi-structured questionnaire was used to collect both quantitative and qualitative data from
300 respondents, 150 from CM households and 150 from RM households. A separate questionnaire
was used to gather the qualitative data from Focus Group Discussions (FGD); FGDs were comprised
of returned migrants, household heads of current migrants, grade 9 and 10 students within the
community, and representatives of local political parties. Qualitative information was gathered during
FGD in which a voice recorder was used and notes were taken.
3.3 Analysis of Data
The collected quantitative data was entered into SPSS software and transferred to MS Excel software
for cleaning. After cleaning the data, it was again transferred to SPSS. Recoding of variables was done
as per the need for the analysis of variables. A structured checklist was used to gather qualitative
data. Audio recordings from Focus Group Discussions (three per study district) was transcribed and
analyzed by the Monitoring and Evaluation Specialist from the World Education CTIP project.
3.4 Ethical considerations
At the initial stage of the data collection process in the field, the objectives of the study were
clearly explained to the respondents. Respondents were also informed that they could end the
survey at any stage of the process. Both verbal and written consent were taken prior to survey
collection and focus group discussions. Consent was also taken with the respondents to use
electronic media, including audio-tape recorders and cameras. The interviewers were staff of a
Combating Trafficking in Persons (CTIP) program partner organizations, who were fully supported
in the field by supervisors and coordinators of their respective organizations, particularly if and
when they faced challenges when interviewing the respondents. The interviewers were suggested to
use indirect questions if the answers were not easily elicited.
3.5 Reliability and Validity
Pre-testing of instruments was conducted in settings similar to those of the study. After pre-testing,
the questionnaires were adjusted based on lessons learned. Data collection was conducted by
NGO partner staff familiar with the issues/topics of the study (i.e. foreign migration, remittance,
trafficking, etc.). They were also given a two-day orientation on the data collection tools.
Analysis has been done by staff experienced with using SPSS
3.6 Risks and Challenges
Some difficulties were faced while attempting to collect data on the social-economic conditions
of participants. The respondents were often not willing to share personal information relating
to their economic status and that of their household, such as having loans and bank balances.
For that reason, the research team used a rapport-building method and asked follow-up questions
when appropriate so as to ensure data accuracy. Still, in some cases, respondents opted not to
respond to some questions.
10
3.7 Study Scope and Limitations
The study was carried out in three hill districts, Sindhupalchok, Kathmandu and Makwanpur where
the CTIP programme is being implemented. This study did not collect data from the Terai CTIP districts,
which include Banke and Kanchanpur. This study thus represents the views, opinions, and practices
of RM and CM of the hill district residents only, Sindhupalchok, Kathamandu and Makwanpur.
C h a p t e r 4
4.1 Analysis and Findings
4.1.1 The Migration Process Descriptive analysis of sample households
The study was carried out among 300 households (HHs) from three districts: Sindhupalchok (100 HHs),
Kathmandu (100 HHs), and Makwanpur (100 HHs). Among them, 150 HHs had one family member
who was a current migrant (CM) and 150 had a family member who was a returnee migrant (RM).
Table 1 shows the details of the presented migrants according to their VDC and district.
Location (VDC)
Chitlang
Gadi
Chhaimale
Talku
Satungal
Sanosiruwari
Dubachaur
Districtwise
Total
Current Migrants (CM)
Kathmandu - - 10 27 13 - - 50
Sindhupalchok - - - - 0 25 25 50
Makwanpur 30 20 - - - - - 50
Returnee Migrants (RM)
Kathmandu - - 20 21 9 - - 50
Sindhupalchok - - - - - 25 25 50
Makwanpur 20 30 - - - - - 50
VDC wise Total 50 50 30 48 22 50 50 300
TABLE 1: NUMBER OF RESPONDENTS PER VDC AND DISTRICT
11
Sex disaggregated data of migrants:
Male migrants accounted for 94.7% of the participants (284 out of 300 migrants) in surveyed districts,
whereas female migrants made up 5.3% (16 out of 300). While discussing this imbalance with
stakeholders from Chitlang and Gadi VDC of Makwanpur, they attributed the stigma attached to
female labor migrants to the assumption or belief (regardless of the reality) that they are involved in
sex work. This, they believed, is the main reason behind the low rate of female labor migration in their
district. Gender norms that place the main responsibility for raising children, caring for the elderly, and
managing household and agricultural activities are likely also factors. In addition, the Government of
Nepal imposes stricter age requirements on female migrants than on male migrants, which may also
be a limiting factor for female migrant workers. That said, the practice of female labor migration is
relatively new in Nepal and is gradually increasing over time.
Table 2 shows that Sindhupalchok had the highest number of female migrants in the study, followed
by Kathmandu, and Makwanpur. This finding is consistent with the Status Report of Foreign Labour
Migration - 2013/14 where Sindhupalchok ranked first among the top-ten origin districts for female
migrants in Nepal.
Marital Status of Migrants:
Table 3 depicts the marital status of labor migrants participating in the study. A higher proportion
of migrants (69.9% or 208 out of 300 migrants) embarked on foreign labor migration after marriage
while only 30.7% were unmarried at the time of migration. Analysis of the data by sex shows that
only 28.9% of male migrants were unmarried at the time of migration whereas this percentage
is higher (62.5%) among females. The status of unmarried migrants is slightly higher (34%)
in Kathmandu as compared to Sindhupalchok (29%) and Makwanpur (29%) which may reflect
a socio-demographic difference between urban and rural labor migrants.
District
Returnee Current Total Percent
Male Female Male Female Male Female
Kathmandu 46 4 50 0 100 96 4
Sindhupalchok 44 6 48 2 100 92 8
Makwanpur 49 1 47 3 100 96 4
Total 139 11 145 5 300 94.7 5.3
TABLE 2: SEX DISTRIBUTION OF MIGRANTS
Source district
Number
of married
migrants
Number of
unmarried
migrants
Married (%) Unmarried (%)
Kathmandu 66 34 66 34
Sindhupalchok 71 29 71 29
Makwanpur 71 29 71 29
Total 208 92 69.3 30.7
TABLE 3: MARITAL STATUS OF FIRST TIME LABOR MIGRANTS
12
Age at First Migration:
Table 4 shows that more than two fifths (43%) of labor migrants were between the ages of 18
and 23 years at the time of first migration, followed by the age group of 24-29 years (30.7%), and
lastly those over 29 years (23%). Just over three percent (3.3%) of respondents had gone abroad as
labor migrants before they reached age 18, which is the minimum required age for male migrants.
The restrictions are different for female migrants: at present, government policy does not permit
women under the age of 30 to go abroad for domestic work in the Middle East. However, the present
study reveals that 56.3% (9 out of 16 female migrants) were below 30 years of age at the time
of migration, meaning that they migrated illegally.
Age in years
Current Returnee Per Cent % of age
groupMale Female Male Female Male Female
<18 3 1 3 3 60.0 40.0 3.3
18-23 63 4 60 2 95.3 4.7 43.0
24-29 44 0 45 3 96.7 3.3 30.7
>30 35 0 31 3 95.7 4.3 23.0
Total 145 5 139 11 94.7 5.4 100.0
TABLE 4: AGE AT FIRST TIME MIGRATION
Ethnicity and Education Status of Labor Migrants:
There is a huge difference in education status between male and female migrants. A high proportion
of male labor migrants represented in the study (41.9%) received a secondary education; an additional
19 percent received a higher secondary education. In contrast, only 25% of female migrants received
a secondary education, and 68.8% have a primary level education or less. In total, 59.3% of the
migrant workers surveyed (male and female combined) had secondary education or higher.
Sex
Illiterate
Literate
Primary
Education
Secondary
Education
Higher
Secondary
Education
Total
Male
4
(1.4)
22
(7.7)
85
(29.9)
119
(41.9)
54
(19.0)
284
(100.0)
Female
2
(12.5)
2
(12.5)
7
(43.8)
4
(25.0)
1
(6.2)
16
(100.0)
Total
6
(2.0)
24
(8.0)
92
(30.7)
123
(41.0)
55
(18.3)
300 (100.0)
TABLE 5: STATUS OF LABOR MIGRANTS BY EDUCATION LEVEL
13
High proportions of migrants represented in the study are from both relatively disadvantaged
Janajati communities (39.7%) and the upper caste group (38.3%), followed by relatively advantaged
Janajatis (20.3%). Very few Dalit individuals were found in the sample and, as the survey did not
include a Terai district, few disadvantaged non-Dalit Terai community members were represented
in the study.
Major occupations of labor migrants pre-migration:
Table 7 outlines the occupations of labor migrants represented in the study prior to going abroad.
Approximately one third (30.7%) were engaged in agriculture, followed by service jobs (21.7%),
manual labor (14.3%), and business (8.7%). Of the total respondents, 15.7% were students before
going abroad. Very few respondents (2%) were working in the home prior to migration.
Caste
Uppercaste
Relatively
advantaged
Janjati
ReligiousMinority
Dis-advantaged
Non-DalitTerai
Relatively
Disadvantaged
Janjati
Dalit
Total
38.3 20.3 0.3 0.3 39.7 1.0 100.0
TABLE 6: STATUS OF LABOR MIGRANTS BY ETHNICITY AND CASTE
Occupation prior
to migration
Returnee Migrants
(number and
percent)
Current Migrants
(number and
percent)
Total (combined)
migrants (number
and percent)
Working in the home 2 (1.3) 4 (2.7) 6 (2.4)
Service work (salaried
employment)
35 (23.3) 30 (20.0) 65 (21.7)
Manual labor 21 (14.0) 22 (14.7) 43 (14.3)
Business 13 (8.7) 13 (8.7) 26 (8.7)
Agriculture 49 (32.7) 43 (28.7) 92 (30.7)
Student 17 (11.3) 30 (20.0) 47 (15.7)
Unemployed 1 (7.0) 0 (0.0) 1 (0.3)
Other 12 (8.0) 8 (5.3) 20 (6.7)
Total 150 (100.0) 150 (100.0) 300 (100.0)
TABLE 7: MIGRANT’S OCCUPATIONS PRIOR TO GOING ABROAD
14
4.1.2 Knowledge and practice of the migration process
Labor migration has inherent risks and therefore no process can be considered completely “safe.”
For the purposes of this study, the term “safer migration” is employed, and refers to adherence
to the following three-step process:
1.	 Participation in a pre-departure orientation
2.	 Use of an authorized manpower agency to organize foreign employment
3.	 Departure from a Nepali airport for foreign labor (versus departure from an Indian airport)
Only returnee migrants were asked about their knowledge and practice of the migration process,
as it was determined that current migrants’ household members may not be able to answer all of
the questions in detail. Of the 150 returnee migrants represented in the study, only 9 individuals
had practiced “safer migration” according to the above criteria, as detailed in Table 8:
District
Practiced zero
safer migration
processes
(number and
percent)
Practiced 1
safer migration
process
(number and
percent)
Practiced 2
safer migration
processes
(number and
percent)
Practiced 3
safer migration
processes
(number and
percent)
Kathmandu 4 (8%) 25 (50%) 16 (32%) 5 (10%)
Sindhupalchok 5 (10%) 26 (52%) 18 (36%) 1 (2%)
Makwanpur 3 (6%) 26 (52%) 18 (36%) 3 (6%)
Total 12 (8%) 77 (51.3%) 52 (34.7%) 9 (6%)
TABLE 8: SAFER MIGRATION PRACTICES AMONG RETURNEE MIGRANTS
Despite the very low occurrence of the safer migration practices previous discussed, the overwhelming
majority (92%) of returnee migrants represented in the study had used a legal channel to depart for
foreign labor migration (i.e. a Nepali airport); for the purposes of this study, use of a Nepali airport is
considered one element of practicing “safer migration.” Only 8% of the total migrants surveyed had
used an Indian airport for labor migration. Among the male RM, only 4.5% had used the Indian airport
to go to abroad. However, this percentage is much higher (55%) among female returnee migrants.
It is important to consider the factors and barriers that drive an individual’s decisions within the labor
migration process. For instance, education status is seen to have an impact on labor migration choices.
The data illustrated in Table 9 shows that the higher the level of education achieved by a returnee
migrant, the less likely that migrant is to have used an irregular channel for migration, i.e. an Indian
airport. Among the non-literate returned migrants, the use of an Indian airport is 25% whereas this
percentage decreases among literate migrants, and decreases again among migrants with higher
secondary education and above.
15
Choice of airport is crucial but there are other factors that impact the relatively safety or lack
thereof of the foreign labor migration process. Returnee migrants were therefore asked detailed
questions about the process of labor migration that they had practiced, including participation in
a pre-departure orientation, knowledge of currency in the destination country, medium chosen to
arrange foreign employment, etc. The data illustrated in Table 10 illustrates that of the total 150
returnee migrants, only 19.3% had received the pre-departure training for labor migration. However,
although an overwhelming majority of returnee migrants had not participated in the training,
a significant majority of them reported that they were familiar with the currency of the destination
country (65.3%) and benefits package of their new employer (73.3%). The proportion of pre-departure
orientations received by returnee migrants was found to be relatively higher in Sindhupalchok
(41.4%), followed by Kathmandu (31.0%), and Makwanpur (27.6%). It noteworthy that none of
the 11 female returnee labor migrants had received the pre-departure orientation.
Only 27% of returnee migrants had arranged their migration through authorized channels such as
manpower companies (26.7%) and Government authorities (0.7%). Approximately seven tenths
of the returnee migrants had used am unauthorized channel such as relatives, friends, or neighbors
(28.7%) and private agents (44.0%). This means that, regardless of other decisions, the majority
of returnee migrants represented in the study had not practiced a safer form of migration.
Education status
Airport used by RM - % (150 total)
Nepal India Total
Illiterate 75.0 25.0 100.0
Literate but has not attended school 86.7 13.3 100.0
Primary education 89.8 10.2 100.0
Secondary education 94.7 5.3 100.0
Higher secondary and above 96.0 4.0 100.0
Total 92.0 8.0 100.0
Social Group
Airport used by RM - % (150 total)
Nepal India Total
Upper caste groups 93.1 6.9 100.0
Relatively advantages Janajati 96.0 4.0 100.0
Religious minorities 100.0 0.0 100.0
Disadvantaged non-Dalit Terai caste groups 100.0 0.0 100.0
Relatively disadvantaged Janajati 89.2 10.8 100.0
Total 92.0 8.0 100.0
TABLE 9: AIRPORT USED BY RETURNEE MIGRANTS FOR LABOR MIGRATION
In addition to education, caste and ethnic background can also impact labor migration decisions.
The data about the use of airports among different social castes reveals that approximately 11%
of relatively disadvantaged Janajati individuals had used an Indian airport to go to a third country
for labor migration, followed by more socially advantaged upper caste migrants (6.9%), and
relatively advantaged Janajati (4%). Use of an Indian airport by a higher percentage of relatively
disadvantaged Janajati reflects the prevalence of unsafe international labor migration among
this group.
16
District
Totalnumberofreturneemigrants
ReceivedPre-departureorientation
Knowledgeofthecurrency
ofdestinationcountry
Medium chosen for
arranging Foreign
Employment
Knowledgeofbenefitsofemployer
Relatives,friend,or
neighbor
PrivateAgent
ManpowerCompany
Government
Home District and its relation to the Migration Process - % (150 RM)
Kathmandu 50 18.0 66.0 32.0 34.0 32.0 2.0 74.0
Sindhupalchok 50 24.0 64.0 28.0 56.0 16.0 0.0 70.0
Makwanpur 50 16.0 66.0 26.0 42.0 32.0 0.0 76.0
Total Percentage 19.3 65.3 28.7 44.0 26.7 0.7 73.3
Education Status and its relation to the Migration Process - % (150 RM)
Illiterate 4 0.0 0.0 50.0 50.0 0.0 0.0 0.0
Literate 15 6.7 46.7 33.3 40.0 26.7 0.0 33.3
Primary ed. 49 18.4 63.3 34.7 38.8 26.5 0.0 71.4
Secondary ed. 57 24.6 71.9 21.1 52.6 26.3 0.0 82.5
Higher secondary ed. and beyond 25 20.0 76.0 28.0 36.0 32.0 4.0 92.0
Total percentage 19.3 65.3 28.7 44.0 26.7 0.7 73.3
Prep-departure orientation and its relation to the Migration Process - % (150 RM)
Received orientation 19.3 89.7 10.3 58.6 27.6 3.4 93.1
Did not receive orientation 80.7 59.5 33.1 40.5 26.4 0.0 68.6
Total percentage 65.3 28.7 44.0 26.7 0.7 73.3
TABLE 10: MIGRATION PRACTICES IN RELATION TO HOME DISTRICT, EDUCATION,
AND RECEIPT OF PRE-DEPARTURE ORIENTATION
17
As illustrated by Table 10, an individual’s education level has a significant impact on his or her
chosen process of migration. The cross tabbed data between several variables related to the
process of migration and the education level of returnee migrants is provided in the Table 10.
The data shows that the higher the level of education a returnee migrant possesses, the more likely
he or she is to have received the pre-departure training, and to possess knowledge on the currency
of the destination country and benefits provided by the hiring company. Further, it is also found that
those with levels of education are less likely to have gone abroad via an Indian airport (an irregular or
unsafe migration practice). The table also illustrates that while an overall high proportion of returnee
migrants used unauthorized channels to go abroad, 100% of non-literate migrants (4 out of 4) used
an unauthorized channel. Similarly, all four non-literate returnee migrants had not participated in
pre-departure orientations and were unaware of the currency of the destination country or benefits
package of their new company.
Pre-departure Orientation was found to have a significant impact on the process of labor migration
that was practiced by returnee migrants. Among the 29 returnee migrants who received pre-
departure orientation, 90% were aware of the currency in the destination country, while only
59.5% of non-oriented migrants possessed this knowledge. Therefore, over 40% of returnee migrants
(those who were not aware of the currency in the destination country) did not practice informed
decision-making at the time of migration. Those who received the orientation were also significantly
more likely to have knowledge about the benefits package offered by their employer in comparison
with those who did not receive the orientation. Among the pre-departure orientation receivers, 93.1%
were aware of the perks and benefits of the employer, while only 68.6% of those who had not received
the orientation possessed this knowledge.
Pre-departure orientation has therefore been shown to have some impact on the migration decisions
of migrants. However, although pre-departure orientation receivers were much more likely to use
an authorized channel of migration when compared with those who did not receive the orientation,
an overall high percentage of migrants surveyed (68.9%) used an unauthorized (unsafe) channel to
go abroad for foreign labor migration. Therefore, the data strongly implicates that the formal process
meant to be undertaken by labor migrants, including pre-departure orientation, does serve a purpose
but is not sufficient for preventing the risk of trafficking and exploitation for migrants.
Table 11 shows that 64% of returnee migrants (96 out of 150) had paid over 80,000 Nepalese
rupees as a service charge for foreign employment, which includes the costs of passport issuing,
pre-departure orientation, processing fee of the manpower company, visa processing, aircraft ticket,
a health check-up, insurance and other costs. This is a significant finding as the FEPB of the GoN
has stipulated a ceiling of NRs. 80,000 for the process of labor migration, and this amount is valid
for migrants going to Malaysia only. There is a lower ceiling of NRs. 70,000 for labor migrants going
to Gulf countries including UAE, Saudi Arabia, Bahrain, Kuwait and Oman, whereas the ceiling
for Qatar is even lower, at NRs. 20,000.
18
The figure demonstrates that pre-departure orientation has little impact on the amount that migrants
spend on the migration process. Approximately 40% of returnee migrants who had not participated
in pre-departure orientation paid less than the ceiling amount of 80,000 NRs. whereas only 21%
among those who had taken pre-departure orientation paid less than the stipulated maximum.
The program therefore does not appear to support migrants to reduce the cost of migration; this may
be due to the fact that many migrants have already incurred the costs of migration before attending
the orientation.
Sex is another factor in predicting the cost of migration. Only 32% of male returnee migrants had
spent less than the ceiling cost on the migration process whereas a very high proportion of female
returnee migrants had paid less than the ceiling (90.9%). This illustrates the fact that manpower
agents and employers are more willing to meet the migration costs for female workers than for male
workers; while on the surface this appears to be a benefit to female migrants, it can make them much
more vulnerable to exploitation and may in fact be a reflection of human traffickers’ investments in
transporting female victims.
Variables
Up to
80,000
>80,000-
120,000
>120,000
to
160,000
>160,000 Total
Pre-departure Orientation
Attended (%) 20.7 55.2 17.2 6.9 100.0
Did not attend (%) 39.7 45.5 12.4 2.5 100.0
Total Percentage 36.0 47.3 13.3 3.3 100.0
Sex
Male (%) 31.7 50.4 14.4 3.6 100.0
Female (%) 90.9 9.1 0.0 0.0 100.0
Total Percentage 36.0 47.3 13.3 3.3 100.0
Airport Used
Nepal (%) 34.8 47.8 13.8 3.6 100.0
India (%) 50.0 41.7 8.3 0.0 100.0
Total Percentage 36.0 47.3 13.3 3.3 100.0
Medium of Arranging Foreign Employment and Migration
Relatives, Friends, or Neighbors (%) 48.8 41.9 4.7 4.7 100.0
Agent (%) 39.4 48.5 10.6 1.5 100.0
Manpower (%) 17.5 52.5 27.5 2.5 100.0
Government (%) 0.0 0.0 0.0 100.0 100.0
Total Percentage 36.0 47.3 13.3 3.3 100.0
TABLE 11: MIGRATION EXPENSES AMONG RETURNEE MIGRANTS
19
The method chosen for labor migration also impacts the cost. For instance, approximately 50%
of returnee migrants who had used an Indian airport to go to a third country for foreign employment
had paid more than the ceiling amount stipulated by the GoN. This is a surprising and important
finding as migrants often opt to go abroad via India as it is commonly understood to be the less
expensive option.
Among the returnee migrants who had consulted with relatives, friends, or neighbors about labor
migration, 48.8% of them had paid less than the ceiling amount of NRs. 80,000 whereas this
percentage is much lower for migrants who went abroad through an agent (39.4%), followed by
those who utilized manpower companies (17.5%). This may suggest that workers with good sources
of information from their friend and relative networks are better informed than those relying on
manpower agents and more able to negotiate lower migration costs. However, despite the lower
costs paid by some migrants, the study did not compare the rate of occurrence of exploitation
between those who went abroad with the assistance of friends or neighbors and those who used
a manpower agency, nor did it compare use of an authorized versus unauthorized manpower agency.
For instance, some migrants paid less for migration costs but may have found themselves deceived in
the process. The finding is therefore speculative and warrants further study.
Clearly, foreign labor migration is an expensive endeavor for the majority of Nepali migrant workers.
Figure 1 illustrates that the source of funds utilized by all respondents (both RM and CM) during
the process of migration. The data reveals that 72% of labor migrants had taken formal loans for
the process of migration, followed by utilizing household savings (20.0%), borrowing from personal
sources (18.7%), and utilizing personal savings (9.3%). Among the total respondents, a very small
number had also raised the funds by selling ornaments or property; several had their costs covered by
hiring companies; and several utilized other unspecified sources. A small number of study participants
(1.0%) did not respond to the question.
FIGURE 1: SOURCE OF FUNDING FOR THE PROCESS OF LABOR MIGRATION
Of the total 300 labor migrants, only 253 migrants or their households chose to disclose the source of
funding used for foreign labor migration costs. All 253 said that they had acquired the money either
through formal loans or from borrowing from friends, relatives, or neighbors, or a combination of both
sources. Among them, 86.9% had borrowed money from friends, relatives, or neighbors followed by
income generated from Savings and Credit organizations (11.9%), income generated through savings
groups (7.1%), loans taken from banks (4.8%), and other sources. This data shows that most of the
migrants depend on high interest loans from individuals rather than services provided by financial
institutions or the Government. Respondents reported paying minimum annual interest rates on loans
from 5% all the way up to 36%.
20
Source of loan Number of respondents Percent
Bank 10 4.8
Friends, Relatives, and Neighbors 207 86.9
Savings or Finance Company 42 11.9
Savings Group 9 7.1
Money lender 4 2.4
Total 253 100
TABLE 12: SOURCE OF FORMAL LOANS AND BORROWED MONEY TO FUND THE
MIGRATION PROCESS
Destination
Countries
Kathmandu Sindhupalchok Makwanpur Total Percent
Malaysia 35 21 21 77 25.7
Saudi Arabia 12 38 21 71 23.7
Qatar 15 13 38 66 22.0
Dubai (UAE) 23 8 10 41 13.7
Kuwait 5 17 1 23 7.7
Bahrain 1 1 4 6 2.0
Oman 2 2 1 5 1.7
Korea 4 0 1 5 1.7
Iraq 1 0 1 2 0.7
Other 2 0 1 3 1.0
Total 100 100 100 300 100
TABLE 13: TOP TEN DESTINATION COUNTRIES FOR FOREIGN LABOR MIGRATION
As mentioned previously, the level of funding required for foreign labor may depend partially on the
destination country. Table 13 depicts the top ten destination countries for the migrants represented
in the present study.
The data shows that countries located in the Middle East are the primary destinations for foreign
labor migration. However, Malaysia (located in South East Asia) has become the largest labor-
receiving country overall for the migrants represented in the study, followed by Saudi Arabia,
and Qatar. A quarter (25.7%) of migrants in studied HHs had chosen Malaysia for foreign
employment. Saudi Arabia (23.7%), Qatar (22.0%), UAE (13.7%), and Kuwait (7.7%) ranked 2nd
,
3rd
, 4th
and 5th
, respectively. For migrants from Kathmandu, Malaysia, UAE and Qatar were the
top three most preferred destinations whereas Saudi Arabia, Malaysia and Kuwait were the top three
destinations for Sindhupalchok district, and Qatar, Malaysia and Saudi Arabia were the top three
destinations for those from Makwanpur district.
21
Selection of destination countries for labor migration differs between male and female migrants.
Kuwait (62.5%) has become the top destination country for female migrants followed by Malaysia
(12.5%), Qatar (12.5%), and Saudi Arabia (12.5%) whereas for make migrants Malaysia (26.4%)
is the top destination, followed by Saudi Arabia (24.3%), Qatar (22.5%) and Dubai (14.4%). These
differences are largely due to destination country labor demands: while Malaysia is seeking manual
laborers, Kuwait is seeking domestic workers and housemaids, and therefore provides free airfare for
female migrants.
Destination Country
Sex of Migrant
Male Female Total
Malasiya
75 2 77
26.40% 12.50% 25.70%
Korea
5 0 5
1.80% 0.00% 1.70%
Iraq
2 0 2
0.70% 0.00% 0.70%
Afganistan
1 0 1
0.40% 0.00% 0.30%
Others
3 0 3
1.10% 0.00% 1.00%
Baharaain
6 0 6
2.10% 0.00% 2.00%
Kuwait
13 10 23
4.60% 62.50% 7.70%
Oman
5 0 5
1.80% 0.00% 1.70%
Quatar
64 2 66
22.50% 12.50% 22.00%
Dubahi
41 0 41
14.40% 0.00% 13.70%
Saudi Arabia
69 2 71
24.30% 12.50% 23.70%
Total
284 16 300
100.00% 100.00% 100.00%
TABLE 14: DESTINATION COUNTRIES OF LABOR MIGRANTS BY SEX
Nepali migrant workers go abroad to do a range of different jobs; the type of work is sometimes
determined by the destination country and the sex of the migrant worker, as illustrated above.
Figure 2 outlines the primary occupations of the migrants represented in this study during their stints
as foreign workers.
22
Figure 2 illustrates that manual labor is the leading type of work for migrants in destination countries
(36.0%), followed by agriculture or livestock work (19.0%), driving (13.7%), hotel jobs (13.3%), security
guard jobs (9.3%) and housemaid or domestic labor jobs (8.0%).
Job Type
TotalNumber
<10,000NRs.
10to<15,000NRs.
15to<20,000NRs.
20to25,000NRs.
>25,000NRs.
HHmemberdoes
notknowmigrant’s
salary
Total
Driver 41 0.0 2.4 12.2 12.2 68.3 4.9 100.0
Security Guard 28 0.0 3.6 10.7 10.7 71.4 3.6 100.0
Manual laborer 108 1.9 9.3 10.2 13.0 62.0 3.7 100.0
Housemaid 24 4.2 29.2 20.8 16.7 29.2 0.0 100.0
Hotel 40 0.0 10.0 10.0 12.5 50.0 17.5 100.0
Agriculture or
Livestock worker
57 0.0 7.0 15.8 17.5 54.4 5.3 100.0
Other 1 0.0 0.0 0.0 0.0 100.0 0.0 100.0
HH member
does not know
migrant’s
occupation
1 0.0 0.0 0.0 0.0 0.0 100.0 100.0
Total 300 1.0 9.0 12.3 13.7 58.0 6.0 100.0
TABLE 15: MIGRANTS’ OCCUPATIONS WITH LATEST MONTHLY INCOME LEVEL:
FIGURE 2: MAJOR OCCUPATIONS OF MIGRANTS IN DESTINATION COUNTRIES
23
Fifty eight percent of both returnee and current migrants had received over 25,000 NRs as their
current or last monthly income. Of the total 28 security guards, 71.4% had received a monthly salary
over 25,000, followed by drivers (68.3% among 41); construction and factory laborers (62.0% among
108), agriculture/livestock workers (54.4% among 57) and hotel staff (50.0% among 40). Though
a high proportion of migrants were involved in manual labor (particularly construction) in destination
countries, security guard was found to be the highest paid position for migrants, followed by driving
and construction work.
No. of years Returnee migrant (%) Current migrant (%) % in Total
<2 years 1.3 0.7 1.0
2-4 years 46.7 51.3 49.0
5-6 years 34.7 27.3 31.0
7-8 years 12.7 12.7 12.7
9-10 years 3.3 5.30 4.3
10 years & above 1.3 2.7 2.0
Total 100.0 100.0 100
TABLE 16: TIME SPENT ABROAD BY LABOR MIGRANTS33
33
The present study represented current migrants (as reported on by their household members in Nepal) and Table 15
therefore includes current migrants’ years spent abroad thus far
Approximately 50% of labor migrants stayed abroad for 2-4 years, followed by 31% who were
abroad for 5-6 years. The trend of the length of stay abroad for both RM and CM is similar. About
half (46.7%) of returnee migrants had stayed abroad for 2-4 years followed by 5-6 years (31.0%).
In total, 19% of labor migrants had spent (or were in the process of spending, in the case of current
migrants) 7 or more years abroad. Very few labor migrants (1.0%) had stayed abroad for less than
2 years. Four fifths (80%) of labor migrants had spent 2 to 6 years abroad.
4.1.3: Earning, saving, and remittance-sending behaviors of returnee labor migrants
In this section the earning, saving, and remittance-sending behaviors of returnee migrants only are
analyzed; data on current migrants’ practices was not collected.
Figure 3 shows the salary history range of returnee migrants according to their original employment
contract, at the starting month of employment, and at the last month of employment for 150 returnee
migrants. Approximately one fourth of returnee migrants had signed contracts for 10,000 Nepali
rupees per month or less. 60% of migrant had signed contracts for a monthly salary ranging from NRs
10,001 to NRs. 20,000. Ten percent of them had contracts for a monthly salary of NRs. 20,001 – NRs.
30,000. Only 4% of migrants had signed contracts for a monthly salary higher than NRs. 30,000.
24
As Figure 3 illustrates, not all returnee migrants received the salary that was provided in the original
contract during their first month of employment. Interestingly, some migrants benefitted from this
scenario rather than suffered, with larger percentages earning NRs. 20,001 – 30,000 and NRs. 30,000
and above than anticipated according to contracts. As one would expect, migrants’ salaries at the last
month of employment had increased, with only 2.7 percent earning Nrs. 10,000 or less and over 44
percent earning 30,000 and above.
The first two combined bar graphs shown in Figure 3 reveal that migrant workers at the higher
end of the salary scale (earning NRs. 20,001 and above) at the time of contract increased their initial
salaries at the first month of employment, and then again at the end of their employment. They have
therefore progressively moved into higher salary brackets; although this could be a result of currency
changes or other factors, further study is required in order to determine why migrants’ salary during
their first month of employment often exceeded the salary agreed upon in the contract.
The increase in the proportion of returnee migrants at the higher end of the salary range is due
to the routine annual increase of workers’ basic salaries, causing shifts from one salary range
to another throughout their stay abroad. While the majority of migrants were in the NRs. 10,000 -
20,000 range at the start of their foreign employment, the largest percent (44%) was earning NRs.
30,000 per month or more upon the completion of the contract.
Table 17 illustrates that more than two fifths (41.7%) of labor migrants had sent remittances up
to NRs. 500,000 throughout their period abroad, followed by 28% of labor migrants who had sent
between Nrs. 500,001 and 1,000,000; 13.3% who had sent between NRs. 1,000,001 and 1,500,000;
5% who had sent 1,500,001 to 2,000,000; and 5.7% who had sent more than NRs. 2,000,000. 6.3% of
participants chose not to report the money that they had remitted.
In total, NRs. 248,585,000 of remittance money was sent by 281 respondents throughout their stay
abroad (or up until the present, for CM). Nineteen respondents (13 RM and 6 CM) did not respond
to the question. Of those who did response, the average person had remitted approximately NRs.
884,644 throughout their working period (or this far, for CM). Among the total 281 participants
who reported the volume of their remittances, the top 10% (28 out of 281) migrants had sent
a total of NRs. 63,200,000, which is 25.4% of the total received remittance from all 281 migrants.
FIGURE 3: SALARY COMPARISON (ORIGINAL CONTRACT, FIRST MONTH
OF EMPLOYMENT, AND LAST MONTH OF EMPLOYMENT)
25
District
<500,001
500,001-
1,000,000
1,000,001-
1,500,000
1,500,001-
2,000,000
2,000,000>
Notreported
Total
Kathmandu 43.0 23.0 7.0 6.0 10.0 11.0 100.0
Sindhupalchok 41.0 34.0 13.0 4.0 3.0 5.0 100.0
Makwanpur 41.0 27.0 20.025 5.0 4.0 3.0 100.0
Percent 41.7 28.0 13.3 5.0 5.7 6.3 100.0
TABLE 17: FUNDS REMITTED BY LABOR MIGRANTS THROUGHOUT THEIR PERIOD ABROAD
FIGURE 4: MEDIUM SELECTED FOR SENDING REMITTANCES
The data further illustrates that the 12 returnee migrants who chose irregular channels of migration
(Indian airports) have earned on average NRs. 814,167 during their stay abroad, which is less than the
average of NRs. 867,040 remitted by returnee migrants who used the authorized channel (via Nepal’s
airport). This is largely due to the fact that those who go abroad via unauthorized channels are often
promised salaries by brokers that do not reflect reality while migrants utilizing authorized channels
usually earn a salary that is closer to the amount that was initially offered.
Of the total 300 labor migrants who participated in the study, 261 reported that they sent or
brought goods from the country of work back to Nepal. Among them, 10 did not name the value
of the goods. The remaining 251 returnee migrants reported an average value of goods of NRs. 94,610
per migrant.
26
The survey data collected from 300 migrants or, in the case of current migrants, migrants’
households, shows that 100% of participating migrants sent remittances to Nepal during their
working period abroad. Of the total 300 labor migrants, 71.3% had sent remittance through IME
or Prabhu, while the majority of the remaining migrants had used banks to remit funds (23.7%).
Due to the trustworthy nature of the services provided by formal institutions, an overwhelming
majority (94%) had chosen official channels to send their remittances. Despite many migrants
having practiced irregular or unsafe migration, this finding illustrates that migrants possess
a sound understanding of regular (and therefore safer) money transfer options and are utilizing
them accordingly.
4.1.4 Uses of Remittances:
Figure 5 presents multiple responses of all 300 labor migrants regarding the use of remittances
in the country of origin; respondents were permitted to provide as many responses as necessary,
as the study recognizes that remittances are used for a wide range of purposes within a single
household. Figure 5 shows that approximately four-fifths (79.7%) of labor migrants utilized their
remittances to pay back loans, followed by the purchase of household appliances (77.7%), investments
in education (67.7%), and investments in health and nutrition (57.3%). Further, around half of the
respondents said that they utilized the remittances to pay for daily household expenses (48.0%) and
for national festival costs (46.7%). One third of the respondents said that they utilized the remittance
money to repair their houses, and approximately one-fourth of the respondents said that they utilized
the remittances to buy land or a house (26.0%). One quarter (24.0%) saved the remittance money in
a finance group or institution. Only 13.3% of respondents said that the money has been invested in a
business. However 24% have put money in to savings some of which may be invested in businesses
on their return to Nepal. Approximately one third of respondents (29.3%) said that they had used
utilized the remittance for various social events such as marriages, name keeping ceremonies, and
rice feeding ceremonies.
The graph clearly illustrates that remittances are utilized far more often to repay loans (79.7%) than
to invest in productive sectors such as businesses (13.3%) or saving in finance groups or institutions
(24.0%). This is a troubling trend given the large sums of money that aspiring migrants and their
families take out in loans and borrow through informal networks in order to make foreign labor
migration possible.
FIGURE 5: USE OF REMITTANCES SENT BY MIGRANTS
27
During Focus Group Discussion in Sanosirubari, Sindhupalchok, participants said that they have
been using the remittance money primaily for household expenses but that they have also been
buying luxury goods, including motorcycles, televisions, mobile phone sets, etc. In addition, they
have invested in education, health, and house construction and repairs. However, they also said
that due to the increasing trend of rural-to-urban internal migration, remittance funds have not greatly
impacted the development of villages; rather than investing funds in rural village areas, remittance-
receiving families are moving to larger urban centers and investing their money there.
4.1.5 Use of remittances in business development/investment (productive sectors)
Figure 6 clearly shows that out of 40 migrants’ households (combined RM and CM) who
had invested remittance money in businesses, 52.5% had invested in grocery shops, followed
by livestock-raising (15.0%), agriculture (12.5%), and beauty parlors and tailoring businesses
(7.5% each). The remaining 18% of migrants’ households who had used remittances for business
purposes had invested in other types of businesses than those named previously. It can therefore
be concluded that when remittance-receiving households do invest in business ventures, they
are focused on increasing the family income through small business activities rather than promoting
entrepreneurship via large scale businesses.
Participants who did not invest remittance monies in business development were asked their
reasons for not doing so; respondents were able to provide multiple responses, as illustrated
in Table 19.
FIGURE 6: TYPES OF BUSINESSES RUN BY BOTH RM AND CM BY UTILIZING REMITTANCE
28
Reasons for not investing in businesses
Returnee and Current Migrants
RM CM Total
Remittances were used for paying loans
4 13 17
3.30% 9.50% 6.50%
Remittances were used for household expenses
8 5 13
6.50% 3.60% 5.00%
Lack of human resources within the household
20 42 62
16.30% 30.70% 23.80%
Remittances were used for purchasing land or a
vehicle, or for home construction or repairs.
8 13 21
6.50% 9.50% 8.10%
Household members were otherwise occupied by
household chores, childcare, agriculture
17 31 48
13.80% 22.60% 18.50%
Lacking knowledge, skills, or experience for business
management; fear of loss; lack of market knowledge
24 26 50
19.50% 19.00% 19.20%
Insufficient funds for investment
47 28 75
38.20% 20.40% 28.80%
No response
4 6 10
3.30% 4.40% 3.80%
Lack of space or overabundance of shops in the village
3 8 11
2.40% 5.80% 4.20%
Illiteracy
3 7 10
2.40% 5.10% 3.80%
Remittances were used for investing in education
5 3 8
4.10% 2.20% 3.10%
Remittances were used for medical expenses
4 4 8
3.30% 2.90% 3.10%
Migrant just returned or was thinking of going abroad;
household has not yet decided
8 0 8
6.50% 0.00% 3.10%
No interest in business development
11 6 17
8.90% 4.40% 6.50%
Total 123 137 260
TABLE 19: REASONS FOR NOT INVESTING REMITTANCES IN BUSINESS DEVELOPMENT
29
Out of 300 total migrants’ households, the vast majority (260 households) had not invested remittance
in business development. The multiple response analysis of data from these 260 households illustrates
that the most common reason for not doing business is insufficient funds (28.80%) followed by lack of
human resources within the household (23.8%), lack of knowledge, skills, or experiences, fear of loss,
and lack of understanding of the market (19.2%) and being occupied with household chores, care of
children, or engagement in agriculture (18.5%).
The reasons for not investing in business differ greatly between current migrants’ and returnee
migrants’ households. Though only 20.4% of 137 current migrants said that insufficient funds were
the cause for not doing business, this percentage nearly doubles (38.2%) among returnee migrants,
implying greater access (or perception of greater access) of funds in current migrants’ households.
Conversely, around 16% of 123 returnee migrants stated a lack of necessary human resources within
the individual’s house as the main reason for not doing business, but this percentage doubles among
current migrants, almost certainly because one of the HH’s potential workers is currently abroad.
Though only 3.3% of returnee migrants participating in the study said they were using remittance
monies to pay back loans, this was found to be three times more common (9.5%) among the responding
households with a current migrant family member at the time of the study.
4.1.6 Impacts of remittances on living conditions of migrants and the sending household
Foreign employment has significant impacts on the living conditions of migrant workers and their
families. Table 20 illustrates the improvement in physical facilities and infrastructure of returnee
and current migrants’ households. The data shows that among both type of families of migrants,
4% increased their use of electricity from 95% before foreign employment to 99% after foreign
employment. Similarly, 11% increased the cement roofing on their houses, and there was a 1.3%
increase in tile or tin roofing on houses. Likewise, there was a decrease of thatch or straw roofs by
13%. Further, use of cement flooring has increased to 29% from 11%, which is due to the reduction
in the use of mud floors by migrants’ families from 87.3% to 67.7%. Prior to a family member going
abroad, 17% of respondents used river or pond water for drinking and cooking but this decreased to
7.7% after foreign employment. There is therefore a change in use of piped water, 81.0% before going
abroad to 90.7% after involvement in foreign employment.
As illustrated in Table 20, the time used to fetch potable water has also been decreased after the
respondents’ involvement in foreign employment. This is due to the increase in the availability of
piped water to the homes of respondents. Further, the use of modern cooking fuels has drastically
increased; use of Liquid Petroleum Gas (LPG) and Bio-gas are now more common than firewood and
animal dung among the households of the migrants.
30
Type of facilities
Responses of RM and CM % of RM and CM
No. of
responses
before
No. of responses
present
% before % present
Electricity 285 297 95.0 99.0
Roof of house
Thatch/Straw 42 4 14.0 1.3
Tile/Tin 230 234 76.7 78.0
Cemented 20 53 6.7 17.7
Stone 8 9 2.7 3.0
Main material of the floor
Natural floor (mud) 262 203 87.3 67.7
Wooden 3 5 1.0 1.7
Cemented 32 88 10.70 29.3
Stone 3 4 1.0 1.3
Source of drinking water
River or pond 51 23 17.0 7.7
Well water 6 5 2.0 1.7
Piped water 243 272 81.0 90.7
Average time to fetch drinking water from source
Water source in home 63 108 21.0 36.0
Less than 15 minutes 181 167 60.3 55.7
15 minutes to half hour 36 18 12.0 6.0
More than half hour 20 7 76.7 2.3
Availability of toilet in home
Toilet facility in home 235 287 88.3 95.7
Type of fuel household uses for cooking
Firewood 279 227 93.6 75.7
Dry dung 2 0 0.7 0.0
Bio-gas 16 36 5.4 12.0
LPG 23 139 7.7 46.3
Kerosene Stove 6 8 2.0 2.7
TABLE 20: IMPACT OF REMITTANCE OF IMPROVING PHYSICAL FACILITIES
OF MIGRANT’S HHS
31
FIGURE 7: COMMUNICATION MEANS AND HOUSEHOLD APPLIANCES AT HOUSEHOLD
LEVEL BEFORE AND AFTER FOREIGN EMPLOYMENT
A drastic change has been observed in regard to migrants’ households’ access to computers from
3.3% to 22.7%. Similarly, use of and access to cameras increased from 11.7% to 38.3% and cable
dishes in the home increased from 27.7% to 65.3%. Finally, there is also a significant increase in
the use of mobile phones (51.4%) and televisions (31.3%) by the family members of labor migrants.
The bar graph shows that significant changes have been observed in the availability of other
appliances such as invertors or solar panels, freezers, telephones, and televisions. Use of radios,
which many migrants’ households had access to prior to migration, decreased as they were
replaced with televisions and computers. Despite the conveniences afforded by access to these items,
according to the focus group discussions, use of remittances for purchasing household appliances and
other luxury goods has been leading towards a more sedentary lifestyle among migrants’ families,
which is a potential negative impact of remittances.
FIGURE 8: COMPARISON OF MONTHLY INCOME OF HOUSEHOLDS BEFORE AND AFTER
FOREIGN EMPLOYMENT
4.1.7 Income Mobility
The bar graph plotted in Figure 8 shows that household incomes of both returnee and current
migrants have increased drastically after a family member earned a salary abroad. Returnee
migrants report incomes that are three times higher than before they went abroad. The incomes
of current migrants are more than four times higher after their involvement in foreign employment,
this indicating that individuals earn higher salaries while they are working abroad than after they
return to Nepal
32
Household
chores
% of Response before FE % of Response after FE
Respond-ent
Spouse
Otherfemalemember
Othermalemember
Total
Respondent
Spouse
Otherfemalemember
Othermalemember
Total
Cooking 4.7 47.3 47.7 0.3 100.0 0.3 53.7 44.7 1.3 100.0
Washing
dishes
3.7 52.0 43.3 1.0 100.0 1.0 58.0 40.0 1.0 100.0
Washing
clothes
4.3 50.7 44.3 0.7 100.0 0.7 59.3 39.0 1.0 100.0
Cleaning
house
4.0 49.3 45.0 1.7 100.0 0.7 58.0 40.0 1.3 100.0
Total
responses
50 598 541 11 1200 8 687 491 14 1200
Total % 4.2 49.8 45.1 0.9 100.0 0.7 57.3 40.9 1.2 100.0
TABLE 21: INVOLVEMENT OF MIGRANTS’ HH MEMBERS IN HH CHORES
BEFORE AND AFTER IN FE
Table 22 shows that the responsibility among migrants’ HH members to care for children, the ill,
and the elderly has shifted after the family’s involvement in foreign employment. The figure illus-
trates that there has been an increase in the workload of the migrant’s spouse (46.1% to 58.3%) from
before to after their spouse went abroad. The increase in responsibility for those activities is due
to the decrease in proportion of workload among the respondents (migrants) from 10.4% to 3.3%.
4.1.8 Impact of remittance on the formation of socio-economic and human capital
The present study hypothesizes that the inflow of remittance monies into Nepal has an effect beyond
increasing spending power, and this study sought to understand how remittance impacts families in
terms of distribution of labor, fiscal responsibilities, decision-making patterns, and so on.
Table 21 illustrates the workload distribution (household chores) among family members from
before and after the family’s involvement in foreign employment. The data reveals an increase in
the workload (broken into various tasks) of the spouses of migrants from 49.8% to 57.3%. Based
on these findings it is concluded that foreign employment has created additional responsibilities
for migrant workers’ family members.
For Tables 21 through 25, “Respondent” refers to the Household Heads of current and returnee
migrants. For some households of returnee migrants, the Household Head is the returnee migrant him
or herself; in the case of current migrants’ households, the Household Head is another member of the
household.
33
Child and
family care
% of Response before FE % of Response after FE
Respondent
Spouse
Otherfemalemember
Othermalemember
Total
Respondent
Spouse
Otherfemalemember
Othermalemember
Total
Taking care
of children
6.9 52.6 30.0 10.5 10.0 2.0 62.5 28.1 7.4 100.0
Taking
children to
school
7.8 53.6 31.3 7.3 100.0 1.5 67.0 26.1 5.4 100.0
Taking care
of ill persons
13.4 37.7 30.8 18.2 100.0 4.5 51.6 28.0 15.9 100.0
Taking care
of elderly
persons
13.1 42.6 26.7 17.6 100.0 5.3 53.3 23.7 17.8 100.0
Total
responses
94 418 271 124 907 30 353 246 106 917
Percent 10.4 46.1 29.9 13.7 100.0 3.3 58.3 26.8 11.6 100.0
TABLE 22: RESPONSIBILITIES AMONG HOUSEHOLD MEMBERS FOR CHILD AND FAMILY
CARE
Financial
transactions
% of Response before FE % of Response after FE
Respondent
Spouse
Otherfemale
member
Othermale
member
Total
Respondent
Spouse
Otherfemale
member
Othermale
member
Total
Shopping
Marketing
27.8 19.7 18.4 34.1 100.0 5.7 46.2 19.7 28.4 100.0
Paying bills 33.2 16.8 13.4 36.6 100.0 6.4 45.6 14.8 33.2 100.0
Attending
banks/
Cooperatives
31.9 18.8 12.8 36.5 100.0 8.2 45.6 14.3 32.0 100.0
Other financial
matters
34.3 15.7 11.0 39.0 100.0 10.7 43.7 12.3 33.3 100.0
Total responses 375 209 164 431 1179 92 539 182 378 1191
Percent 31.8 17.7 13.9 36.6 100.0 7.7 45.3 15.3 31.7 100.0
TABLE 23: DIVISION OF FINANCIAL RESPONSIBILITIES AMONG MIGRANTS’ HOUSEHOLD
MEMBERS
34
Table 23 deals with the division of labor related to financial transactions among the family
members of migrants. Before involvement in foreign employment, 32% of respondents (migrants)
said that they had taken responsibility for finance related work. This was decreased to 7.7% after
involvement in FE as most are abroad. There is also an increase in the proportion of workload for
the spouse from 18% to 45% (27% increases). However, the rest of the members of the family
have similar responsibilities before and after of FE.
Community
Work
% of Response before FE % of Response after FE
Respondent
Spouse
Otherfemale
member
Othermale
member
Total
Respondent
Spouse
Otherfemale
member
Othermale
member
Total
Totalresponses 81 53 43 104 281 21 122 46 94 283
Percent 28.8 18.9 15.3 37.0 100.0 7.4 43.1 16.3 33.2 100.0
TABLE 24: INVOLVEMENT OF MIGRANTS’ HH MEMBERS IN COMMUNITY WORK
Areas of
Decisions
regarding:
% of Response before FE % of Response after FE
Respond-ent
Spouse
Otherfemale
member
Othermale
member
Total
Self
Spouse
Otherfemale
member
Othermale
member
Total
Food (%) 27.3 21.7 19.3 31.7 100.0 5.7 47.8 17.1 29.4 100.0
Clothing (%) 27.0 24.0 16.7 32.3 100.0 6.0 49.8 16.1 28.1 100.0
Education for
Children (%)
32.5 22.4 14.9 30.2 100.0 6.7 53.9 14.2 25.1 100.0
Health care
(%)
28.2 22.5 17.4 31.9 100.0 6.4 48.2 17.1 28.4 100.0
Property (%) 34.2 10.4 9.1 46.3 100.0 11.4 37.7 10.1 40.7 100.0
Investments
(%)
34.8 13.1 9.0 43.1 100.0 12.5 39.8 10.4 37.4 100.0
Festivals (%) 26.0 19.7 20.0 34.3 100.0 6.3 44.3 19.7 29.7 100.0
Employment
(%)
45.5 11.9 6.6 36.0 100.0 15.0 39.8 8.0 37.2 100.0
Marriage (%) 27.3 9.2 16.8 46.6 100.0 9.1 34.2 16.9 39.8 100.0
Total
responses
806 445 370 944 2565 223 1128 368 836 2555
Percent 31.4 17.3 14.4 36.8 100.0 8.7 44.1 14.4 32.7 100.0
TABLE 25: DECISION MAKING RESPONSIBILITIES AMONG THE HOUSEHOLD MEMBERS
OF FOREIGN LABOR MIGRANTS BEFORE AND AFTER MIGRATION
35
Table 24 clearly illustrates that the distribution of community-level work (management and voluntary
work for community forests, irrigation, and water systems; support for schools and religious
institutions; and coordinating of community events such as weddings, funerals, etc.) among members
of migrants’ families have changed after their HH’s involvement in FE. Approximately 29% of this
work was handled by the migrant household member before FE; after FE, this has been has lowered
to 7.4%. Therefore, a huge proportion of the workload has shifted to the spouse from 18.9% before
FE to 43.1% after FE.
Table 25 details the decision making authority among the family members of migrant workers
on issues such as food, clothes, education for children, health services, property, investment,
festivals, employment, and marriage34
. Overall, before foreign employment, 31.4% of migrants
were the decision-makers on the aforementioned issues; this was reduced to 8.7% after FE.
The decision-making authority on these issues has shifted to the spouse of the migrant, increasing
their decision-making from 17.3% before FE to 44.1% after FE. The data clearly illustrates that the
proportion of males as decision-makers within the household of migrants has decreased from 36.8%
to 32.7%. This is a positive scenario for promoting women’s empowerment, as the female members of
migrants’ households are now increasingly making decisions on major household issues.
34
Many marriages in Nepal are arranged by family members rather than decided upon by the individuals in the marriage.
FIGURE 9: THE IMPACT OF REMITTANCES ON THE EDUCATION OF CHILDREN
IN MIGRANT-SENDING HOUSEHOLDS
According to the findings, migrant workers and their families have been prioritizing the education
of their children by utilizing some proportion of remittances for the costs of education. Figure 9
shows that though the trend of enrollment of their children in private schools has decreased from
before FE to after FE, increasingly, children of labor migrants are participating in private tuition
after FE (10% prior to FE up to 34% after FE). Although the reason for the increase in enrollment
in Government schools (and decrease of enrollment in private schools) is undetermined, it may be
connected to the relatively easy access to higher education scholarships via Government schools,
or it may reflect parents’ preference to send their children to Government schools while paying
for private tuition versus paying for private schooling.
36
Table26illustratesthatthereareminor“spillover”effectsofremittancesonmigrants’familymembers’
employment. 2.7% of migrants' family members have changed their occupations after having a family
member participate in foreign employment. For instance, some families started their own business
after ceasing agricultural activities; some families migrated to urban areas; and some discontinued
their previous jobs in order to provide better care and education for their children.
District Total Respondents
Spill Over Effect of Remittance
Yes No
Kathmandu 100 1 99
Sindhupalchok 100 4 96
Makwanpur 100 3 97
Total 300 8 292
Per Cent   2.67 97.33
TABLE 26: EFFECTS OF REMITTANCES ON THE JOBS OF MIGRANTS’ FAMILY MEMBERS
Remittances have a positive impact on the health-seeking behaviors of migrants’ families,
particularly if their children are suffering from common fevers. As illustrated in Figure 10, 14
percent of respondents said that they used to contact Dhami or Jhakri (traditional healers) if a child
was suffering from a fever but this has decreased to only 2% after FE. Similarly, 8% of respondents
said that they practiced home therapy at the first sign of a child’s fever, and this has now decreased
to only 1% after FE. With the decrease in traditional healing methods, an expected result has been
seen in participants’ utilization of formal health institutions and clinics. Before FE, 69% of surveyed
respondents had visited health institutions but this increased to 79% after FE. Similarly, the proportion
of respondents utilizing clinics has nearly doubled from 9.3% to 17.7%. Therefore, remittance monies
from foreign labor employment has made a impact on the health and healthcare seeking behaviors of
migrants. For those who value formal medical models over traditional healing, this can be understand
as a positive impact.
FIGURE 10: HEALTH SEEKING BEHAVIORS OF LABOR MIGRANTS’ HOUSEHOLDS
  
37
4.2 Qualitative Analysis:
Three Focus Group Discussions with community stakeholders were conducted in six VDCs
of Makwanpur, Sindhupalchok and Kathmandu districts. Participants were returnee migrants
and current migrants’ household members. When asked about the main source of income in the
community, respondents of FGDs reported agriculture and livestock as the main sources of income
in the VDC, followed by foreign labor migration, and full-time salaried positions. However, changing
trends in sources of income in the VDCs were reported over the past five years. Participants
of Sanosirubari, Sindhupalchok said that five years ago, the main income source of the VDC
was agriculture but as people nowadays require more immediate sources of income, agriculture
is being replaced by foreign labor migration and employment in non-agricultural jobs.
This theme was repeated throughout the FGDs. According to participants from Chitlang and Gadhi
VDCs of Makwanpur, there is an increasing trend of foreign labor migration and the involvement
of young adults in employment in non-agricultural jobs. As a result, much of the productive farm
land is left unused in the community due to the acute shortage of labor in the community.
Based on the responses of FGD participants, foreign labor migration has contributed to improving
the living standards of the community in terms of improved food sufficiency and security, improved
physical facilities, access to resources, and quality education. Stakeholders also attributed
the increased purchasing capacity of community members to labor migration and remittances.
As a result of the increased flow of funds into rural communities, lower interest loans have become
more available: while five years ago, loans were available with 30% interest rates, at present,
15% interest rates are available, according to participants of Duwachaour, Sindhupalchok.
Despite these observations, stakeholders perceived the improvements in living standards and
reduction in poverty to be temporary and unsustainable, as most of the remittance monies are used
in unproductive sectors. According to the FGD participants, remittances received from foreign labor
migration are most often used for daily household consumption. Further, they believe that remittances
and the resulting life style changes are leading to more sedentary lives for remittance receivers.
Participants further said the increasing trend of purchasing luxury items (i.e. motorcycles, televisions,
and mobile phones), as well as increased alcohol consumption among young people, are barriers
in using remittances in a productive way. However, according to participants, a small proportion of
remittances is invested in real estate.
While discussing the social costs of labor migration, stakeholders said that internal migration from
villages to urban areas is increasing rapidly. People do not want to invest in villages, according to
FGD participants, and there is a lack of active manpower in rural areas as a result. Many people
have been focusing on their personal and family benefit rather than working for community
development and for group success. This is leading to concerns about who will provide the labor
for community-managed infrastructure projects (such as water supply systems, forest nurseries, etc.)
and who will participate in necessary community groups (such as School Management Committees,
Parent Teacher Associations, guthis35
, savings and credit groups, emergency rescue teams, etc.).
According to participants, labor migration also brings about changes in family dynamics and
structures. For the most part, after returning from foreign labor migration, many young people
want to be separated from their parents and start an independent family. Some couples have
had disputes due to extra-marital affairs after FE. Beyond that, according to participants, some
children of migrants do not receive sufficient care and love due to the absence of one or more
35
A guthi is a social organization that a community forms to manage a religious or other institution.
38
parent. Participants generally perceived this to be a bigger problem for children whose mothers are
absent, though this is likely to due to gendered ideas about care-taking and child-raising.
Foreign labor migration and remittance has benefitted female members of the community in terms
of their improved access to money and increased financial decision-making authority, ultimately
leading to improved living standards. The findings of the study show that out of the total migrants,
94.7% are male and that 46% of household-level decisions are determined by their spouse. This
demonstrates a significant increase in female decision makers at the household level. Therefore,
we can infer that remittance has contributed to the empowerment of women in migrant workers’
families. Likewise, according to FGD participants, foreign labor migration and remittances have
contributed to creating feelings of equity among male and female counterparts in the households
of migrant workers, leading to sharing of responsibilities in terms of household activities and decision-
making.
C h a p t e r 5
5.1 Recommendations:
Recommendations for policy developments and future implementation have been developed in line
with the objectives of the present study.
The study sought to determine the process of labor migration for first-time migrants. Based on
findings, researchers recommend:
•	 Awareness of the foreign employment process should be expanded: According to the research,
only around 27% of returnee migrants had gone abroad through authorized channels such as
manpower companies (26.7%) and Government authorities (0.7%). Around seven tenths of the
returnee migrants had gone abroad through unauthorized channels such as relatives/friends/
neighbors (28.7%) and private agents (44.0%). Further, many of them do not have knowledge
about the destination country, nature of work, required processes and employment contract.
Therefore, stakeholders should focus on awareness training among aspiring migrants in order
to facilitate an informed decision making process.
•	 Pre-departure orientation services should be decentralized: Based on the findings from returnee
migrants, about 81% had not received pre-departure orientation. The reason behind this is
that pre-departure orientation is available only in Kathmandu making it expensive and difficult
to access for many potential migrants. Further, prospective migrants were not aware of the
importance of this process so they were unlikely to prioritize it.
•	 Monitoring of migration process should be increased: About 75% of migrants were charged
more than NRs. 80,000 to 160,000 as a service cost by manpower agencies but the government
of Nepal has provisioned not to pay more than NRs. 80,000 for Middle Eastern countries and
Malaysia. Therefore, intensive monitoring of manpower companies has to be made a priority.
In addition, the study sought to describe the socio-demographic profile of migrants and their
households. Along these lines, and in relation with the migration process, the researchers
have the following recommendation:
39
•	 Gender/age limitations on labor migration should be standardized between men and women
to encourage the use of safer, legal channels: Although a very small number of female migrants
were represented in this study, the research shows that 55% of women used an Indian Airport
(i.e. an illegal or unsafe migration process) for foreign labor migration. Further, 56.3% (9 out of
16 female migrants) did not meet the GoN age criteria of 30 years or older for domestic work in
the Middle East. This suggests that the GoN current policy is not effective in discouraging female
migrants under 30 years of age from migrating for work but instead pushes them into migration
through less safe, informal channels, mainly via India. This policy needs to be revised, and migrant
worker women should be encouraged to use safer channels for labor migration.
The study also sought to determine the earning, savings, and remittance-sending behaviors
of labor migrants, including the channels used for transferring remittances. Along these lines,
the researchers have the following recommendation:
•	 Promote labor bank or low interest loans for labor migration: Both returnee migrants (RM)
and current migrants (CM) had used multiple sources to cover the expenses of going abroad. The
majority (72%) of the foreign employee had taken a loan; less than one-third (29.3%) of them had
used either personal savings or household savings; 18.7% had borrowed from a personal source.
In addition, in order to fund migration, respondents had sold ornaments (3%); sold property (2.3%);
and had their expenses covered by hiring company (1%).
•	 The multi response data of 253 loan receivers for the migration shows that 86.9% had
borrowed money from friends/relatives/neighbors followed by income from Savings and
Credit organizations (11.9%), savings groups (7.1%), bank loans (4.8%) and money lenders (2.4%).
About 41% of the 253 labor migrants had taken loans that were charged 36% interest per annum.
Therefore, provision of soft loans has to be managed through formal organizations such as banks
and other financial institutions.
•	 The present study further explored the ways in which remittance-receiving households utilize
remittance monies. Based on the findings, the researchers recommend:
•	 FFPE training must be continued: The investment habits of FFPE trained household members of
remitters has been found more than non FFPE trained household members. Of the 34 FFPE trained
household members, 20.6% had used the remittance in business whereas 12.4% invested money
who didn't attend the FFPE training.
•	 Vocational skills and entrepreneurship development training for aspiring migrants/migrants’
families: The finding show that 36% of migrants worked as manual laborers in destination
countries because they went abroad without skills-based training for technical jobs. Further,
of the total 300 migrants, only 13.3% had invested remittance in productive/business sectors
which has not created a favorable environment for them to them to return to or stay in their
home communities. Returnee migrants and/or their households have started businesses by
investing a very small proportion of remittance in productive sectors, which has not succeeded
in creating business opportunities or promoting livelihoods. Therefore, vocational education,
and skills training, and entrepreneurship development training is needed for aspiring migrants
and their families.
40
Finally, the study explored the household and family-level impacts of remittances on economic, social
and human capital formation. Along these lines, the researchers have the following recommendation:
•	 Impact of remittance on socio-economic and human capital formation: Study findings show
that remittances and their use have positive impacts in terms of economics, and the development
of social/human capital. It shows that foreign labor migration can bring about increased access
to loans by household members, transfer of skills (by returnees) to household members, as well
as the initiation of income generation activities among migrants' families. Given these findings,
the Government and other stakeholders must ensure access to safe, formal channels of labor
migration for all adults seeking to migrate for foreign employment.
Foreign Labor Migration Report_June 22 (1)

More Related Content

What's hot

Missing girls
Missing girlsMissing girls
Missing girls
VIBHUTI PATEL
 
Demo p
Demo pDemo p
Demo p
uzma Gujjer
 
NFHS 3
NFHS 3NFHS 3
Census 2011 ppt
Census 2011 pptCensus 2011 ppt
Census 2011 ppt
Priya Pradeep
 
Baseline Study on the status of HBWWS.PDF
Baseline Study on the status of HBWWS.PDFBaseline Study on the status of HBWWS.PDF
Baseline Study on the status of HBWWS.PDF
Dr. Naveeda Zia
 
2011 Indian Census Scheduled Castes & Scheduled Tribes
2011 Indian Census Scheduled Castes & Scheduled Tribes 2011 Indian Census Scheduled Castes & Scheduled Tribes
2011 Indian Census Scheduled Castes & Scheduled Tribes
geography_monkey
 
Article4 volume4issue22020
Article4 volume4issue22020Article4 volume4issue22020
Article4 volume4issue22020
Naveed Hussain Shah
 
B0412012017
B0412012017B0412012017
B0412012017
inventionjournals
 
Socio Economic and Health Condition of Paniya Tribes in Thavinjal Gramapancha...
Socio Economic and Health Condition of Paniya Tribes in Thavinjal Gramapancha...Socio Economic and Health Condition of Paniya Tribes in Thavinjal Gramapancha...
Socio Economic and Health Condition of Paniya Tribes in Thavinjal Gramapancha...
Rahul Prasad
 
Women role A Presentation By Mr. Allah dad Khan Visiting Professor the Univer...
Women role A Presentation ByMr. Allah dad KhanVisiting Professor the Univer...Women role A Presentation ByMr. Allah dad KhanVisiting Professor the Univer...
Women role A Presentation By Mr. Allah dad Khan Visiting Professor the Univer...
Mr.Allah Dad Khan
 
Role of pakistani women in home &amp; field
Role of pakistani women in home &amp; fieldRole of pakistani women in home &amp; field
Role of pakistani women in home &amp; field
Xeshan Kassana
 
Telangana State Report - February 2017
Telangana State Report - February 2017Telangana State Report - February 2017
Telangana State Report - February 2017
India Brand Equity Foundation
 
Population in india – census 2011
Population in india – census 2011Population in india – census 2011
Population in india – census 2011
Pratheep Chandrasekharan
 
Regional Disparities in the Level of Socio Economic Development in Murshidaba...
Regional Disparities in the Level of Socio Economic Development in Murshidaba...Regional Disparities in the Level of Socio Economic Development in Murshidaba...
Regional Disparities in the Level of Socio Economic Development in Murshidaba...
ijtsrd
 
population and demography of pakistan
population and demography of pakistanpopulation and demography of pakistan
population and demography of pakistan
Syed Shah
 
Telangana State Report July 2017
Telangana State Report July 2017Telangana State Report July 2017
Telangana State Report July 2017
India Brand Equity Foundation
 
Demography of pakistan
Demography of pakistan Demography of pakistan
Demography of pakistan
m waseem noonari
 
Demography &Population of pakistan
Demography &Population of pakistanDemography &Population of pakistan
Demography &Population of pakistan
Jawad Ullah
 
Ahmr vol 3_no_1_jan_apr 2017
Ahmr vol 3_no_1_jan_apr 2017Ahmr vol 3_no_1_jan_apr 2017
Scheduled Tribes in India: As revealed in Census 2011
Scheduled Tribes in India: As revealed in Census 2011Scheduled Tribes in India: As revealed in Census 2011
Scheduled Tribes in India: As revealed in Census 2011
People's Archive of Rural India
 

What's hot (20)

Missing girls
Missing girlsMissing girls
Missing girls
 
Demo p
Demo pDemo p
Demo p
 
NFHS 3
NFHS 3NFHS 3
NFHS 3
 
Census 2011 ppt
Census 2011 pptCensus 2011 ppt
Census 2011 ppt
 
Baseline Study on the status of HBWWS.PDF
Baseline Study on the status of HBWWS.PDFBaseline Study on the status of HBWWS.PDF
Baseline Study on the status of HBWWS.PDF
 
2011 Indian Census Scheduled Castes & Scheduled Tribes
2011 Indian Census Scheduled Castes & Scheduled Tribes 2011 Indian Census Scheduled Castes & Scheduled Tribes
2011 Indian Census Scheduled Castes & Scheduled Tribes
 
Article4 volume4issue22020
Article4 volume4issue22020Article4 volume4issue22020
Article4 volume4issue22020
 
B0412012017
B0412012017B0412012017
B0412012017
 
Socio Economic and Health Condition of Paniya Tribes in Thavinjal Gramapancha...
Socio Economic and Health Condition of Paniya Tribes in Thavinjal Gramapancha...Socio Economic and Health Condition of Paniya Tribes in Thavinjal Gramapancha...
Socio Economic and Health Condition of Paniya Tribes in Thavinjal Gramapancha...
 
Women role A Presentation By Mr. Allah dad Khan Visiting Professor the Univer...
Women role A Presentation ByMr. Allah dad KhanVisiting Professor the Univer...Women role A Presentation ByMr. Allah dad KhanVisiting Professor the Univer...
Women role A Presentation By Mr. Allah dad Khan Visiting Professor the Univer...
 
Role of pakistani women in home &amp; field
Role of pakistani women in home &amp; fieldRole of pakistani women in home &amp; field
Role of pakistani women in home &amp; field
 
Telangana State Report - February 2017
Telangana State Report - February 2017Telangana State Report - February 2017
Telangana State Report - February 2017
 
Population in india – census 2011
Population in india – census 2011Population in india – census 2011
Population in india – census 2011
 
Regional Disparities in the Level of Socio Economic Development in Murshidaba...
Regional Disparities in the Level of Socio Economic Development in Murshidaba...Regional Disparities in the Level of Socio Economic Development in Murshidaba...
Regional Disparities in the Level of Socio Economic Development in Murshidaba...
 
population and demography of pakistan
population and demography of pakistanpopulation and demography of pakistan
population and demography of pakistan
 
Telangana State Report July 2017
Telangana State Report July 2017Telangana State Report July 2017
Telangana State Report July 2017
 
Demography of pakistan
Demography of pakistan Demography of pakistan
Demography of pakistan
 
Demography &Population of pakistan
Demography &Population of pakistanDemography &Population of pakistan
Demography &Population of pakistan
 
Ahmr vol 3_no_1_jan_apr 2017
Ahmr vol 3_no_1_jan_apr 2017Ahmr vol 3_no_1_jan_apr 2017
Ahmr vol 3_no_1_jan_apr 2017
 
Scheduled Tribes in India: As revealed in Census 2011
Scheduled Tribes in India: As revealed in Census 2011Scheduled Tribes in India: As revealed in Census 2011
Scheduled Tribes in India: As revealed in Census 2011
 

Similar to Foreign Labor Migration Report_June 22 (1)

Final ahmr vol 1 no 2 may august 2015
Final ahmr vol  1 no  2 may   august 2015Final ahmr vol  1 no  2 may   august 2015
Final ahmr vol 1 no 2 may august 2015
sergiobz79
 
Migration Report of Jharkhand
Migration Report of JharkhandMigration Report of Jharkhand
Migration Report of Jharkhand
SLDIndia
 
Migration and Agricultural Production: Analysis of Farming Communities of Lam...
Migration and Agricultural Production: Analysis of Farming Communities of Lam...Migration and Agricultural Production: Analysis of Farming Communities of Lam...
Migration and Agricultural Production: Analysis of Farming Communities of Lam...
BRNSS Publication Hub
 
AHMR Volume 6 number 3 September-December 2020 online version
AHMR Volume 6 number 3 September-December 2020 online versionAHMR Volume 6 number 3 September-December 2020 online version
AHMR Volume 6 number 3 September-December 2020 online version
Scalabrini Institute for Human Mobility in Africa
 
HIV Vulnerabilities of Migrant Women: from Asia to the Arab States
HIV Vulnerabilities of Migrant Women: from Asia to the Arab StatesHIV Vulnerabilities of Migrant Women: from Asia to the Arab States
HIV Vulnerabilities of Migrant Women: from Asia to the Arab States
Andy Dabydeen
 
Intra State Migration, Migrants and their Socio Economic Condition A Case Stu...
Intra State Migration, Migrants and their Socio Economic Condition A Case Stu...Intra State Migration, Migrants and their Socio Economic Condition A Case Stu...
Intra State Migration, Migrants and their Socio Economic Condition A Case Stu...
ijtsrd
 
2018 Statewide GHCC Case
2018 Statewide GHCC Case2018 Statewide GHCC Case
2018 Statewide GHCC Case
SparkmanCenter
 
Effect of Remittance on Farmer’s Livelihood: A Case of Sundarbazar Municipali...
Effect of Remittance on Farmer’s Livelihood: A Case of Sundarbazar Municipali...Effect of Remittance on Farmer’s Livelihood: A Case of Sundarbazar Municipali...
Effect of Remittance on Farmer’s Livelihood: A Case of Sundarbazar Municipali...
BRNSS Publication Hub
 
Effect of Remittance on Farmer’s Livelihood: A Case of Sundarbazar Municipali...
Effect of Remittance on Farmer’s Livelihood: A Case of Sundarbazar Municipali...Effect of Remittance on Farmer’s Livelihood: A Case of Sundarbazar Municipali...
Effect of Remittance on Farmer’s Livelihood: A Case of Sundarbazar Municipali...
BRNSS Publication Hub
 
Research Work
Research WorkResearch Work
Research Work
adilakokab
 
Internally Displaced Persons - An Integrated Approach to Rehabilitating IDPs ...
Internally Displaced Persons - An Integrated Approach to Rehabilitating IDPs ...Internally Displaced Persons - An Integrated Approach to Rehabilitating IDPs ...
Internally Displaced Persons - An Integrated Approach to Rehabilitating IDPs ...
Toluwalola Kasali
 
Exploring Rural-Urban Dynamics: A Study of Inter-State Migrants in Gurgaon
Exploring Rural-Urban Dynamics: A Study of Inter-State Migrants in GurgaonExploring Rural-Urban Dynamics: A Study of Inter-State Migrants in Gurgaon
Exploring Rural-Urban Dynamics: A Study of Inter-State Migrants in Gurgaon
SLDIndia
 
National monitoring system of the situation with internally displaced persons...
National monitoring system of the situation with internally displaced persons...National monitoring system of the situation with internally displaced persons...
National monitoring system of the situation with internally displaced persons...
DonbassFullAccess
 
AHMR Volume 7 number 3 September-December 2021
AHMR Volume 7 number 3 September-December 2021AHMR Volume 7 number 3 September-December 2021
AHMR Volume 7 number 3 September-December 2021
Scalabrini Institute for Human Mobility in Africa
 
Key findigs of 2016 Ethiopian Demographic and Health Survey
Key findigs of 2016 Ethiopian Demographic and Health SurveyKey findigs of 2016 Ethiopian Demographic and Health Survey
Key findigs of 2016 Ethiopian Demographic and Health Survey
Abdu Ebrahim
 
Livelihoods of Afghan refugees
Livelihoods of Afghan refugeesLivelihoods of Afghan refugees
Livelihoods of Afghan refugees
Moonzajer M.f.
 
MIS Volume II 12_07_10 Low Res Final
MIS Volume II 12_07_10 Low Res FinalMIS Volume II 12_07_10 Low Res Final
MIS Volume II 12_07_10 Low Res Final
Rajesh Patra
 
SDD AP Migration Report report v6-1-E
SDD AP Migration Report report v6-1-ESDD AP Migration Report report v6-1-E
SDD AP Migration Report report v6-1-E
Maria Shahid
 
Proximate Determinants of Fertility in Eastern Africa: The case of Kenya, Rw...
Proximate Determinants of Fertility in Eastern Africa: The case  of Kenya, Rw...Proximate Determinants of Fertility in Eastern Africa: The case  of Kenya, Rw...
Proximate Determinants of Fertility in Eastern Africa: The case of Kenya, Rw...
Scientific Review SR
 
AHMR volume 6 number 2 may aug 2020 online version
AHMR volume 6 number 2 may aug 2020 online versionAHMR volume 6 number 2 may aug 2020 online version
AHMR volume 6 number 2 may aug 2020 online version
Scalabrini Institute for Human Mobility in Africa
 

Similar to Foreign Labor Migration Report_June 22 (1) (20)

Final ahmr vol 1 no 2 may august 2015
Final ahmr vol  1 no  2 may   august 2015Final ahmr vol  1 no  2 may   august 2015
Final ahmr vol 1 no 2 may august 2015
 
Migration Report of Jharkhand
Migration Report of JharkhandMigration Report of Jharkhand
Migration Report of Jharkhand
 
Migration and Agricultural Production: Analysis of Farming Communities of Lam...
Migration and Agricultural Production: Analysis of Farming Communities of Lam...Migration and Agricultural Production: Analysis of Farming Communities of Lam...
Migration and Agricultural Production: Analysis of Farming Communities of Lam...
 
AHMR Volume 6 number 3 September-December 2020 online version
AHMR Volume 6 number 3 September-December 2020 online versionAHMR Volume 6 number 3 September-December 2020 online version
AHMR Volume 6 number 3 September-December 2020 online version
 
HIV Vulnerabilities of Migrant Women: from Asia to the Arab States
HIV Vulnerabilities of Migrant Women: from Asia to the Arab StatesHIV Vulnerabilities of Migrant Women: from Asia to the Arab States
HIV Vulnerabilities of Migrant Women: from Asia to the Arab States
 
Intra State Migration, Migrants and their Socio Economic Condition A Case Stu...
Intra State Migration, Migrants and their Socio Economic Condition A Case Stu...Intra State Migration, Migrants and their Socio Economic Condition A Case Stu...
Intra State Migration, Migrants and their Socio Economic Condition A Case Stu...
 
2018 Statewide GHCC Case
2018 Statewide GHCC Case2018 Statewide GHCC Case
2018 Statewide GHCC Case
 
Effect of Remittance on Farmer’s Livelihood: A Case of Sundarbazar Municipali...
Effect of Remittance on Farmer’s Livelihood: A Case of Sundarbazar Municipali...Effect of Remittance on Farmer’s Livelihood: A Case of Sundarbazar Municipali...
Effect of Remittance on Farmer’s Livelihood: A Case of Sundarbazar Municipali...
 
Effect of Remittance on Farmer’s Livelihood: A Case of Sundarbazar Municipali...
Effect of Remittance on Farmer’s Livelihood: A Case of Sundarbazar Municipali...Effect of Remittance on Farmer’s Livelihood: A Case of Sundarbazar Municipali...
Effect of Remittance on Farmer’s Livelihood: A Case of Sundarbazar Municipali...
 
Research Work
Research WorkResearch Work
Research Work
 
Internally Displaced Persons - An Integrated Approach to Rehabilitating IDPs ...
Internally Displaced Persons - An Integrated Approach to Rehabilitating IDPs ...Internally Displaced Persons - An Integrated Approach to Rehabilitating IDPs ...
Internally Displaced Persons - An Integrated Approach to Rehabilitating IDPs ...
 
Exploring Rural-Urban Dynamics: A Study of Inter-State Migrants in Gurgaon
Exploring Rural-Urban Dynamics: A Study of Inter-State Migrants in GurgaonExploring Rural-Urban Dynamics: A Study of Inter-State Migrants in Gurgaon
Exploring Rural-Urban Dynamics: A Study of Inter-State Migrants in Gurgaon
 
National monitoring system of the situation with internally displaced persons...
National monitoring system of the situation with internally displaced persons...National monitoring system of the situation with internally displaced persons...
National monitoring system of the situation with internally displaced persons...
 
AHMR Volume 7 number 3 September-December 2021
AHMR Volume 7 number 3 September-December 2021AHMR Volume 7 number 3 September-December 2021
AHMR Volume 7 number 3 September-December 2021
 
Key findigs of 2016 Ethiopian Demographic and Health Survey
Key findigs of 2016 Ethiopian Demographic and Health SurveyKey findigs of 2016 Ethiopian Demographic and Health Survey
Key findigs of 2016 Ethiopian Demographic and Health Survey
 
Livelihoods of Afghan refugees
Livelihoods of Afghan refugeesLivelihoods of Afghan refugees
Livelihoods of Afghan refugees
 
MIS Volume II 12_07_10 Low Res Final
MIS Volume II 12_07_10 Low Res FinalMIS Volume II 12_07_10 Low Res Final
MIS Volume II 12_07_10 Low Res Final
 
SDD AP Migration Report report v6-1-E
SDD AP Migration Report report v6-1-ESDD AP Migration Report report v6-1-E
SDD AP Migration Report report v6-1-E
 
Proximate Determinants of Fertility in Eastern Africa: The case of Kenya, Rw...
Proximate Determinants of Fertility in Eastern Africa: The case  of Kenya, Rw...Proximate Determinants of Fertility in Eastern Africa: The case  of Kenya, Rw...
Proximate Determinants of Fertility in Eastern Africa: The case of Kenya, Rw...
 
AHMR volume 6 number 2 may aug 2020 online version
AHMR volume 6 number 2 may aug 2020 online versionAHMR volume 6 number 2 may aug 2020 online version
AHMR volume 6 number 2 may aug 2020 online version
 

Foreign Labor Migration Report_June 22 (1)

  • 1. Foreign Labor Migration Remittances and their Impact A S t u dy f r o m N e pa l
  • 2. Copyright Combatting Trafficking in Persons (CTIP) program, World Education, Inc., United States Agency for International Development (USAID), May 2016 Lead Authors: Sabina Pradhan, Sangita Bista Contributing authors: Ishwar Mainali, Emma Tobin World Education, Inc. acknowledges the technical and financial support provided by the United States Agency for International Development's Combating Trafficking in Persons program, implemented by The Asia Foundation, in the publication of this document. This study is made possible by the support of the American People through the United States Agency for International Development (USAID) and The Asia Foundation (TAF). The contents of this study are the sole responsibility of World Education, Inc and do not necessarily reflect the views of USAID or the United States Government and The Asia Foundation (TAF).
  • 3. Executive Summary 1 Chapter 1 5 1.1 Introduction 5 1.2 Research Problem/rational for the study 5 1.3 Objective and Research questions 6 Chapter 2 6 2.1 Literature Review 6 Chapter 3 8 3.1 Research methodology and design 8 3.2 Data collection 9 3.3 Analysis of Data 9 3.4 Ethical considerations 9 3.5 Reliability and Validity 9 3.6 Risks and Challenges 9 3.7 Study Scope and Limitations 10 Chapter 4 10 4.1 Analysis and Findings 10 4.2 Qualitative Analysis: 37 Chapter 5 38 5.1 Recommendations: 38 REFERENCES 41 Annex 1 43 Ta b l e o f C o n t e n t s
  • 4. CBS Central Bureau of Statistics CM Current Migrant DOFE Department of Foreign Employment FE Foreign Employment FEPB Foreign Employment Promotion Board FGD Focus Group Discussion GDP Gross Domestic Product GoN Government of Nepal HHs Households IME International Money Express NLSS Nepal Living Standard Survey NRs Nepali Rupees RM Returnee Migrant SPSS Statistical Package for Social Science TAF The Asia Foundation VDC Village Development Committee WEI World Education, Inc. L i st o f A c r o n y m s
  • 5. F o r e w o r d Remittances from foreign employment constitute a substantial portion of Nepal’s GDP, and most rural households now depend on at least one member's earnings from employment away from home, and often from abroad. As remittances are primarily routed through families, they can influence family dynamics in both positive and negative ways. Remittances permit families to increase their consumption level, enabling better health care, nutrition, housing and education, thus reducing poverty levels. Despite the significant contributions of remittances from foreign labor migration for improving the standard of living of migrant households, critics point out that remittances are rarely invested in productive sectors. The Nepal Living Standard Survey 2010/11 reported that of the total remittances sent to Nepal, 79% are used for daily consumption, 7% for paying back loans, 4% for education, while only 2% is used for capital formation. This evidence cautions us to think about the role of remittances in strengthening the economy of Nepal since consumption alone does not promote economic growth. In addition, migration and remittances have affected traditional social structures and power relations within the household due to absence of family members, either male or female, and availability of additional financial resources. With the increasing trend of foreign labor migration and its changing dimensions, the present study assesses the inflow of remittances in relation to the migration process followed—either safe (regular) or unsafe (irregular)—and its impact in terms of social, economic, and human capital on migrant- sending households. The results of this study will be used to inform financial literacy programming and the messages in pre-departure programming for migrant workers. This information is very timely as many of these households will be relying on remittances to reconstruct homes and revive livelihoods after the massive earthquakes of April and May 2015. This study was carried out by World Education, Inc., through the Combating Trafficking in Persons program, led by The Asia Foundation and supported by USAID-Nepal. This report would not have been possible without the support of TAF and USAID and the tireless efforts of the staff of partner organizations, Change Nepal, Pourakhi Nepal, and Gramin Mahila Swabalamban Sastha (GMSS), in Kathmandu, Sindhupalchok and Makwanpur, respectively who were directly involved in the data collection process. World Education welcomes comments and feedback on the study with the aim of strengthening both future research and ongoing programming to prevent trafficking and promote safe migration. Helen Sherpa Country Director
  • 6.
  • 7. 1 E x e c u t i v e S u m m a ry The primary objective of the present study is to assess the larger migration process (“safer migration” versus “unsafe migration”) and its relationship with earnings, savings, and remittance- sending behaviors of Nepali labor migrants. The study outlines channels used for transferring remittances, use of remittances at the household level, and explores the impact of remittances in terms of economic, social, and human capital. The study was carried out in the 300 remittance- receiving households (150 households of returned migrants and 150 households of current migrants) in 7 Village Development Committees (VDCs) in Nepal: Chitlang and Gadi of Makwanpur district; Chhaimale, Talku, and Satungal of Kathmandu district; and Sanosiruwari and Dubachaur of Sindhupalchok district. Mixed research methods were utilized; both quantitative and qualitative data was collected. A purposive sampling method was employed to gather quantitative data via a household level survey. Furthermore, non-probability purposive sampling was used to select the participants for Focus Group Discussions (FGD) including both Returned Migrants (RM) and/or current migrants’ household heads. Socio-demographic Profile of Respondents: Three hundred households participated in the study; each household had a member who was a current or returned migrant. Of these migrants, 94.7% were male and 5.3% were female; 69.3% were married and 30.7% unmarried. Only 2% were illiterate while 98% were literate or had some formal education; 59.3% of respondents received at least a secondary education. Participating migrant workers’ ages ranged from 16 to 46 years. The average age of the migrant workers represented in the study is 25.3 years. Approximately three quarters of migrants represented in the study were between 18 and 29 years at the first time of movement abroad for migration, whereas 23% were 30 years old or older. Only 3.3% of the total 300 migrants were under 18 at the time of their first migration. However, this percentage is higher (25%) among the 16 females who participated in the study in comparison to 2.1% among 284 males. The Process of Migration: Pre-departure orientation is a prerequisite from the Government of Nepal for foreign employment. However, only one fifth (19.3%) of returnee migrants in the study had received the orientation. Out of 139 male returnee migrants, one fifth (20.9%) had participated whereas zero female migrants had attended an orientation. Of the total 150 returnee migrants, only 27.4% used what are considered to be safe channels of migration: manpower agencies or the Government. The remainder arranged their foreign employment through private agents (44%) and relatives, friends, or neighbors (28.7%). Of the total 150 returnee migrants, 8% had gone abroad (to a third country) via an Indian airport which is considered irregular or unsafe migration, as it is not documented or monitored by the Government of Nepal. However, it was found that the proportion of women (54.4% out of 11 returnee migrants) who had used Indian airports was higher in comparison to men (4.2% of 139 male returnees). Though only 8% of returnee migrants had used an Indian airport, less educated migrants were found more likely to do so. Twenty five percent of non-literate participants (4 total); 13.3% of literate participants (15 total); 10.2% of participants with primary education (49 total); 5.3% of participants with secondary educations (57 total); and only 4.0% of participants with higher secondary educations had used an Indian airport to go abroad. This strongly suggests that there is an inverse correlation between the education status of migrant workers and irregular or unsafe migration.
  • 8. 2 Both returnee migrants (RM) and current migrants (CM) had used multiple sources to cover the expenses of going abroad. The majority (72%) had taken a formal loan; 20% had utilized household savings; 18.7% had borrowed from a personal source; and 9.3% had used personal savings. In addition, smaller numbers of respondents had sold ornaments (3%); sold property (2.3%); and had their expenses covered by hiring company (1%). Two thirds (63.3%) of both RMs and CMs had paid over Nepali Rupees (NRs.) 80,000 as a service charge for migration, whereas the other 26.3% paid less than 80,000 NRs. This is significant as, up until June 20151 , the Government of Nepal stipulated that no migrant should pay over 80,000 for foreign labor migration. Earning, Sending, and Utilizing Remittances: The data shows that the longer the length of stay in the destination country, the more funds that were sent to the country of origin. 56% of migrants who stayed abroad for less than five years sent up to 500,000 (5 lakh) NRs. whereas 62% of migrants who stayed abroad for five years or more had sent over 5 lakh. Of the total 300 migrants (RM = 150, CM = 150), 25% of male migrants had sent more than 10 lakh NRs; however, only 6% of female migrants had remitted as much. Further, there was a correlation between a migrant’s education status and the amount of money that he or she was able to remit, with more educated migrants sending more money. 14% of respondents with only a primary education (up to class 5) had sent more than 10 lakh NRs. whereas 24% of migrants with a secondary education or higher had done so. The majority (93.1%) of returnee migrants who participated in a pre-departure orientation (29 migrants) were aware of the salary and benefits offered by his/her hiring company whereas only 68.6% of those who had not taken pre-departure orientation (121 migrants) possessed this information. Among all 300 migrants, 58% had received a salary of NRs. 25,000 per month or more, followed by 22.3% who received less than 20,000; 13.75% who received 20 to 25 thousand; and 6% who did not state their salary. Out of 300 migrants, 214 (71.3%) had chosen money transfer centers (IME, Western Union, Prabhu, Himal Remit, etc.) as a means for sending remittances while 23.7% had chosen banks and the remainder had used a Hundi2 (2.3%), friends or relatives (1.3%), and self-delivery (1%). Ninety five percent of migrants used official channels to send remittances due to the perceived trustworthiness of these methods, efficient services, and the easy access of funds for recipients. A total of NRs. 248,585,500 (approximately $2,399,103 U.S. dollars) was remitted by 281 respondents to Nepal. This does not include funds sent by the nineteen respondents who elected not to respond to the question. The average respondent remitted NRs. 884,644 throughout his or her foreign work period (ranging from less than 1 year to over 10 years).3 Migrants who had chosen irregular channels of migration (namely Indian airports) sent an average of NRs. 814,167, whereas the average remittance amount sent by foreign workers who migrated through authorized channels (Nepalese airports) is higher: NRs. 867,040. In addition, 251 migrants also sent or brought back goods equivalent to an average of NRs. 94,610 per migrant. 1 Since June 2015, the Government’s “free-visa, free-ticket” scheme requires the employer to cover the costs of round-trip airfare and visas for migrants traveling to six Gulf states and Malaysia, and reduces the maximum charge for manpower agencies to NRs. 10,000. (The Kathmandu Post, “Free-visa, free ticket,” May 2, 2016). Further, since April 2015, the Government of Qatar has deemed that employers should cover all costs for Nepali migrants coming to the country (Nepal Times, “Zero cost migration, really?”, April 2015). Despite these changes in policy, migrants are still frequently charged high fees for the costs associated with migration. 2 A Hundi is an informal transfer of money through non-banking sources. 3 Households of current migrants were still receiving remittances from their migrant worker family member at the time of the study.
  • 9. 3 In addition, foreign labor migration has created social changes among remittance-receiving households, with the overall workload of household members having shifted due to the effect of foreign employment. For instance, the roles and responsibilities of non-migrated spouses in the households of respondents have increased in cooking (47.3% to 57.3%), washing dishes (52% to 58%), washing clothes (50.7% to 59.3%) and cleaning the house (49.3% to 58.0%). The roles and responsibilities of spouses have shifted even more significantly for work outside of the home; the responsibilityforshoppingorgoingtothemarkethasincreasedfrom19.7%to46.2%;theresponsibility for going to the office of electricity to pay bills has increased from 16.8 % to 45.6%; and attending financial institutions to make transitions has increased from 18.8% to 45.6% among the spouses of migrants. These findings imply that, for non-migrated family members, labor migration creates a small increase in responsibilities within the home, and a much more significant increase in responsibilities for tasks and errands outside of the home. Remittance has a direct impact on access to physical facilities and increases sources of potable drinking water. Among the 300 migrants represented in the study, the number of concrete roofs on the family home increased from 6.7% to 17.7%. Further, 17% of respondents previously used the river, pond, or lake as a source of drinking water but this was reduced to 7.7% due to the increased percentage of water taps in the homes of respondents from 21% before migration and 36% after. The use of gas in the personal kitchens of respondents has also increased from 7.7% to 46.3%. Approximately 22% of respondent had no toilet before going abroad but this has decreased to only 4.3%. Remittance also has a direct impact on receiving households’ access to various means of communication. There is a significant increase in the use of mobile phones (51.4%), televisions (31.3%), and computers (19.4%) by the family members of migrants. Migrants' families have also invested money in the education of their children. The data shows that the proportion of children enrolled in Government schools has increased from 62.9% to 67.7%. At the same time, the proportion of enrollment in private schools has decreased from 37.1% to 32.3%, with increased engagement in private tuition from 9.7% to 33.9% Although the reason for the increase in enrollment in Government schools is undetermined, it may be connected to the Government school children’s relatively easy access to higher education scholarships, or it may reflect parents’ preference to send their children to Government schools while paying for private tuition versus paying for private schooling. Based on the above findings, it is concluded that there is an improvement in standard of living for migrants’ families within Nepal due to remittance. Therefore, while working together to mitigate vulnerability and risks of migration at the community level through effective information and services, policy makers and program implementers should also be aware of the positive outcomes of remittance, and promote programs that encourage its responsible use.
  • 10. 4
  • 11. 5 C h a p t e r 1 1.1 Introduction Nepal has a long history of foreign labor migration dating back to nineteenth century when Nepalese used to travel for Lahore to join the army of Sikh ruler Ranjit Singh.4 The agreement between Nepal and colonial British government in India in May 1915 formalized the opportunity for foreign employment for Nepalese, especially in the Indian and British armed forces. Since then, Nepalese have been migrating to North-East India in search of work.5 The Government of Nepal (GoN) officially recognized the value of foreign labor migration beyond the Indian subcontinent with the approval of Nepal’s Labor Act of 1985. The economic boom in the Middle East over the last two decades has lead to increased demand for workers, consequently increasing the rate of foreign labor migration from Nepal to the region.6 Though this strong pull factor was evident in attracting Nepali migrants to overseas jobs, the push factor of instability in Nepal played an important role after 2000, when the Maoist insurgency intensified and the manufacturing sector was severely affected by the worsening investment climate. Several community-level studies reported the lack of employment opportunities and inadequate earnings to bear household expenses as two crucial push factors for migration.7 In addition, the Government decision to decentralize the passport issuing process through the District Development Office in 2000 created a synergistic effect for encouraging foreign labor migration towards the Middle East. The major destination countries during the latter part of the 1990s were Saudi Arabia, the United Arab Emirates (UAE), Kuwait, and Qatar.8 The situation has not much changed over the past decade; Department of Foreign Employment (DoFE) data from FY 2006/07 to 2011/12 showed that major destination countries of Nepali labor migrants as Malaysia (31%), Qatar (28%), Saudi Arabia (20%) and UAE (13%).9 1.2 Research Problem/rational for the study Despite the increasing trend as well as the changing dimensions of foreign labor migration and the huge contribution of foreign labor migrants to Nepalese macro and micro economy, the GoN and developmental agencies have been very slow to recognize the significance of foreign labor migration and have done little to protect and promote the rights of migrants in Nepal and in destination countries. As a result, the increase in foreign labor migration has been accompanied by various problems including forgery, fraud, and deception in foreign employment. According to the study by Amnesty International, 93% out of 114 returnee migrants reported being deceived in terms of salary, and three female migrants had been trafficked into prostitution.10 Furthermore, the recent trend of increasing numbers of deaths of foreign labor migrants reported from Malaysia and Gulf countries has raised concerns as to whether these countries are primarily providing safe labor opportunities or presenting significant risks to migrants. Moreover, while the direct economic impact of remittance to improve the living standard of labor migrants’ households is not controversial, the non-monetary 4 Seddon DA, Adhikari Jagannath, .Gurung, Ganesh. Foreign labor migration and Remittance Economy of Nepal. Critical Asian Studies. 2010;34(1):19-40 5 New Era. Study in inter-regional migration in Nepal. 1981 6 Seddon D. Nepal's Dependence on Exporting labor 2005: Available from:http://www.migrationpolicy.org/article/nepals- dependence-exproting-lobour 7 Bahdra C. International Labour Migration of Nepalese Women: The impact of their remittances on poverty reduction 2007. 8 World Bank. Large-scale migration and Remittance in Nepal: issues, challenges, and opportunities. 9 National Human Rights Commission. Foreign Labor Migration and Trafficking in Person in Nepal: 10 International. A OUT ON A LIMB Nepalese Migrant Workders Failed by State and Recruitment Industries 2011
  • 12. 6 effect of remittances—such as impact on health, education, gender issues, social participation, politics, and women’s empowerment—are unexplored areas. Therefore, this study assesses the inflow of remittances in relation to the migration process followed (safe and unsafe) and its impact in terms of the social, economic, and human capital of remittance sending/receiving households.11 1.3 Objectives The study aims to fulfill knowledge gaps by exploring the link between remittance inflow and the migration process, and its social and economic impacts on migrant-sending and remittance-receiving households in selected areas. Specific Objectives: • Identify the process of labor migration for first-time migrants • Describe the socio-demographic profile of migrants and their households • Identify the earning, savings, and remittance-sending behaviors of labor migrants, including the channels used for transferring remittances • Determine the ways in which remittance-receiving households utilize remittance monies • Explore the household and family-level impacts of remittances in terms of economic, social, and human capital formation C h a p t e r 2 2.1 Literature Review Background and context Every year, huge numbers of people around the world migrate to foreign countries in search better economic opportunities and an improved quality of life for themselves and their families. In 2013, the United Nations Populations Division estimated that there were 232 million foreign migrants globally.12 Over the past 20 years, Nepal has become a source country for millions of foreign labor migrants, largely as a result of limited employment opportunities domestically, the Government’s liberal policies on out-migration since the early 1990s, and the growing demand for labor in the Middle East and beyond. 1,466 Nepali nationals depart for foreign labor migration each day.13 Half a million Nepalis, primarily youth, went abroad for foreign employment in the fiscal year 2013/14 alone.14 However, these figures exclude undocumented migrants15 and those working in India -the top destination country for Nepali migrant workers. Although the 2011 Census put the total foreign migrant population at just over 2 million, the actual number of Nepali foreign labor migrants is arguably unknown due to the high occurrence of irregular migration and a lack of comprehensive research.16 11 Nepal Rastriya Bank. Impact Evaluation of Remittances: A case study of Dhanusha District, 2012. 12 GIZ and ILO. Labour Market Trends Analysis and Labour Migration from South Asia to Gulf Cooperation Council Countries, India and Malaysia, 2015. 13 Department of Foreign Employment (DoFE) Annual Report 2014/15 14 GIZ and ILO. Analysis of Labor Market and Migration Trends in Nepal, 2015. 15 Documented migrants depart for foreign labor destinations via Nepal’s airport; undocumented or irregular migrants travel to India and then on to a third country via an India airport. 16 Department of Foreign Employment, Labour Migration for Employment, A Status Report for Nepal, 2013/2014
  • 13. 7 17 World Bank, http://data.worldbank.org/country/nepal 18 Central Bureau of Statistics. Nepal National Population and Housing Census, 2011 19 GIZ and ILO. Analysis of Labor Market and Migration Trends in Nepal, 2015. 20 World Bank Group. Large-Scale Migration and remittance in Nepal: Issues, Challenges, and Opportunities, p. ii, 2011. 21 GIZ and ILO. Analysis of Labor Market and Migration Trends in Nepal,. P. 18, 2015 22 Although the ban was in place at the time of this research, as of May 2016, the Government of Nepal has revised the restriction. Women 24 years of age and above will soon be able to legally pursue employment as domestic workers in the Gulf and Malaysia. (Kathmandu Post, “Ban on women going for domestic jobs lifted,” May 13, 2016). 23 GIZ and ILO. Labour Market Trends Analysis and Labour Migration from South Asia to Gulf Cooperation Council Countries, India and Malaysia, p. 20-21, 2015. 24 A proportion of this group may be absent from their home communities but engaged elsewhere within Nepal, as domestic labor migration is also common. 25 National Institute of Development Studies. Nepal Migration Year Book 2009 26 National Institute of Development Studies. Nepal Migration Year Book 2009 27 Adhikari, Samik. “Reducing the Cost of Migration in Nepal”, Harvard Kennedy School SYPA written in fulfillment of degree requirement, May 2015. http://www.hks.harvard.edu/content/download/76406/1714127/file/Samik%20Adhikari%20 SYPA.pdf 28 World Bank Group. Large-Scale Migration and remittance in Nepal: Issues, Challenges, and Opportunities, p. ii, 2011. Socio-demographic profile of Nepali labor migrants With a population over 28 million17 and 57% of these of legal working age18 , the demand for jobs in Nepal is significant. According to A World Bank Group report, “almost everyone is migrating – the rich, the poor, people from the Mountains, Hills, and Terai, and from all of the country’s five development regions.” However, they are not migrating in equal proportion. Nepal’s poorest and least educated citizens are least likely to seek foreign employment beyond India, as the costs of migration are prohibitive, while those with the highest levels of education are likely to be “absorbed domestically”19 . It is therefore those with primary to secondary educations who are most likely to go abroad for foreign employment; the World Bank Group report confirms that “middle class” families are most likely to have a member working abroad. The likelihood of foreign labor migration differs substantially by sex, as well. Nepali men are significantly more likely to seek foreign employment than women, as evidenced in the 2011 census data on absent populations. Although it is not a guarantee that the entire absent population has gone abroad for foreign employment, it is estimated that only 6-7% of current foreign labor migrants are female20 . This is in part due to socio-cultural, patriarchal norms in which men are considered appropriate providers21 and in part to the Government’s ban on migration for women under 30 years old22 , a law that drives many younger women to migrate through undocumented channels, namely through India.23 In contrast, men are eligible for foreign migration at the age of 18 in Nepal. According the National Population and Housing Census of 2011, the largest group of absentees (44.8%) was between the ages of 15 and 2424 , while the World Bank Group report shows that the majority of foreign labor migrants are between 20 and 44 years old. Safe migration, unsafe migration, and risk of human trafficking Human trafficking and exploitative labor are ever-present risks in Nepal, and those seeking foreign employment are often the targets of scams by brokers and manpower agencies, abuse by employers, and forced labor. Undocumented migrants’ rights are at even greater risk, both throughout the migration process and upon arrival, as their exact numbers and whereabouts are unknown; further, an undocumented status may be associated with a lack of access to services in destination countries25 . The human rights abuses that have and continue to occur against Nepali labor migrants in Gulf countries and elsewhere are well-documented26 , and policies concerning labor migration have therefore been criticized for failing to protect migrants.27 Attempts have been made to reduce the risk of sex trafficking, particularly for female migrants, but the resulting policies (such as the age ban and additional steps in the migration process for women) may actually drive aspiring female migrants to make riskier migration decisions.28
  • 14. 8 29 Department of Foreign Employment, Labour Migration for Employment, A Status Report for Nepal, 2013/2014 30 GIZ and ILO. Analysis of Labor Migration Trends in Nepal,. p. 1, 2015 31 Department of Foreign Employment, Labour Migration for Employment, A Status Report for Nepal, 2013/2014 32 GIZ and ILO. Analysis of Labor Market and Migrations Trends in Nepal, p. XXI, 2015 Remittances and their economic and social impact Despite the very real potential risks of foreign employment, there is no denying the substantial impacts of remittances from foreign labor migrants on Nepal’s economy. According to the Government of Nepal,“…migration and remittances contribute to the development and adaptation needs of recipient families and origin communities…in the form of employment, food security, asset creation, livelihood diversification…disaster risk reduction, (and) changes in attitudes or skills.”29 The Government estimates that if remittances ceased, the rate of poverty would increase from 19.3% to 35.3%. The 2009 Migration Year Book demonstrates how the ratio of remittances to GDP gradually increased between 2005 and 2009. According to the World Bank Group report, 2.7 billion U.S. dollars were remitted to Nepal in 2009, accounting for 22% of the GDP. A joint report by the International Labor Organization and GIZ states that the remittances received in just the first 9 months of fiscal year 2013/2014 were equivalent to 4.1 billion U.S. dollars, or nearly 30% of Nepal’s GDP30 . Policy planning Scholars and policy makers have traditionally thought of labor migration in terms of “push” and “pull factors.” In contrast, today “…scholars are increasingly looking at global migration patterns as “systems” produced through interaction between macro-level and micro-level processes.”31 However, policy-making in Nepal has not kept pace with research; according to some experts, “existing policies on labour and migration have not envisaged the management of migration in a holistic manner and a broader framework for maximising the economic impacts of migration, remittance transfer, and skills enhancement of workers alongside protection of migrant workers is lacking.”32 The present study aims to contribute to evidence base to help inform policy making in Nepal in regard to foreign labor migration. C h a p t e r 3 3.1 Research methodology and design 3.1.1 Research Methodology An Action Research Approach was used as the study aims to use its findings to develop action, i.e. to inform strategy to make migration a worthwhile venture; to prevent unsafe labor migration; and to generate recommendations for making migration a “triple win” strategy for migrants, the societies that receive them, and for their country of origin. A cross-sectional study design was developed, incorporating quantitative and qualitative methods. A purposive sampling method was used to identify the potential households for the household level survey. Furthermore, non-probability purposive sampling was used to select participants for Focus Group Discussions (FGD) among RM and/or HH head of RM and CM
  • 15. 9 3.2 Data collection The data for the fulfillment of the stated objectives of the study is based on primary sources and was elicited by the researchers through surveys from the field specified. The data collection tool was designed to elicit responses from 150 current migrants’ families and 150 returnee migrants of 3 districts (Kathmandu, Sindhupalchok and Makwanpur). A semi-structured questionnaire was used to collect both quantitative and qualitative data from 300 respondents, 150 from CM households and 150 from RM households. A separate questionnaire was used to gather the qualitative data from Focus Group Discussions (FGD); FGDs were comprised of returned migrants, household heads of current migrants, grade 9 and 10 students within the community, and representatives of local political parties. Qualitative information was gathered during FGD in which a voice recorder was used and notes were taken. 3.3 Analysis of Data The collected quantitative data was entered into SPSS software and transferred to MS Excel software for cleaning. After cleaning the data, it was again transferred to SPSS. Recoding of variables was done as per the need for the analysis of variables. A structured checklist was used to gather qualitative data. Audio recordings from Focus Group Discussions (three per study district) was transcribed and analyzed by the Monitoring and Evaluation Specialist from the World Education CTIP project. 3.4 Ethical considerations At the initial stage of the data collection process in the field, the objectives of the study were clearly explained to the respondents. Respondents were also informed that they could end the survey at any stage of the process. Both verbal and written consent were taken prior to survey collection and focus group discussions. Consent was also taken with the respondents to use electronic media, including audio-tape recorders and cameras. The interviewers were staff of a Combating Trafficking in Persons (CTIP) program partner organizations, who were fully supported in the field by supervisors and coordinators of their respective organizations, particularly if and when they faced challenges when interviewing the respondents. The interviewers were suggested to use indirect questions if the answers were not easily elicited. 3.5 Reliability and Validity Pre-testing of instruments was conducted in settings similar to those of the study. After pre-testing, the questionnaires were adjusted based on lessons learned. Data collection was conducted by NGO partner staff familiar with the issues/topics of the study (i.e. foreign migration, remittance, trafficking, etc.). They were also given a two-day orientation on the data collection tools. Analysis has been done by staff experienced with using SPSS 3.6 Risks and Challenges Some difficulties were faced while attempting to collect data on the social-economic conditions of participants. The respondents were often not willing to share personal information relating to their economic status and that of their household, such as having loans and bank balances. For that reason, the research team used a rapport-building method and asked follow-up questions when appropriate so as to ensure data accuracy. Still, in some cases, respondents opted not to respond to some questions.
  • 16. 10 3.7 Study Scope and Limitations The study was carried out in three hill districts, Sindhupalchok, Kathmandu and Makwanpur where the CTIP programme is being implemented. This study did not collect data from the Terai CTIP districts, which include Banke and Kanchanpur. This study thus represents the views, opinions, and practices of RM and CM of the hill district residents only, Sindhupalchok, Kathamandu and Makwanpur. C h a p t e r 4 4.1 Analysis and Findings 4.1.1 The Migration Process Descriptive analysis of sample households The study was carried out among 300 households (HHs) from three districts: Sindhupalchok (100 HHs), Kathmandu (100 HHs), and Makwanpur (100 HHs). Among them, 150 HHs had one family member who was a current migrant (CM) and 150 had a family member who was a returnee migrant (RM). Table 1 shows the details of the presented migrants according to their VDC and district. Location (VDC) Chitlang Gadi Chhaimale Talku Satungal Sanosiruwari Dubachaur Districtwise Total Current Migrants (CM) Kathmandu - - 10 27 13 - - 50 Sindhupalchok - - - - 0 25 25 50 Makwanpur 30 20 - - - - - 50 Returnee Migrants (RM) Kathmandu - - 20 21 9 - - 50 Sindhupalchok - - - - - 25 25 50 Makwanpur 20 30 - - - - - 50 VDC wise Total 50 50 30 48 22 50 50 300 TABLE 1: NUMBER OF RESPONDENTS PER VDC AND DISTRICT
  • 17. 11 Sex disaggregated data of migrants: Male migrants accounted for 94.7% of the participants (284 out of 300 migrants) in surveyed districts, whereas female migrants made up 5.3% (16 out of 300). While discussing this imbalance with stakeholders from Chitlang and Gadi VDC of Makwanpur, they attributed the stigma attached to female labor migrants to the assumption or belief (regardless of the reality) that they are involved in sex work. This, they believed, is the main reason behind the low rate of female labor migration in their district. Gender norms that place the main responsibility for raising children, caring for the elderly, and managing household and agricultural activities are likely also factors. In addition, the Government of Nepal imposes stricter age requirements on female migrants than on male migrants, which may also be a limiting factor for female migrant workers. That said, the practice of female labor migration is relatively new in Nepal and is gradually increasing over time. Table 2 shows that Sindhupalchok had the highest number of female migrants in the study, followed by Kathmandu, and Makwanpur. This finding is consistent with the Status Report of Foreign Labour Migration - 2013/14 where Sindhupalchok ranked first among the top-ten origin districts for female migrants in Nepal. Marital Status of Migrants: Table 3 depicts the marital status of labor migrants participating in the study. A higher proportion of migrants (69.9% or 208 out of 300 migrants) embarked on foreign labor migration after marriage while only 30.7% were unmarried at the time of migration. Analysis of the data by sex shows that only 28.9% of male migrants were unmarried at the time of migration whereas this percentage is higher (62.5%) among females. The status of unmarried migrants is slightly higher (34%) in Kathmandu as compared to Sindhupalchok (29%) and Makwanpur (29%) which may reflect a socio-demographic difference between urban and rural labor migrants. District Returnee Current Total Percent Male Female Male Female Male Female Kathmandu 46 4 50 0 100 96 4 Sindhupalchok 44 6 48 2 100 92 8 Makwanpur 49 1 47 3 100 96 4 Total 139 11 145 5 300 94.7 5.3 TABLE 2: SEX DISTRIBUTION OF MIGRANTS Source district Number of married migrants Number of unmarried migrants Married (%) Unmarried (%) Kathmandu 66 34 66 34 Sindhupalchok 71 29 71 29 Makwanpur 71 29 71 29 Total 208 92 69.3 30.7 TABLE 3: MARITAL STATUS OF FIRST TIME LABOR MIGRANTS
  • 18. 12 Age at First Migration: Table 4 shows that more than two fifths (43%) of labor migrants were between the ages of 18 and 23 years at the time of first migration, followed by the age group of 24-29 years (30.7%), and lastly those over 29 years (23%). Just over three percent (3.3%) of respondents had gone abroad as labor migrants before they reached age 18, which is the minimum required age for male migrants. The restrictions are different for female migrants: at present, government policy does not permit women under the age of 30 to go abroad for domestic work in the Middle East. However, the present study reveals that 56.3% (9 out of 16 female migrants) were below 30 years of age at the time of migration, meaning that they migrated illegally. Age in years Current Returnee Per Cent % of age groupMale Female Male Female Male Female <18 3 1 3 3 60.0 40.0 3.3 18-23 63 4 60 2 95.3 4.7 43.0 24-29 44 0 45 3 96.7 3.3 30.7 >30 35 0 31 3 95.7 4.3 23.0 Total 145 5 139 11 94.7 5.4 100.0 TABLE 4: AGE AT FIRST TIME MIGRATION Ethnicity and Education Status of Labor Migrants: There is a huge difference in education status between male and female migrants. A high proportion of male labor migrants represented in the study (41.9%) received a secondary education; an additional 19 percent received a higher secondary education. In contrast, only 25% of female migrants received a secondary education, and 68.8% have a primary level education or less. In total, 59.3% of the migrant workers surveyed (male and female combined) had secondary education or higher. Sex Illiterate Literate Primary Education Secondary Education Higher Secondary Education Total Male 4 (1.4) 22 (7.7) 85 (29.9) 119 (41.9) 54 (19.0) 284 (100.0) Female 2 (12.5) 2 (12.5) 7 (43.8) 4 (25.0) 1 (6.2) 16 (100.0) Total 6 (2.0) 24 (8.0) 92 (30.7) 123 (41.0) 55 (18.3) 300 (100.0) TABLE 5: STATUS OF LABOR MIGRANTS BY EDUCATION LEVEL
  • 19. 13 High proportions of migrants represented in the study are from both relatively disadvantaged Janajati communities (39.7%) and the upper caste group (38.3%), followed by relatively advantaged Janajatis (20.3%). Very few Dalit individuals were found in the sample and, as the survey did not include a Terai district, few disadvantaged non-Dalit Terai community members were represented in the study. Major occupations of labor migrants pre-migration: Table 7 outlines the occupations of labor migrants represented in the study prior to going abroad. Approximately one third (30.7%) were engaged in agriculture, followed by service jobs (21.7%), manual labor (14.3%), and business (8.7%). Of the total respondents, 15.7% were students before going abroad. Very few respondents (2%) were working in the home prior to migration. Caste Uppercaste Relatively advantaged Janjati ReligiousMinority Dis-advantaged Non-DalitTerai Relatively Disadvantaged Janjati Dalit Total 38.3 20.3 0.3 0.3 39.7 1.0 100.0 TABLE 6: STATUS OF LABOR MIGRANTS BY ETHNICITY AND CASTE Occupation prior to migration Returnee Migrants (number and percent) Current Migrants (number and percent) Total (combined) migrants (number and percent) Working in the home 2 (1.3) 4 (2.7) 6 (2.4) Service work (salaried employment) 35 (23.3) 30 (20.0) 65 (21.7) Manual labor 21 (14.0) 22 (14.7) 43 (14.3) Business 13 (8.7) 13 (8.7) 26 (8.7) Agriculture 49 (32.7) 43 (28.7) 92 (30.7) Student 17 (11.3) 30 (20.0) 47 (15.7) Unemployed 1 (7.0) 0 (0.0) 1 (0.3) Other 12 (8.0) 8 (5.3) 20 (6.7) Total 150 (100.0) 150 (100.0) 300 (100.0) TABLE 7: MIGRANT’S OCCUPATIONS PRIOR TO GOING ABROAD
  • 20. 14 4.1.2 Knowledge and practice of the migration process Labor migration has inherent risks and therefore no process can be considered completely “safe.” For the purposes of this study, the term “safer migration” is employed, and refers to adherence to the following three-step process: 1. Participation in a pre-departure orientation 2. Use of an authorized manpower agency to organize foreign employment 3. Departure from a Nepali airport for foreign labor (versus departure from an Indian airport) Only returnee migrants were asked about their knowledge and practice of the migration process, as it was determined that current migrants’ household members may not be able to answer all of the questions in detail. Of the 150 returnee migrants represented in the study, only 9 individuals had practiced “safer migration” according to the above criteria, as detailed in Table 8: District Practiced zero safer migration processes (number and percent) Practiced 1 safer migration process (number and percent) Practiced 2 safer migration processes (number and percent) Practiced 3 safer migration processes (number and percent) Kathmandu 4 (8%) 25 (50%) 16 (32%) 5 (10%) Sindhupalchok 5 (10%) 26 (52%) 18 (36%) 1 (2%) Makwanpur 3 (6%) 26 (52%) 18 (36%) 3 (6%) Total 12 (8%) 77 (51.3%) 52 (34.7%) 9 (6%) TABLE 8: SAFER MIGRATION PRACTICES AMONG RETURNEE MIGRANTS Despite the very low occurrence of the safer migration practices previous discussed, the overwhelming majority (92%) of returnee migrants represented in the study had used a legal channel to depart for foreign labor migration (i.e. a Nepali airport); for the purposes of this study, use of a Nepali airport is considered one element of practicing “safer migration.” Only 8% of the total migrants surveyed had used an Indian airport for labor migration. Among the male RM, only 4.5% had used the Indian airport to go to abroad. However, this percentage is much higher (55%) among female returnee migrants. It is important to consider the factors and barriers that drive an individual’s decisions within the labor migration process. For instance, education status is seen to have an impact on labor migration choices. The data illustrated in Table 9 shows that the higher the level of education achieved by a returnee migrant, the less likely that migrant is to have used an irregular channel for migration, i.e. an Indian airport. Among the non-literate returned migrants, the use of an Indian airport is 25% whereas this percentage decreases among literate migrants, and decreases again among migrants with higher secondary education and above.
  • 21. 15 Choice of airport is crucial but there are other factors that impact the relatively safety or lack thereof of the foreign labor migration process. Returnee migrants were therefore asked detailed questions about the process of labor migration that they had practiced, including participation in a pre-departure orientation, knowledge of currency in the destination country, medium chosen to arrange foreign employment, etc. The data illustrated in Table 10 illustrates that of the total 150 returnee migrants, only 19.3% had received the pre-departure training for labor migration. However, although an overwhelming majority of returnee migrants had not participated in the training, a significant majority of them reported that they were familiar with the currency of the destination country (65.3%) and benefits package of their new employer (73.3%). The proportion of pre-departure orientations received by returnee migrants was found to be relatively higher in Sindhupalchok (41.4%), followed by Kathmandu (31.0%), and Makwanpur (27.6%). It noteworthy that none of the 11 female returnee labor migrants had received the pre-departure orientation. Only 27% of returnee migrants had arranged their migration through authorized channels such as manpower companies (26.7%) and Government authorities (0.7%). Approximately seven tenths of the returnee migrants had used am unauthorized channel such as relatives, friends, or neighbors (28.7%) and private agents (44.0%). This means that, regardless of other decisions, the majority of returnee migrants represented in the study had not practiced a safer form of migration. Education status Airport used by RM - % (150 total) Nepal India Total Illiterate 75.0 25.0 100.0 Literate but has not attended school 86.7 13.3 100.0 Primary education 89.8 10.2 100.0 Secondary education 94.7 5.3 100.0 Higher secondary and above 96.0 4.0 100.0 Total 92.0 8.0 100.0 Social Group Airport used by RM - % (150 total) Nepal India Total Upper caste groups 93.1 6.9 100.0 Relatively advantages Janajati 96.0 4.0 100.0 Religious minorities 100.0 0.0 100.0 Disadvantaged non-Dalit Terai caste groups 100.0 0.0 100.0 Relatively disadvantaged Janajati 89.2 10.8 100.0 Total 92.0 8.0 100.0 TABLE 9: AIRPORT USED BY RETURNEE MIGRANTS FOR LABOR MIGRATION In addition to education, caste and ethnic background can also impact labor migration decisions. The data about the use of airports among different social castes reveals that approximately 11% of relatively disadvantaged Janajati individuals had used an Indian airport to go to a third country for labor migration, followed by more socially advantaged upper caste migrants (6.9%), and relatively advantaged Janajati (4%). Use of an Indian airport by a higher percentage of relatively disadvantaged Janajati reflects the prevalence of unsafe international labor migration among this group.
  • 22. 16 District Totalnumberofreturneemigrants ReceivedPre-departureorientation Knowledgeofthecurrency ofdestinationcountry Medium chosen for arranging Foreign Employment Knowledgeofbenefitsofemployer Relatives,friend,or neighbor PrivateAgent ManpowerCompany Government Home District and its relation to the Migration Process - % (150 RM) Kathmandu 50 18.0 66.0 32.0 34.0 32.0 2.0 74.0 Sindhupalchok 50 24.0 64.0 28.0 56.0 16.0 0.0 70.0 Makwanpur 50 16.0 66.0 26.0 42.0 32.0 0.0 76.0 Total Percentage 19.3 65.3 28.7 44.0 26.7 0.7 73.3 Education Status and its relation to the Migration Process - % (150 RM) Illiterate 4 0.0 0.0 50.0 50.0 0.0 0.0 0.0 Literate 15 6.7 46.7 33.3 40.0 26.7 0.0 33.3 Primary ed. 49 18.4 63.3 34.7 38.8 26.5 0.0 71.4 Secondary ed. 57 24.6 71.9 21.1 52.6 26.3 0.0 82.5 Higher secondary ed. and beyond 25 20.0 76.0 28.0 36.0 32.0 4.0 92.0 Total percentage 19.3 65.3 28.7 44.0 26.7 0.7 73.3 Prep-departure orientation and its relation to the Migration Process - % (150 RM) Received orientation 19.3 89.7 10.3 58.6 27.6 3.4 93.1 Did not receive orientation 80.7 59.5 33.1 40.5 26.4 0.0 68.6 Total percentage 65.3 28.7 44.0 26.7 0.7 73.3 TABLE 10: MIGRATION PRACTICES IN RELATION TO HOME DISTRICT, EDUCATION, AND RECEIPT OF PRE-DEPARTURE ORIENTATION
  • 23. 17 As illustrated by Table 10, an individual’s education level has a significant impact on his or her chosen process of migration. The cross tabbed data between several variables related to the process of migration and the education level of returnee migrants is provided in the Table 10. The data shows that the higher the level of education a returnee migrant possesses, the more likely he or she is to have received the pre-departure training, and to possess knowledge on the currency of the destination country and benefits provided by the hiring company. Further, it is also found that those with levels of education are less likely to have gone abroad via an Indian airport (an irregular or unsafe migration practice). The table also illustrates that while an overall high proportion of returnee migrants used unauthorized channels to go abroad, 100% of non-literate migrants (4 out of 4) used an unauthorized channel. Similarly, all four non-literate returnee migrants had not participated in pre-departure orientations and were unaware of the currency of the destination country or benefits package of their new company. Pre-departure Orientation was found to have a significant impact on the process of labor migration that was practiced by returnee migrants. Among the 29 returnee migrants who received pre- departure orientation, 90% were aware of the currency in the destination country, while only 59.5% of non-oriented migrants possessed this knowledge. Therefore, over 40% of returnee migrants (those who were not aware of the currency in the destination country) did not practice informed decision-making at the time of migration. Those who received the orientation were also significantly more likely to have knowledge about the benefits package offered by their employer in comparison with those who did not receive the orientation. Among the pre-departure orientation receivers, 93.1% were aware of the perks and benefits of the employer, while only 68.6% of those who had not received the orientation possessed this knowledge. Pre-departure orientation has therefore been shown to have some impact on the migration decisions of migrants. However, although pre-departure orientation receivers were much more likely to use an authorized channel of migration when compared with those who did not receive the orientation, an overall high percentage of migrants surveyed (68.9%) used an unauthorized (unsafe) channel to go abroad for foreign labor migration. Therefore, the data strongly implicates that the formal process meant to be undertaken by labor migrants, including pre-departure orientation, does serve a purpose but is not sufficient for preventing the risk of trafficking and exploitation for migrants. Table 11 shows that 64% of returnee migrants (96 out of 150) had paid over 80,000 Nepalese rupees as a service charge for foreign employment, which includes the costs of passport issuing, pre-departure orientation, processing fee of the manpower company, visa processing, aircraft ticket, a health check-up, insurance and other costs. This is a significant finding as the FEPB of the GoN has stipulated a ceiling of NRs. 80,000 for the process of labor migration, and this amount is valid for migrants going to Malaysia only. There is a lower ceiling of NRs. 70,000 for labor migrants going to Gulf countries including UAE, Saudi Arabia, Bahrain, Kuwait and Oman, whereas the ceiling for Qatar is even lower, at NRs. 20,000.
  • 24. 18 The figure demonstrates that pre-departure orientation has little impact on the amount that migrants spend on the migration process. Approximately 40% of returnee migrants who had not participated in pre-departure orientation paid less than the ceiling amount of 80,000 NRs. whereas only 21% among those who had taken pre-departure orientation paid less than the stipulated maximum. The program therefore does not appear to support migrants to reduce the cost of migration; this may be due to the fact that many migrants have already incurred the costs of migration before attending the orientation. Sex is another factor in predicting the cost of migration. Only 32% of male returnee migrants had spent less than the ceiling cost on the migration process whereas a very high proportion of female returnee migrants had paid less than the ceiling (90.9%). This illustrates the fact that manpower agents and employers are more willing to meet the migration costs for female workers than for male workers; while on the surface this appears to be a benefit to female migrants, it can make them much more vulnerable to exploitation and may in fact be a reflection of human traffickers’ investments in transporting female victims. Variables Up to 80,000 >80,000- 120,000 >120,000 to 160,000 >160,000 Total Pre-departure Orientation Attended (%) 20.7 55.2 17.2 6.9 100.0 Did not attend (%) 39.7 45.5 12.4 2.5 100.0 Total Percentage 36.0 47.3 13.3 3.3 100.0 Sex Male (%) 31.7 50.4 14.4 3.6 100.0 Female (%) 90.9 9.1 0.0 0.0 100.0 Total Percentage 36.0 47.3 13.3 3.3 100.0 Airport Used Nepal (%) 34.8 47.8 13.8 3.6 100.0 India (%) 50.0 41.7 8.3 0.0 100.0 Total Percentage 36.0 47.3 13.3 3.3 100.0 Medium of Arranging Foreign Employment and Migration Relatives, Friends, or Neighbors (%) 48.8 41.9 4.7 4.7 100.0 Agent (%) 39.4 48.5 10.6 1.5 100.0 Manpower (%) 17.5 52.5 27.5 2.5 100.0 Government (%) 0.0 0.0 0.0 100.0 100.0 Total Percentage 36.0 47.3 13.3 3.3 100.0 TABLE 11: MIGRATION EXPENSES AMONG RETURNEE MIGRANTS
  • 25. 19 The method chosen for labor migration also impacts the cost. For instance, approximately 50% of returnee migrants who had used an Indian airport to go to a third country for foreign employment had paid more than the ceiling amount stipulated by the GoN. This is a surprising and important finding as migrants often opt to go abroad via India as it is commonly understood to be the less expensive option. Among the returnee migrants who had consulted with relatives, friends, or neighbors about labor migration, 48.8% of them had paid less than the ceiling amount of NRs. 80,000 whereas this percentage is much lower for migrants who went abroad through an agent (39.4%), followed by those who utilized manpower companies (17.5%). This may suggest that workers with good sources of information from their friend and relative networks are better informed than those relying on manpower agents and more able to negotiate lower migration costs. However, despite the lower costs paid by some migrants, the study did not compare the rate of occurrence of exploitation between those who went abroad with the assistance of friends or neighbors and those who used a manpower agency, nor did it compare use of an authorized versus unauthorized manpower agency. For instance, some migrants paid less for migration costs but may have found themselves deceived in the process. The finding is therefore speculative and warrants further study. Clearly, foreign labor migration is an expensive endeavor for the majority of Nepali migrant workers. Figure 1 illustrates that the source of funds utilized by all respondents (both RM and CM) during the process of migration. The data reveals that 72% of labor migrants had taken formal loans for the process of migration, followed by utilizing household savings (20.0%), borrowing from personal sources (18.7%), and utilizing personal savings (9.3%). Among the total respondents, a very small number had also raised the funds by selling ornaments or property; several had their costs covered by hiring companies; and several utilized other unspecified sources. A small number of study participants (1.0%) did not respond to the question. FIGURE 1: SOURCE OF FUNDING FOR THE PROCESS OF LABOR MIGRATION Of the total 300 labor migrants, only 253 migrants or their households chose to disclose the source of funding used for foreign labor migration costs. All 253 said that they had acquired the money either through formal loans or from borrowing from friends, relatives, or neighbors, or a combination of both sources. Among them, 86.9% had borrowed money from friends, relatives, or neighbors followed by income generated from Savings and Credit organizations (11.9%), income generated through savings groups (7.1%), loans taken from banks (4.8%), and other sources. This data shows that most of the migrants depend on high interest loans from individuals rather than services provided by financial institutions or the Government. Respondents reported paying minimum annual interest rates on loans from 5% all the way up to 36%.
  • 26. 20 Source of loan Number of respondents Percent Bank 10 4.8 Friends, Relatives, and Neighbors 207 86.9 Savings or Finance Company 42 11.9 Savings Group 9 7.1 Money lender 4 2.4 Total 253 100 TABLE 12: SOURCE OF FORMAL LOANS AND BORROWED MONEY TO FUND THE MIGRATION PROCESS Destination Countries Kathmandu Sindhupalchok Makwanpur Total Percent Malaysia 35 21 21 77 25.7 Saudi Arabia 12 38 21 71 23.7 Qatar 15 13 38 66 22.0 Dubai (UAE) 23 8 10 41 13.7 Kuwait 5 17 1 23 7.7 Bahrain 1 1 4 6 2.0 Oman 2 2 1 5 1.7 Korea 4 0 1 5 1.7 Iraq 1 0 1 2 0.7 Other 2 0 1 3 1.0 Total 100 100 100 300 100 TABLE 13: TOP TEN DESTINATION COUNTRIES FOR FOREIGN LABOR MIGRATION As mentioned previously, the level of funding required for foreign labor may depend partially on the destination country. Table 13 depicts the top ten destination countries for the migrants represented in the present study. The data shows that countries located in the Middle East are the primary destinations for foreign labor migration. However, Malaysia (located in South East Asia) has become the largest labor- receiving country overall for the migrants represented in the study, followed by Saudi Arabia, and Qatar. A quarter (25.7%) of migrants in studied HHs had chosen Malaysia for foreign employment. Saudi Arabia (23.7%), Qatar (22.0%), UAE (13.7%), and Kuwait (7.7%) ranked 2nd , 3rd , 4th and 5th , respectively. For migrants from Kathmandu, Malaysia, UAE and Qatar were the top three most preferred destinations whereas Saudi Arabia, Malaysia and Kuwait were the top three destinations for Sindhupalchok district, and Qatar, Malaysia and Saudi Arabia were the top three destinations for those from Makwanpur district.
  • 27. 21 Selection of destination countries for labor migration differs between male and female migrants. Kuwait (62.5%) has become the top destination country for female migrants followed by Malaysia (12.5%), Qatar (12.5%), and Saudi Arabia (12.5%) whereas for make migrants Malaysia (26.4%) is the top destination, followed by Saudi Arabia (24.3%), Qatar (22.5%) and Dubai (14.4%). These differences are largely due to destination country labor demands: while Malaysia is seeking manual laborers, Kuwait is seeking domestic workers and housemaids, and therefore provides free airfare for female migrants. Destination Country Sex of Migrant Male Female Total Malasiya 75 2 77 26.40% 12.50% 25.70% Korea 5 0 5 1.80% 0.00% 1.70% Iraq 2 0 2 0.70% 0.00% 0.70% Afganistan 1 0 1 0.40% 0.00% 0.30% Others 3 0 3 1.10% 0.00% 1.00% Baharaain 6 0 6 2.10% 0.00% 2.00% Kuwait 13 10 23 4.60% 62.50% 7.70% Oman 5 0 5 1.80% 0.00% 1.70% Quatar 64 2 66 22.50% 12.50% 22.00% Dubahi 41 0 41 14.40% 0.00% 13.70% Saudi Arabia 69 2 71 24.30% 12.50% 23.70% Total 284 16 300 100.00% 100.00% 100.00% TABLE 14: DESTINATION COUNTRIES OF LABOR MIGRANTS BY SEX Nepali migrant workers go abroad to do a range of different jobs; the type of work is sometimes determined by the destination country and the sex of the migrant worker, as illustrated above. Figure 2 outlines the primary occupations of the migrants represented in this study during their stints as foreign workers.
  • 28. 22 Figure 2 illustrates that manual labor is the leading type of work for migrants in destination countries (36.0%), followed by agriculture or livestock work (19.0%), driving (13.7%), hotel jobs (13.3%), security guard jobs (9.3%) and housemaid or domestic labor jobs (8.0%). Job Type TotalNumber <10,000NRs. 10to<15,000NRs. 15to<20,000NRs. 20to25,000NRs. >25,000NRs. HHmemberdoes notknowmigrant’s salary Total Driver 41 0.0 2.4 12.2 12.2 68.3 4.9 100.0 Security Guard 28 0.0 3.6 10.7 10.7 71.4 3.6 100.0 Manual laborer 108 1.9 9.3 10.2 13.0 62.0 3.7 100.0 Housemaid 24 4.2 29.2 20.8 16.7 29.2 0.0 100.0 Hotel 40 0.0 10.0 10.0 12.5 50.0 17.5 100.0 Agriculture or Livestock worker 57 0.0 7.0 15.8 17.5 54.4 5.3 100.0 Other 1 0.0 0.0 0.0 0.0 100.0 0.0 100.0 HH member does not know migrant’s occupation 1 0.0 0.0 0.0 0.0 0.0 100.0 100.0 Total 300 1.0 9.0 12.3 13.7 58.0 6.0 100.0 TABLE 15: MIGRANTS’ OCCUPATIONS WITH LATEST MONTHLY INCOME LEVEL: FIGURE 2: MAJOR OCCUPATIONS OF MIGRANTS IN DESTINATION COUNTRIES
  • 29. 23 Fifty eight percent of both returnee and current migrants had received over 25,000 NRs as their current or last monthly income. Of the total 28 security guards, 71.4% had received a monthly salary over 25,000, followed by drivers (68.3% among 41); construction and factory laborers (62.0% among 108), agriculture/livestock workers (54.4% among 57) and hotel staff (50.0% among 40). Though a high proportion of migrants were involved in manual labor (particularly construction) in destination countries, security guard was found to be the highest paid position for migrants, followed by driving and construction work. No. of years Returnee migrant (%) Current migrant (%) % in Total <2 years 1.3 0.7 1.0 2-4 years 46.7 51.3 49.0 5-6 years 34.7 27.3 31.0 7-8 years 12.7 12.7 12.7 9-10 years 3.3 5.30 4.3 10 years & above 1.3 2.7 2.0 Total 100.0 100.0 100 TABLE 16: TIME SPENT ABROAD BY LABOR MIGRANTS33 33 The present study represented current migrants (as reported on by their household members in Nepal) and Table 15 therefore includes current migrants’ years spent abroad thus far Approximately 50% of labor migrants stayed abroad for 2-4 years, followed by 31% who were abroad for 5-6 years. The trend of the length of stay abroad for both RM and CM is similar. About half (46.7%) of returnee migrants had stayed abroad for 2-4 years followed by 5-6 years (31.0%). In total, 19% of labor migrants had spent (or were in the process of spending, in the case of current migrants) 7 or more years abroad. Very few labor migrants (1.0%) had stayed abroad for less than 2 years. Four fifths (80%) of labor migrants had spent 2 to 6 years abroad. 4.1.3: Earning, saving, and remittance-sending behaviors of returnee labor migrants In this section the earning, saving, and remittance-sending behaviors of returnee migrants only are analyzed; data on current migrants’ practices was not collected. Figure 3 shows the salary history range of returnee migrants according to their original employment contract, at the starting month of employment, and at the last month of employment for 150 returnee migrants. Approximately one fourth of returnee migrants had signed contracts for 10,000 Nepali rupees per month or less. 60% of migrant had signed contracts for a monthly salary ranging from NRs 10,001 to NRs. 20,000. Ten percent of them had contracts for a monthly salary of NRs. 20,001 – NRs. 30,000. Only 4% of migrants had signed contracts for a monthly salary higher than NRs. 30,000.
  • 30. 24 As Figure 3 illustrates, not all returnee migrants received the salary that was provided in the original contract during their first month of employment. Interestingly, some migrants benefitted from this scenario rather than suffered, with larger percentages earning NRs. 20,001 – 30,000 and NRs. 30,000 and above than anticipated according to contracts. As one would expect, migrants’ salaries at the last month of employment had increased, with only 2.7 percent earning Nrs. 10,000 or less and over 44 percent earning 30,000 and above. The first two combined bar graphs shown in Figure 3 reveal that migrant workers at the higher end of the salary scale (earning NRs. 20,001 and above) at the time of contract increased their initial salaries at the first month of employment, and then again at the end of their employment. They have therefore progressively moved into higher salary brackets; although this could be a result of currency changes or other factors, further study is required in order to determine why migrants’ salary during their first month of employment often exceeded the salary agreed upon in the contract. The increase in the proportion of returnee migrants at the higher end of the salary range is due to the routine annual increase of workers’ basic salaries, causing shifts from one salary range to another throughout their stay abroad. While the majority of migrants were in the NRs. 10,000 - 20,000 range at the start of their foreign employment, the largest percent (44%) was earning NRs. 30,000 per month or more upon the completion of the contract. Table 17 illustrates that more than two fifths (41.7%) of labor migrants had sent remittances up to NRs. 500,000 throughout their period abroad, followed by 28% of labor migrants who had sent between Nrs. 500,001 and 1,000,000; 13.3% who had sent between NRs. 1,000,001 and 1,500,000; 5% who had sent 1,500,001 to 2,000,000; and 5.7% who had sent more than NRs. 2,000,000. 6.3% of participants chose not to report the money that they had remitted. In total, NRs. 248,585,000 of remittance money was sent by 281 respondents throughout their stay abroad (or up until the present, for CM). Nineteen respondents (13 RM and 6 CM) did not respond to the question. Of those who did response, the average person had remitted approximately NRs. 884,644 throughout their working period (or this far, for CM). Among the total 281 participants who reported the volume of their remittances, the top 10% (28 out of 281) migrants had sent a total of NRs. 63,200,000, which is 25.4% of the total received remittance from all 281 migrants. FIGURE 3: SALARY COMPARISON (ORIGINAL CONTRACT, FIRST MONTH OF EMPLOYMENT, AND LAST MONTH OF EMPLOYMENT)
  • 31. 25 District <500,001 500,001- 1,000,000 1,000,001- 1,500,000 1,500,001- 2,000,000 2,000,000> Notreported Total Kathmandu 43.0 23.0 7.0 6.0 10.0 11.0 100.0 Sindhupalchok 41.0 34.0 13.0 4.0 3.0 5.0 100.0 Makwanpur 41.0 27.0 20.025 5.0 4.0 3.0 100.0 Percent 41.7 28.0 13.3 5.0 5.7 6.3 100.0 TABLE 17: FUNDS REMITTED BY LABOR MIGRANTS THROUGHOUT THEIR PERIOD ABROAD FIGURE 4: MEDIUM SELECTED FOR SENDING REMITTANCES The data further illustrates that the 12 returnee migrants who chose irregular channels of migration (Indian airports) have earned on average NRs. 814,167 during their stay abroad, which is less than the average of NRs. 867,040 remitted by returnee migrants who used the authorized channel (via Nepal’s airport). This is largely due to the fact that those who go abroad via unauthorized channels are often promised salaries by brokers that do not reflect reality while migrants utilizing authorized channels usually earn a salary that is closer to the amount that was initially offered. Of the total 300 labor migrants who participated in the study, 261 reported that they sent or brought goods from the country of work back to Nepal. Among them, 10 did not name the value of the goods. The remaining 251 returnee migrants reported an average value of goods of NRs. 94,610 per migrant.
  • 32. 26 The survey data collected from 300 migrants or, in the case of current migrants, migrants’ households, shows that 100% of participating migrants sent remittances to Nepal during their working period abroad. Of the total 300 labor migrants, 71.3% had sent remittance through IME or Prabhu, while the majority of the remaining migrants had used banks to remit funds (23.7%). Due to the trustworthy nature of the services provided by formal institutions, an overwhelming majority (94%) had chosen official channels to send their remittances. Despite many migrants having practiced irregular or unsafe migration, this finding illustrates that migrants possess a sound understanding of regular (and therefore safer) money transfer options and are utilizing them accordingly. 4.1.4 Uses of Remittances: Figure 5 presents multiple responses of all 300 labor migrants regarding the use of remittances in the country of origin; respondents were permitted to provide as many responses as necessary, as the study recognizes that remittances are used for a wide range of purposes within a single household. Figure 5 shows that approximately four-fifths (79.7%) of labor migrants utilized their remittances to pay back loans, followed by the purchase of household appliances (77.7%), investments in education (67.7%), and investments in health and nutrition (57.3%). Further, around half of the respondents said that they utilized the remittances to pay for daily household expenses (48.0%) and for national festival costs (46.7%). One third of the respondents said that they utilized the remittance money to repair their houses, and approximately one-fourth of the respondents said that they utilized the remittances to buy land or a house (26.0%). One quarter (24.0%) saved the remittance money in a finance group or institution. Only 13.3% of respondents said that the money has been invested in a business. However 24% have put money in to savings some of which may be invested in businesses on their return to Nepal. Approximately one third of respondents (29.3%) said that they had used utilized the remittance for various social events such as marriages, name keeping ceremonies, and rice feeding ceremonies. The graph clearly illustrates that remittances are utilized far more often to repay loans (79.7%) than to invest in productive sectors such as businesses (13.3%) or saving in finance groups or institutions (24.0%). This is a troubling trend given the large sums of money that aspiring migrants and their families take out in loans and borrow through informal networks in order to make foreign labor migration possible. FIGURE 5: USE OF REMITTANCES SENT BY MIGRANTS
  • 33. 27 During Focus Group Discussion in Sanosirubari, Sindhupalchok, participants said that they have been using the remittance money primaily for household expenses but that they have also been buying luxury goods, including motorcycles, televisions, mobile phone sets, etc. In addition, they have invested in education, health, and house construction and repairs. However, they also said that due to the increasing trend of rural-to-urban internal migration, remittance funds have not greatly impacted the development of villages; rather than investing funds in rural village areas, remittance- receiving families are moving to larger urban centers and investing their money there. 4.1.5 Use of remittances in business development/investment (productive sectors) Figure 6 clearly shows that out of 40 migrants’ households (combined RM and CM) who had invested remittance money in businesses, 52.5% had invested in grocery shops, followed by livestock-raising (15.0%), agriculture (12.5%), and beauty parlors and tailoring businesses (7.5% each). The remaining 18% of migrants’ households who had used remittances for business purposes had invested in other types of businesses than those named previously. It can therefore be concluded that when remittance-receiving households do invest in business ventures, they are focused on increasing the family income through small business activities rather than promoting entrepreneurship via large scale businesses. Participants who did not invest remittance monies in business development were asked their reasons for not doing so; respondents were able to provide multiple responses, as illustrated in Table 19. FIGURE 6: TYPES OF BUSINESSES RUN BY BOTH RM AND CM BY UTILIZING REMITTANCE
  • 34. 28 Reasons for not investing in businesses Returnee and Current Migrants RM CM Total Remittances were used for paying loans 4 13 17 3.30% 9.50% 6.50% Remittances were used for household expenses 8 5 13 6.50% 3.60% 5.00% Lack of human resources within the household 20 42 62 16.30% 30.70% 23.80% Remittances were used for purchasing land or a vehicle, or for home construction or repairs. 8 13 21 6.50% 9.50% 8.10% Household members were otherwise occupied by household chores, childcare, agriculture 17 31 48 13.80% 22.60% 18.50% Lacking knowledge, skills, or experience for business management; fear of loss; lack of market knowledge 24 26 50 19.50% 19.00% 19.20% Insufficient funds for investment 47 28 75 38.20% 20.40% 28.80% No response 4 6 10 3.30% 4.40% 3.80% Lack of space or overabundance of shops in the village 3 8 11 2.40% 5.80% 4.20% Illiteracy 3 7 10 2.40% 5.10% 3.80% Remittances were used for investing in education 5 3 8 4.10% 2.20% 3.10% Remittances were used for medical expenses 4 4 8 3.30% 2.90% 3.10% Migrant just returned or was thinking of going abroad; household has not yet decided 8 0 8 6.50% 0.00% 3.10% No interest in business development 11 6 17 8.90% 4.40% 6.50% Total 123 137 260 TABLE 19: REASONS FOR NOT INVESTING REMITTANCES IN BUSINESS DEVELOPMENT
  • 35. 29 Out of 300 total migrants’ households, the vast majority (260 households) had not invested remittance in business development. The multiple response analysis of data from these 260 households illustrates that the most common reason for not doing business is insufficient funds (28.80%) followed by lack of human resources within the household (23.8%), lack of knowledge, skills, or experiences, fear of loss, and lack of understanding of the market (19.2%) and being occupied with household chores, care of children, or engagement in agriculture (18.5%). The reasons for not investing in business differ greatly between current migrants’ and returnee migrants’ households. Though only 20.4% of 137 current migrants said that insufficient funds were the cause for not doing business, this percentage nearly doubles (38.2%) among returnee migrants, implying greater access (or perception of greater access) of funds in current migrants’ households. Conversely, around 16% of 123 returnee migrants stated a lack of necessary human resources within the individual’s house as the main reason for not doing business, but this percentage doubles among current migrants, almost certainly because one of the HH’s potential workers is currently abroad. Though only 3.3% of returnee migrants participating in the study said they were using remittance monies to pay back loans, this was found to be three times more common (9.5%) among the responding households with a current migrant family member at the time of the study. 4.1.6 Impacts of remittances on living conditions of migrants and the sending household Foreign employment has significant impacts on the living conditions of migrant workers and their families. Table 20 illustrates the improvement in physical facilities and infrastructure of returnee and current migrants’ households. The data shows that among both type of families of migrants, 4% increased their use of electricity from 95% before foreign employment to 99% after foreign employment. Similarly, 11% increased the cement roofing on their houses, and there was a 1.3% increase in tile or tin roofing on houses. Likewise, there was a decrease of thatch or straw roofs by 13%. Further, use of cement flooring has increased to 29% from 11%, which is due to the reduction in the use of mud floors by migrants’ families from 87.3% to 67.7%. Prior to a family member going abroad, 17% of respondents used river or pond water for drinking and cooking but this decreased to 7.7% after foreign employment. There is therefore a change in use of piped water, 81.0% before going abroad to 90.7% after involvement in foreign employment. As illustrated in Table 20, the time used to fetch potable water has also been decreased after the respondents’ involvement in foreign employment. This is due to the increase in the availability of piped water to the homes of respondents. Further, the use of modern cooking fuels has drastically increased; use of Liquid Petroleum Gas (LPG) and Bio-gas are now more common than firewood and animal dung among the households of the migrants.
  • 36. 30 Type of facilities Responses of RM and CM % of RM and CM No. of responses before No. of responses present % before % present Electricity 285 297 95.0 99.0 Roof of house Thatch/Straw 42 4 14.0 1.3 Tile/Tin 230 234 76.7 78.0 Cemented 20 53 6.7 17.7 Stone 8 9 2.7 3.0 Main material of the floor Natural floor (mud) 262 203 87.3 67.7 Wooden 3 5 1.0 1.7 Cemented 32 88 10.70 29.3 Stone 3 4 1.0 1.3 Source of drinking water River or pond 51 23 17.0 7.7 Well water 6 5 2.0 1.7 Piped water 243 272 81.0 90.7 Average time to fetch drinking water from source Water source in home 63 108 21.0 36.0 Less than 15 minutes 181 167 60.3 55.7 15 minutes to half hour 36 18 12.0 6.0 More than half hour 20 7 76.7 2.3 Availability of toilet in home Toilet facility in home 235 287 88.3 95.7 Type of fuel household uses for cooking Firewood 279 227 93.6 75.7 Dry dung 2 0 0.7 0.0 Bio-gas 16 36 5.4 12.0 LPG 23 139 7.7 46.3 Kerosene Stove 6 8 2.0 2.7 TABLE 20: IMPACT OF REMITTANCE OF IMPROVING PHYSICAL FACILITIES OF MIGRANT’S HHS
  • 37. 31 FIGURE 7: COMMUNICATION MEANS AND HOUSEHOLD APPLIANCES AT HOUSEHOLD LEVEL BEFORE AND AFTER FOREIGN EMPLOYMENT A drastic change has been observed in regard to migrants’ households’ access to computers from 3.3% to 22.7%. Similarly, use of and access to cameras increased from 11.7% to 38.3% and cable dishes in the home increased from 27.7% to 65.3%. Finally, there is also a significant increase in the use of mobile phones (51.4%) and televisions (31.3%) by the family members of labor migrants. The bar graph shows that significant changes have been observed in the availability of other appliances such as invertors or solar panels, freezers, telephones, and televisions. Use of radios, which many migrants’ households had access to prior to migration, decreased as they were replaced with televisions and computers. Despite the conveniences afforded by access to these items, according to the focus group discussions, use of remittances for purchasing household appliances and other luxury goods has been leading towards a more sedentary lifestyle among migrants’ families, which is a potential negative impact of remittances. FIGURE 8: COMPARISON OF MONTHLY INCOME OF HOUSEHOLDS BEFORE AND AFTER FOREIGN EMPLOYMENT 4.1.7 Income Mobility The bar graph plotted in Figure 8 shows that household incomes of both returnee and current migrants have increased drastically after a family member earned a salary abroad. Returnee migrants report incomes that are three times higher than before they went abroad. The incomes of current migrants are more than four times higher after their involvement in foreign employment, this indicating that individuals earn higher salaries while they are working abroad than after they return to Nepal
  • 38. 32 Household chores % of Response before FE % of Response after FE Respond-ent Spouse Otherfemalemember Othermalemember Total Respondent Spouse Otherfemalemember Othermalemember Total Cooking 4.7 47.3 47.7 0.3 100.0 0.3 53.7 44.7 1.3 100.0 Washing dishes 3.7 52.0 43.3 1.0 100.0 1.0 58.0 40.0 1.0 100.0 Washing clothes 4.3 50.7 44.3 0.7 100.0 0.7 59.3 39.0 1.0 100.0 Cleaning house 4.0 49.3 45.0 1.7 100.0 0.7 58.0 40.0 1.3 100.0 Total responses 50 598 541 11 1200 8 687 491 14 1200 Total % 4.2 49.8 45.1 0.9 100.0 0.7 57.3 40.9 1.2 100.0 TABLE 21: INVOLVEMENT OF MIGRANTS’ HH MEMBERS IN HH CHORES BEFORE AND AFTER IN FE Table 22 shows that the responsibility among migrants’ HH members to care for children, the ill, and the elderly has shifted after the family’s involvement in foreign employment. The figure illus- trates that there has been an increase in the workload of the migrant’s spouse (46.1% to 58.3%) from before to after their spouse went abroad. The increase in responsibility for those activities is due to the decrease in proportion of workload among the respondents (migrants) from 10.4% to 3.3%. 4.1.8 Impact of remittance on the formation of socio-economic and human capital The present study hypothesizes that the inflow of remittance monies into Nepal has an effect beyond increasing spending power, and this study sought to understand how remittance impacts families in terms of distribution of labor, fiscal responsibilities, decision-making patterns, and so on. Table 21 illustrates the workload distribution (household chores) among family members from before and after the family’s involvement in foreign employment. The data reveals an increase in the workload (broken into various tasks) of the spouses of migrants from 49.8% to 57.3%. Based on these findings it is concluded that foreign employment has created additional responsibilities for migrant workers’ family members. For Tables 21 through 25, “Respondent” refers to the Household Heads of current and returnee migrants. For some households of returnee migrants, the Household Head is the returnee migrant him or herself; in the case of current migrants’ households, the Household Head is another member of the household.
  • 39. 33 Child and family care % of Response before FE % of Response after FE Respondent Spouse Otherfemalemember Othermalemember Total Respondent Spouse Otherfemalemember Othermalemember Total Taking care of children 6.9 52.6 30.0 10.5 10.0 2.0 62.5 28.1 7.4 100.0 Taking children to school 7.8 53.6 31.3 7.3 100.0 1.5 67.0 26.1 5.4 100.0 Taking care of ill persons 13.4 37.7 30.8 18.2 100.0 4.5 51.6 28.0 15.9 100.0 Taking care of elderly persons 13.1 42.6 26.7 17.6 100.0 5.3 53.3 23.7 17.8 100.0 Total responses 94 418 271 124 907 30 353 246 106 917 Percent 10.4 46.1 29.9 13.7 100.0 3.3 58.3 26.8 11.6 100.0 TABLE 22: RESPONSIBILITIES AMONG HOUSEHOLD MEMBERS FOR CHILD AND FAMILY CARE Financial transactions % of Response before FE % of Response after FE Respondent Spouse Otherfemale member Othermale member Total Respondent Spouse Otherfemale member Othermale member Total Shopping Marketing 27.8 19.7 18.4 34.1 100.0 5.7 46.2 19.7 28.4 100.0 Paying bills 33.2 16.8 13.4 36.6 100.0 6.4 45.6 14.8 33.2 100.0 Attending banks/ Cooperatives 31.9 18.8 12.8 36.5 100.0 8.2 45.6 14.3 32.0 100.0 Other financial matters 34.3 15.7 11.0 39.0 100.0 10.7 43.7 12.3 33.3 100.0 Total responses 375 209 164 431 1179 92 539 182 378 1191 Percent 31.8 17.7 13.9 36.6 100.0 7.7 45.3 15.3 31.7 100.0 TABLE 23: DIVISION OF FINANCIAL RESPONSIBILITIES AMONG MIGRANTS’ HOUSEHOLD MEMBERS
  • 40. 34 Table 23 deals with the division of labor related to financial transactions among the family members of migrants. Before involvement in foreign employment, 32% of respondents (migrants) said that they had taken responsibility for finance related work. This was decreased to 7.7% after involvement in FE as most are abroad. There is also an increase in the proportion of workload for the spouse from 18% to 45% (27% increases). However, the rest of the members of the family have similar responsibilities before and after of FE. Community Work % of Response before FE % of Response after FE Respondent Spouse Otherfemale member Othermale member Total Respondent Spouse Otherfemale member Othermale member Total Totalresponses 81 53 43 104 281 21 122 46 94 283 Percent 28.8 18.9 15.3 37.0 100.0 7.4 43.1 16.3 33.2 100.0 TABLE 24: INVOLVEMENT OF MIGRANTS’ HH MEMBERS IN COMMUNITY WORK Areas of Decisions regarding: % of Response before FE % of Response after FE Respond-ent Spouse Otherfemale member Othermale member Total Self Spouse Otherfemale member Othermale member Total Food (%) 27.3 21.7 19.3 31.7 100.0 5.7 47.8 17.1 29.4 100.0 Clothing (%) 27.0 24.0 16.7 32.3 100.0 6.0 49.8 16.1 28.1 100.0 Education for Children (%) 32.5 22.4 14.9 30.2 100.0 6.7 53.9 14.2 25.1 100.0 Health care (%) 28.2 22.5 17.4 31.9 100.0 6.4 48.2 17.1 28.4 100.0 Property (%) 34.2 10.4 9.1 46.3 100.0 11.4 37.7 10.1 40.7 100.0 Investments (%) 34.8 13.1 9.0 43.1 100.0 12.5 39.8 10.4 37.4 100.0 Festivals (%) 26.0 19.7 20.0 34.3 100.0 6.3 44.3 19.7 29.7 100.0 Employment (%) 45.5 11.9 6.6 36.0 100.0 15.0 39.8 8.0 37.2 100.0 Marriage (%) 27.3 9.2 16.8 46.6 100.0 9.1 34.2 16.9 39.8 100.0 Total responses 806 445 370 944 2565 223 1128 368 836 2555 Percent 31.4 17.3 14.4 36.8 100.0 8.7 44.1 14.4 32.7 100.0 TABLE 25: DECISION MAKING RESPONSIBILITIES AMONG THE HOUSEHOLD MEMBERS OF FOREIGN LABOR MIGRANTS BEFORE AND AFTER MIGRATION
  • 41. 35 Table 24 clearly illustrates that the distribution of community-level work (management and voluntary work for community forests, irrigation, and water systems; support for schools and religious institutions; and coordinating of community events such as weddings, funerals, etc.) among members of migrants’ families have changed after their HH’s involvement in FE. Approximately 29% of this work was handled by the migrant household member before FE; after FE, this has been has lowered to 7.4%. Therefore, a huge proportion of the workload has shifted to the spouse from 18.9% before FE to 43.1% after FE. Table 25 details the decision making authority among the family members of migrant workers on issues such as food, clothes, education for children, health services, property, investment, festivals, employment, and marriage34 . Overall, before foreign employment, 31.4% of migrants were the decision-makers on the aforementioned issues; this was reduced to 8.7% after FE. The decision-making authority on these issues has shifted to the spouse of the migrant, increasing their decision-making from 17.3% before FE to 44.1% after FE. The data clearly illustrates that the proportion of males as decision-makers within the household of migrants has decreased from 36.8% to 32.7%. This is a positive scenario for promoting women’s empowerment, as the female members of migrants’ households are now increasingly making decisions on major household issues. 34 Many marriages in Nepal are arranged by family members rather than decided upon by the individuals in the marriage. FIGURE 9: THE IMPACT OF REMITTANCES ON THE EDUCATION OF CHILDREN IN MIGRANT-SENDING HOUSEHOLDS According to the findings, migrant workers and their families have been prioritizing the education of their children by utilizing some proportion of remittances for the costs of education. Figure 9 shows that though the trend of enrollment of their children in private schools has decreased from before FE to after FE, increasingly, children of labor migrants are participating in private tuition after FE (10% prior to FE up to 34% after FE). Although the reason for the increase in enrollment in Government schools (and decrease of enrollment in private schools) is undetermined, it may be connected to the relatively easy access to higher education scholarships via Government schools, or it may reflect parents’ preference to send their children to Government schools while paying for private tuition versus paying for private schooling.
  • 42. 36 Table26illustratesthatthereareminor“spillover”effectsofremittancesonmigrants’familymembers’ employment. 2.7% of migrants' family members have changed their occupations after having a family member participate in foreign employment. For instance, some families started their own business after ceasing agricultural activities; some families migrated to urban areas; and some discontinued their previous jobs in order to provide better care and education for their children. District Total Respondents Spill Over Effect of Remittance Yes No Kathmandu 100 1 99 Sindhupalchok 100 4 96 Makwanpur 100 3 97 Total 300 8 292 Per Cent   2.67 97.33 TABLE 26: EFFECTS OF REMITTANCES ON THE JOBS OF MIGRANTS’ FAMILY MEMBERS Remittances have a positive impact on the health-seeking behaviors of migrants’ families, particularly if their children are suffering from common fevers. As illustrated in Figure 10, 14 percent of respondents said that they used to contact Dhami or Jhakri (traditional healers) if a child was suffering from a fever but this has decreased to only 2% after FE. Similarly, 8% of respondents said that they practiced home therapy at the first sign of a child’s fever, and this has now decreased to only 1% after FE. With the decrease in traditional healing methods, an expected result has been seen in participants’ utilization of formal health institutions and clinics. Before FE, 69% of surveyed respondents had visited health institutions but this increased to 79% after FE. Similarly, the proportion of respondents utilizing clinics has nearly doubled from 9.3% to 17.7%. Therefore, remittance monies from foreign labor employment has made a impact on the health and healthcare seeking behaviors of migrants. For those who value formal medical models over traditional healing, this can be understand as a positive impact. FIGURE 10: HEALTH SEEKING BEHAVIORS OF LABOR MIGRANTS’ HOUSEHOLDS  
  • 43. 37 4.2 Qualitative Analysis: Three Focus Group Discussions with community stakeholders were conducted in six VDCs of Makwanpur, Sindhupalchok and Kathmandu districts. Participants were returnee migrants and current migrants’ household members. When asked about the main source of income in the community, respondents of FGDs reported agriculture and livestock as the main sources of income in the VDC, followed by foreign labor migration, and full-time salaried positions. However, changing trends in sources of income in the VDCs were reported over the past five years. Participants of Sanosirubari, Sindhupalchok said that five years ago, the main income source of the VDC was agriculture but as people nowadays require more immediate sources of income, agriculture is being replaced by foreign labor migration and employment in non-agricultural jobs. This theme was repeated throughout the FGDs. According to participants from Chitlang and Gadhi VDCs of Makwanpur, there is an increasing trend of foreign labor migration and the involvement of young adults in employment in non-agricultural jobs. As a result, much of the productive farm land is left unused in the community due to the acute shortage of labor in the community. Based on the responses of FGD participants, foreign labor migration has contributed to improving the living standards of the community in terms of improved food sufficiency and security, improved physical facilities, access to resources, and quality education. Stakeholders also attributed the increased purchasing capacity of community members to labor migration and remittances. As a result of the increased flow of funds into rural communities, lower interest loans have become more available: while five years ago, loans were available with 30% interest rates, at present, 15% interest rates are available, according to participants of Duwachaour, Sindhupalchok. Despite these observations, stakeholders perceived the improvements in living standards and reduction in poverty to be temporary and unsustainable, as most of the remittance monies are used in unproductive sectors. According to the FGD participants, remittances received from foreign labor migration are most often used for daily household consumption. Further, they believe that remittances and the resulting life style changes are leading to more sedentary lives for remittance receivers. Participants further said the increasing trend of purchasing luxury items (i.e. motorcycles, televisions, and mobile phones), as well as increased alcohol consumption among young people, are barriers in using remittances in a productive way. However, according to participants, a small proportion of remittances is invested in real estate. While discussing the social costs of labor migration, stakeholders said that internal migration from villages to urban areas is increasing rapidly. People do not want to invest in villages, according to FGD participants, and there is a lack of active manpower in rural areas as a result. Many people have been focusing on their personal and family benefit rather than working for community development and for group success. This is leading to concerns about who will provide the labor for community-managed infrastructure projects (such as water supply systems, forest nurseries, etc.) and who will participate in necessary community groups (such as School Management Committees, Parent Teacher Associations, guthis35 , savings and credit groups, emergency rescue teams, etc.). According to participants, labor migration also brings about changes in family dynamics and structures. For the most part, after returning from foreign labor migration, many young people want to be separated from their parents and start an independent family. Some couples have had disputes due to extra-marital affairs after FE. Beyond that, according to participants, some children of migrants do not receive sufficient care and love due to the absence of one or more 35 A guthi is a social organization that a community forms to manage a religious or other institution.
  • 44. 38 parent. Participants generally perceived this to be a bigger problem for children whose mothers are absent, though this is likely to due to gendered ideas about care-taking and child-raising. Foreign labor migration and remittance has benefitted female members of the community in terms of their improved access to money and increased financial decision-making authority, ultimately leading to improved living standards. The findings of the study show that out of the total migrants, 94.7% are male and that 46% of household-level decisions are determined by their spouse. This demonstrates a significant increase in female decision makers at the household level. Therefore, we can infer that remittance has contributed to the empowerment of women in migrant workers’ families. Likewise, according to FGD participants, foreign labor migration and remittances have contributed to creating feelings of equity among male and female counterparts in the households of migrant workers, leading to sharing of responsibilities in terms of household activities and decision- making. C h a p t e r 5 5.1 Recommendations: Recommendations for policy developments and future implementation have been developed in line with the objectives of the present study. The study sought to determine the process of labor migration for first-time migrants. Based on findings, researchers recommend: • Awareness of the foreign employment process should be expanded: According to the research, only around 27% of returnee migrants had gone abroad through authorized channels such as manpower companies (26.7%) and Government authorities (0.7%). Around seven tenths of the returnee migrants had gone abroad through unauthorized channels such as relatives/friends/ neighbors (28.7%) and private agents (44.0%). Further, many of them do not have knowledge about the destination country, nature of work, required processes and employment contract. Therefore, stakeholders should focus on awareness training among aspiring migrants in order to facilitate an informed decision making process. • Pre-departure orientation services should be decentralized: Based on the findings from returnee migrants, about 81% had not received pre-departure orientation. The reason behind this is that pre-departure orientation is available only in Kathmandu making it expensive and difficult to access for many potential migrants. Further, prospective migrants were not aware of the importance of this process so they were unlikely to prioritize it. • Monitoring of migration process should be increased: About 75% of migrants were charged more than NRs. 80,000 to 160,000 as a service cost by manpower agencies but the government of Nepal has provisioned not to pay more than NRs. 80,000 for Middle Eastern countries and Malaysia. Therefore, intensive monitoring of manpower companies has to be made a priority. In addition, the study sought to describe the socio-demographic profile of migrants and their households. Along these lines, and in relation with the migration process, the researchers have the following recommendation:
  • 45. 39 • Gender/age limitations on labor migration should be standardized between men and women to encourage the use of safer, legal channels: Although a very small number of female migrants were represented in this study, the research shows that 55% of women used an Indian Airport (i.e. an illegal or unsafe migration process) for foreign labor migration. Further, 56.3% (9 out of 16 female migrants) did not meet the GoN age criteria of 30 years or older for domestic work in the Middle East. This suggests that the GoN current policy is not effective in discouraging female migrants under 30 years of age from migrating for work but instead pushes them into migration through less safe, informal channels, mainly via India. This policy needs to be revised, and migrant worker women should be encouraged to use safer channels for labor migration. The study also sought to determine the earning, savings, and remittance-sending behaviors of labor migrants, including the channels used for transferring remittances. Along these lines, the researchers have the following recommendation: • Promote labor bank or low interest loans for labor migration: Both returnee migrants (RM) and current migrants (CM) had used multiple sources to cover the expenses of going abroad. The majority (72%) of the foreign employee had taken a loan; less than one-third (29.3%) of them had used either personal savings or household savings; 18.7% had borrowed from a personal source. In addition, in order to fund migration, respondents had sold ornaments (3%); sold property (2.3%); and had their expenses covered by hiring company (1%). • The multi response data of 253 loan receivers for the migration shows that 86.9% had borrowed money from friends/relatives/neighbors followed by income from Savings and Credit organizations (11.9%), savings groups (7.1%), bank loans (4.8%) and money lenders (2.4%). About 41% of the 253 labor migrants had taken loans that were charged 36% interest per annum. Therefore, provision of soft loans has to be managed through formal organizations such as banks and other financial institutions. • The present study further explored the ways in which remittance-receiving households utilize remittance monies. Based on the findings, the researchers recommend: • FFPE training must be continued: The investment habits of FFPE trained household members of remitters has been found more than non FFPE trained household members. Of the 34 FFPE trained household members, 20.6% had used the remittance in business whereas 12.4% invested money who didn't attend the FFPE training. • Vocational skills and entrepreneurship development training for aspiring migrants/migrants’ families: The finding show that 36% of migrants worked as manual laborers in destination countries because they went abroad without skills-based training for technical jobs. Further, of the total 300 migrants, only 13.3% had invested remittance in productive/business sectors which has not created a favorable environment for them to them to return to or stay in their home communities. Returnee migrants and/or their households have started businesses by investing a very small proportion of remittance in productive sectors, which has not succeeded in creating business opportunities or promoting livelihoods. Therefore, vocational education, and skills training, and entrepreneurship development training is needed for aspiring migrants and their families.
  • 46. 40 Finally, the study explored the household and family-level impacts of remittances on economic, social and human capital formation. Along these lines, the researchers have the following recommendation: • Impact of remittance on socio-economic and human capital formation: Study findings show that remittances and their use have positive impacts in terms of economics, and the development of social/human capital. It shows that foreign labor migration can bring about increased access to loans by household members, transfer of skills (by returnees) to household members, as well as the initiation of income generation activities among migrants' families. Given these findings, the Government and other stakeholders must ensure access to safe, formal channels of labor migration for all adults seeking to migrate for foreign employment.