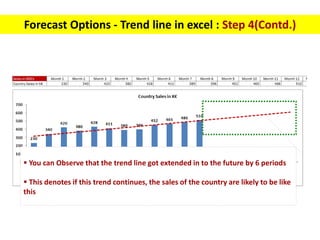
Sales Forecasting for all !
The Creation of Adam : a painting by Michelangelo,
on Sistine Chapel's ceiling
The God appeared to be an anatomically accurate picture of
the human brain.
Forecasting is Science as well as an Art
But, Forecasts can go wrong!
This is the reality!
640K ought to be enough for anybody…
Bill Gates on memory, 1981
Even Bill Gates can go wrong!
Sometimes , the Forecast is always right…
all it needs is a bit of common sense
Here is a Forecast that is always right…
The Paradox of Forecasting
Month’s sale is
difficult to predict
Long range plan is
easy to make
So, What is a Forecast ?
It’s not Crystal gazing
The premise : The near future is going to be like the past
Now , a small test……
Test 1 : What is the Sales Forecast for Dec ?
100
200
300
400
500
600
700
800
900
1000
1100
0
200
400
600
800
1000
1200
Jan Feb Mar Apr May Jun Jul Aug Sep Oct Nov Dec
Is your answer 1,200 ?
That’s Right…
Test 2 : What is the Sales Forecast for Dec?
2000
1900
1800
1700
1600
1500
1400
1300
1200
1100
1000
0
500
1000
1500
2000
2500
Jan Feb Mar Apr May Jun Jul Aug Sep Oct Nov Dec
Is your answer 900 ?
Right again! Good going…
Test 3: What is the Sales Forecast for Dec ?
100
200
300 300
400
500
600 600
700
800
900
0
100
200
300
400
500
600
700
800
900
1000
Jan Feb Mar Apr May Jun Jul Aug Sep Oct Nov Dec
Is your answer 900 ?
Keep it up!
Test 4 : What is the Sales Forecast for Dec ?
100
50
200
100
300
150
400
200
500
250
600
0
100
200
300
400
500
600
700
Jan Feb Mar Apr May Jun Jul Aug Sep Oct Nov Dec
Is your answer 300 ?
That’s Right! Keep it up!
Test 5 : What is the Sales Forecast for July ?
0
0
200
300
400
300
200
0
0
0
0
0
0
0
300
400
500
400
300
0
0
0
0
0
0
0
400
500
600
500
400
0
0
0
0
0
0
0
500
600
700
600
500
0
0
0
0
0
0
0
600
700
800
700
-
100
200
300
400
500
600
700
800
900
Jan-11
Mar-11
May-11
Jul-11
Sep-11
Nov-11
Jan-12
Mar-12
May-12
Jul-12
Sep-12
Nov-12
Jan-13
Mar-13
May-13
Jul-13
Sep-13
Nov-13
Jan-14
Mar-14
May-14
Jul-14
Sep-14
Nov-14
Jan-15
Mar-15
May-15
Jul-15
Is your answer 600?
That’s Great!
Test 6 : What is the Sales Forecast for Dec ?
300
900
0
100
200
300
400
500
600
700
800
900
1000
Oct Nov Dec
Is your answer 600-700-800 ?
Not sure ….Difficult .. isn't it ?
What is the learning ?
More the data, its easy to forecast !
If there is a pattern…its easy to forecast !
If there is seasonality…its easy to forecast !
Forecasting : 3 Simple Factors
Use these 3 factors to
forecast the sales
Season
Time series
Trend
Time Series and Patterns in Time series
 Time Series: The repeated observations of demand for a
service or product in their order of occurrence.
 There are five basic patterns of most time series.
 Horizontal. The fluctuation of data around a constant mean.
 Trend. The systematic increase or decrease in the mean of the series
over time.
 Seasonal. A repeatable pattern of increases or decreases in demand,
depending on the time of day, week, month, or season.
 Cyclical. The less predictable gradual increases or decreases over
longer periods of time (years or decades).
 Random. The un-forecastable variation in demand.
Horizontal Trend
Seasonal Cyclical
Time Series and Patterns in Time series
Forecasting : 3 Simple Factors
Use these 3 factors to
forecast the sales
Season
Time series
Trend
Time Series: The repeated observations of demand for a
service or product in their order of occurrence.
Easy to Forecast !
More the data .. More predictability..
Better Forecasts
Not Sure!
Forecasting : 3 Simple Factors
Use these 3 factors to
forecast the sales
Season
Time series
Trend
A trend is a movement in a particular direction
Trend lines in charts
• A trend is a movement in a particular direction
• A trend line is a straight line connecting multiple
points on a chart.
• The magnitude of the slope of a trend line, or
steepness, indicates the strength of the trend.
• Trendline can be used to forecast future !
100
200
300
400
500
600
700
800
900
1000
1100
0
200
400
600
800
1000
1200
1400
Jan Feb Mar Apr May Jun Jul Aug Sep Oct Nov Dec
This is a
Trend Line
Trend lines in charts
2000
1900
1800
1700
1600
1500
1400
1300
1200
1100
1000
0
500
1000
1500
2000
2500
Jan Feb Mar Apr May Jun Jul Aug Sep Oct Nov Dec
This is also a
Trend Line
Trend lines in charts
Creating Trend line in excel : Step 1
 Select the graph and
right click
 Select Add Trend line
 A window opens with types
of trend line to select from 6
Options
 Select the default option for
trend line – Linear
 Click OK
Creating Trend line in excel : Step 2
You can see the trend line now
Creating Trend line in excel : Step 2(Contd.)
Formatting Trend line in excel : Step 3
 Right click on the trend line to
format it.
 Select style, color and weight of
your choice
Formatting Trend line in excel : Step 3 (contd.)
 Right click on the trend line to
format it.
 Select style, color and weight of
your choice
Forecast Options - Trend line in excel : Step 4
 By using this forecast Option you
can extend the trend line
forward or backward to the
number of periods as desired
 Here, I selected 6 periods
(Months - in this case) forward
Forecast Options - Trend line in excel : Step 4(Contd.)
 You can Observe that the trend line got extended in to the future by 6 periods
 This denotes if this trend continues, the sales of the country are likely to be like
this
Forecast Options - Trend line in excel : Step 4(Contd.)
 By clicking “display equation on
Chart” and display r-Squared
value on chart, you will be able
to display them on the graph -
Next slide explains them
 You can Set Intercept to any
value by clicking it and adding
value (0 is default).
 As this Option is not used
often in simple trend lines ,
explanation is beyond the
scope of this slide set.
Options - Trend line in excel : Step 4(Contd.)
 This is the equation generated by excel that holds
the mathematical relationship of Sales and months.
Equation and R Squared values – Step 4 (Contd.)
Equation
 This is the equation generated by excel that holds
the mathematical relationship of Sales and months.
 This equation will be unique to each data set
 This equation can be used to compute sales of any
future month
 to put it simply , here “y” denotes the sale (which
is on Y axis) and x denotes the month
 So lets compute 13th month projection, using this
equation
 y= ((17.311)*13)+296.39 that equals 521.43
 So the likely sales projection for 13th month is
521.43
 This is the R-Squared value for this trend line.
R Squared value
 This is the R-Squared Value for this trend line.
 This value denotes the reliability of the sales
projections.
 R squared value will range between 0 and 1
 If the R squared value is 1, then the trend is most
predictable and reliable.
 The reliability of trend line goes up if the R-
Squared value is nearest to 1
 Let us see the next example to understand it
better.
R Squared value
Take a look at the trend of sales and R Squared value
R Squared value = 1
 Here the R Squared Value is 1.
 Just take a look at the sales progress.
 With every passing month, this territory is adding
$100 to the previous month.
 So, going by the trend, you can be almost sure, that
the 13th month sales are .
 Remember, Trend lines and Forecasts means you are
presuming the existing market conditions are not going
to change radically.
Take a look at the Equation.. It is y=100x
 This means Y, the next month sales (13 th Month
sales)
 y= ((100)*13) that equals 1,300
 So ,the likely sales projection for 13th month is 1,300
 Remember the Forecast Test 1 ?
Now that you know what is R Squared value,
It’s Time to understand Correlation
By the way, r is called Correlation Coefficient
and
R Squared value is called Ccoefficient of Determination.
You need not remember these Hi-Fi terminology
It’s good enough to understand that if R Squared value is
near value of 1, the forecast is more accurate!!
100
200
300
400
500
600
700
800
900
1000
1100
0
200
400
600
800
1000
1200
Jan Feb Mar Apr May Jun Jul Aug Sep Oct Nov Dec
Relationships involving dependence
Take a look at this trend….
Every one month the Increment is +100
2000
1900
1800
1700
1600
1500
1400
1300
1200
1100
1000
0
500
1000
1500
2000
2500
Jan Feb Mar Apr May Jun Jul Aug Sep Oct Nov Dec
Relationships involving dependence
Take a look at this trend….
Every one month the decrease is by minus 100
In both the examples, There is a very good correlation between the
months progress and sales progress
With every month increase , there is a gain or loss of 100
In both the cases, R Squared value is equal to 1
This is also a perfect Correlation!
The R Squared value , if measured must be 1 !!
Some time ago, Wal-Mart decided to combine the data
Once combined, the data was mined extensively and many
correlations appeared.
Some of these were obvious; people who buy gin are also likely to
buy tonic. They often also buy lemons.
However, one correlation stood out like a
sore thumb because it was so unexpected.
Those queries revealed that, between 5pm and 7pm,
customers tended to co-purchase beer and diapers.
It seems , they found out that parents who wants to babysit
and also watch football and drink beer do not want to be
disturbed by their babies!
62
Wal-Mart moved
the beer next to
the diapers and
beer sales went
up.
Trend line types
1. Logarithmic
2. Polynomial
3. Power
4. Exponential
5. Moving Average
 Do Remember, that for
every trend line type you
select, you will get different
equation and R Squared
value
Equation and R Squared Values- various trend lines
Rule of thumb to use type of Trend line
1.Linear trend line : Use it if data values are increasing
or decreasing at a steady rate.
2. Logarithmic trend line : Useful when the rate of
change in the data increases or decreases quickly
and then levels out.
Rule of thumb to use type of Trend line
3. Polynomial trend line : Used when there are data
fluctuations like the sales following seasonal trends
Rule of thumb to use type of Trend line
4. Power trend line : Use with data that has values that
increase at specific rate at regular intervals.
Rule of thumb to use type of Trend line
5. Exponential trend line : Use when data values
increase or decrease rates that are constantly
increasing.
Rule of thumb to use type of Trend line
6. Moving average trend line : Use it when uneven
fluctuations are in data values
Rule of thumb to use type of Trend line
Best fit Trend line
• We have learnt that if R2 Value is near to 1, the reliability of
trend line is better.
• So, now we need to use a trend line from the five available
trend lines in excel menu to arrive at the most appropriate
one to ensure that our forecast is most reliable.
• The other trend line left out is Moving average for which
,you will neither get the equation nor the R2 value.
• Simplest way to find the best fit trend line is to check every
trend line’s R2 Value and use the trend line with highest R2
value ( Which is nearest to 1- out of 5 types)
Forecasting : 3 Simple Factors
Use these 3 factors to
forecast the sales
Season
Time series
Trend
0
0
200
300
400
300
200
0
0
0
0
0
0
0
300
400
500
400
300
0
0
0
0
0
0
0
400
500
600
500
400
0
0
0
0
0
0
0
500
600
700
600
500
0
0
0
0
0
0
0
600
700
800
700
-
100
200
300
400
500
600
700
800
900
Jan-11
Mar-11
May-11
Jul-11
Sep-11
Nov-11
Jan-12
Mar-12
May-12
Jul-12
Sep-12
Nov-12
Jan-13
Mar-13
May-13
Jul-13
Sep-13
Nov-13
Jan-14
Mar-14
May-14
Jul-14
Sep-14
Nov-14
Jan-15
Mar-15
May-15
Jul-15
Seasonality needs little explanation
Measuring Seasonality is simple
Sales Year 1 Year 2 Year 3 Year 4 Year 5 Year 1 Year 2 Year 3 Year 4 Year 5 5 Year Avg.
Jan 205 293 380 468 565 6.2% 6.7% 7.0% 7.1% 7.2% 6.9%
Feb 296 387 482 571 663 8.9% 8.9% 8.8% 8.7% 8.5% 8.7%
Mar 368 453 544 635 795 11.1% 10.4% 10.0% 9.7% 10.2% 10.2%
Apr 396 483 568 657 770 11.9% 11.1% 10.4% 10.0% 9.9% 10.4%
May 388 480 571 669 789 11.7% 11.0% 10.5% 10.2% 10.1% 10.5%
Jun 248 338 425 524 613 7.5% 7.7% 7.8% 8.0% 7.9% 7.8%
Jul 214 301 387 484 578 6.4% 6.9% 7.1% 7.4% 7.4% 7.1%
Aug 245 332 426 525 621 7.4% 7.6% 7.8% 8.0% 8.0% 7.8%
Sep 241 322 407 505 597 7.2% 7.4% 7.5% 7.7% 7.7% 7.5%
Oct 244 334 422 515 611 7.3% 7.6% 7.7% 7.8% 7.8% 7.7%
Nov 265 348 446 542 629 8.0% 8.0% 8.2% 8.2% 8.1% 8.1%
Dec 217 299 393 483 564 6.5% 6.8% 7.2% 7.3% 7.2% 7.1%
Year 3,327 4,370 5,451 6,578 7,795 100.0% 100.0% 100.0% 100.0% 100.0% 100.0%
So, these three factors can help us forecast
Use these 3 factors to
forecast the sales
Season
Time series
Trend
Here is a tool I created for you… using all 3 factors
Please download it in the downloads section or click the link below
Forecasting tool
Pharma Factors to consider
• Price variations – Better to forecast on units than
value
• Sales Closings and Incentives – Cyclical patterns ?
• Campaigns – Special campaigns ?
• Trade offers - Seasonality?
• Market – Localized Seasonality ? ( Local festivals in
zones e.g. Diwali, Puja etc.)
Easiest Forecasting Method
with new Microsoft Excel
Select the data , click forecast and Create
Voilà! ,forecast values with graphs!
Thank you

Sales Forecasting Basics

  • 1.
  • 2.
    The Creation ofAdam : a painting by Michelangelo, on Sistine Chapel's ceiling
  • 3.
    The God appearedto be an anatomically accurate picture of the human brain.
  • 4.
    Forecasting is Scienceas well as an Art
  • 5.
  • 6.
    This is thereality!
  • 7.
    640K ought tobe enough for anybody… Bill Gates on memory, 1981 Even Bill Gates can go wrong!
  • 8.
    Sometimes , theForecast is always right… all it needs is a bit of common sense
  • 9.
    Here is aForecast that is always right…
  • 10.
    The Paradox ofForecasting Month’s sale is difficult to predict Long range plan is easy to make
  • 11.
    So, What isa Forecast ?
  • 12.
  • 13.
    The premise :The near future is going to be like the past
  • 14.
    Now , asmall test……
  • 15.
    Test 1 :What is the Sales Forecast for Dec ? 100 200 300 400 500 600 700 800 900 1000 1100 0 200 400 600 800 1000 1200 Jan Feb Mar Apr May Jun Jul Aug Sep Oct Nov Dec
  • 16.
    Is your answer1,200 ? That’s Right…
  • 17.
    Test 2 :What is the Sales Forecast for Dec? 2000 1900 1800 1700 1600 1500 1400 1300 1200 1100 1000 0 500 1000 1500 2000 2500 Jan Feb Mar Apr May Jun Jul Aug Sep Oct Nov Dec
  • 18.
    Is your answer900 ? Right again! Good going…
  • 19.
    Test 3: Whatis the Sales Forecast for Dec ? 100 200 300 300 400 500 600 600 700 800 900 0 100 200 300 400 500 600 700 800 900 1000 Jan Feb Mar Apr May Jun Jul Aug Sep Oct Nov Dec
  • 20.
    Is your answer900 ? Keep it up!
  • 21.
    Test 4 :What is the Sales Forecast for Dec ? 100 50 200 100 300 150 400 200 500 250 600 0 100 200 300 400 500 600 700 Jan Feb Mar Apr May Jun Jul Aug Sep Oct Nov Dec
  • 22.
    Is your answer300 ? That’s Right! Keep it up!
  • 23.
    Test 5 :What is the Sales Forecast for July ? 0 0 200 300 400 300 200 0 0 0 0 0 0 0 300 400 500 400 300 0 0 0 0 0 0 0 400 500 600 500 400 0 0 0 0 0 0 0 500 600 700 600 500 0 0 0 0 0 0 0 600 700 800 700 - 100 200 300 400 500 600 700 800 900 Jan-11 Mar-11 May-11 Jul-11 Sep-11 Nov-11 Jan-12 Mar-12 May-12 Jul-12 Sep-12 Nov-12 Jan-13 Mar-13 May-13 Jul-13 Sep-13 Nov-13 Jan-14 Mar-14 May-14 Jul-14 Sep-14 Nov-14 Jan-15 Mar-15 May-15 Jul-15
  • 24.
    Is your answer600? That’s Great!
  • 25.
    Test 6 :What is the Sales Forecast for Dec ? 300 900 0 100 200 300 400 500 600 700 800 900 1000 Oct Nov Dec
  • 26.
    Is your answer600-700-800 ? Not sure ….Difficult .. isn't it ?
  • 27.
    What is thelearning ? More the data, its easy to forecast ! If there is a pattern…its easy to forecast ! If there is seasonality…its easy to forecast !
  • 28.
    Forecasting : 3Simple Factors Use these 3 factors to forecast the sales Season Time series Trend
  • 29.
    Time Series andPatterns in Time series  Time Series: The repeated observations of demand for a service or product in their order of occurrence.  There are five basic patterns of most time series.  Horizontal. The fluctuation of data around a constant mean.  Trend. The systematic increase or decrease in the mean of the series over time.  Seasonal. A repeatable pattern of increases or decreases in demand, depending on the time of day, week, month, or season.  Cyclical. The less predictable gradual increases or decreases over longer periods of time (years or decades).  Random. The un-forecastable variation in demand.
  • 30.
    Horizontal Trend Seasonal Cyclical TimeSeries and Patterns in Time series
  • 31.
    Forecasting : 3Simple Factors Use these 3 factors to forecast the sales Season Time series Trend Time Series: The repeated observations of demand for a service or product in their order of occurrence.
  • 32.
    Easy to Forecast! More the data .. More predictability.. Better Forecasts Not Sure!
  • 33.
    Forecasting : 3Simple Factors Use these 3 factors to forecast the sales Season Time series Trend A trend is a movement in a particular direction
  • 34.
    Trend lines incharts • A trend is a movement in a particular direction • A trend line is a straight line connecting multiple points on a chart. • The magnitude of the slope of a trend line, or steepness, indicates the strength of the trend. • Trendline can be used to forecast future !
  • 35.
    100 200 300 400 500 600 700 800 900 1000 1100 0 200 400 600 800 1000 1200 1400 Jan Feb MarApr May Jun Jul Aug Sep Oct Nov Dec This is a Trend Line Trend lines in charts
  • 36.
    2000 1900 1800 1700 1600 1500 1400 1300 1200 1100 1000 0 500 1000 1500 2000 2500 Jan Feb MarApr May Jun Jul Aug Sep Oct Nov Dec This is also a Trend Line Trend lines in charts
  • 37.
    Creating Trend linein excel : Step 1  Select the graph and right click  Select Add Trend line
  • 38.
     A windowopens with types of trend line to select from 6 Options  Select the default option for trend line – Linear  Click OK Creating Trend line in excel : Step 2
  • 39.
    You can seethe trend line now Creating Trend line in excel : Step 2(Contd.)
  • 40.
    Formatting Trend linein excel : Step 3  Right click on the trend line to format it.  Select style, color and weight of your choice
  • 41.
    Formatting Trend linein excel : Step 3 (contd.)  Right click on the trend line to format it.  Select style, color and weight of your choice
  • 42.
    Forecast Options -Trend line in excel : Step 4
  • 43.
     By usingthis forecast Option you can extend the trend line forward or backward to the number of periods as desired  Here, I selected 6 periods (Months - in this case) forward Forecast Options - Trend line in excel : Step 4(Contd.)
  • 44.
     You canObserve that the trend line got extended in to the future by 6 periods  This denotes if this trend continues, the sales of the country are likely to be like this Forecast Options - Trend line in excel : Step 4(Contd.)
  • 45.
     By clicking“display equation on Chart” and display r-Squared value on chart, you will be able to display them on the graph - Next slide explains them  You can Set Intercept to any value by clicking it and adding value (0 is default).  As this Option is not used often in simple trend lines , explanation is beyond the scope of this slide set. Options - Trend line in excel : Step 4(Contd.)
  • 46.
     This isthe equation generated by excel that holds the mathematical relationship of Sales and months. Equation and R Squared values – Step 4 (Contd.)
  • 47.
    Equation  This isthe equation generated by excel that holds the mathematical relationship of Sales and months.  This equation will be unique to each data set  This equation can be used to compute sales of any future month  to put it simply , here “y” denotes the sale (which is on Y axis) and x denotes the month  So lets compute 13th month projection, using this equation  y= ((17.311)*13)+296.39 that equals 521.43  So the likely sales projection for 13th month is 521.43
  • 48.
     This isthe R-Squared value for this trend line. R Squared value
  • 49.
     This isthe R-Squared Value for this trend line.  This value denotes the reliability of the sales projections.  R squared value will range between 0 and 1  If the R squared value is 1, then the trend is most predictable and reliable.  The reliability of trend line goes up if the R- Squared value is nearest to 1  Let us see the next example to understand it better. R Squared value
  • 50.
    Take a lookat the trend of sales and R Squared value
  • 51.
    R Squared value= 1  Here the R Squared Value is 1.  Just take a look at the sales progress.  With every passing month, this territory is adding $100 to the previous month.  So, going by the trend, you can be almost sure, that the 13th month sales are .  Remember, Trend lines and Forecasts means you are presuming the existing market conditions are not going to change radically.
  • 52.
    Take a lookat the Equation.. It is y=100x  This means Y, the next month sales (13 th Month sales)  y= ((100)*13) that equals 1,300  So ,the likely sales projection for 13th month is 1,300  Remember the Forecast Test 1 ?
  • 53.
    Now that youknow what is R Squared value, It’s Time to understand Correlation By the way, r is called Correlation Coefficient and R Squared value is called Ccoefficient of Determination.
  • 54.
    You need notremember these Hi-Fi terminology It’s good enough to understand that if R Squared value is near value of 1, the forecast is more accurate!!
  • 55.
    100 200 300 400 500 600 700 800 900 1000 1100 0 200 400 600 800 1000 1200 Jan Feb MarApr May Jun Jul Aug Sep Oct Nov Dec Relationships involving dependence Take a look at this trend…. Every one month the Increment is +100
  • 56.
    2000 1900 1800 1700 1600 1500 1400 1300 1200 1100 1000 0 500 1000 1500 2000 2500 Jan Feb MarApr May Jun Jul Aug Sep Oct Nov Dec Relationships involving dependence Take a look at this trend…. Every one month the decrease is by minus 100
  • 57.
    In both theexamples, There is a very good correlation between the months progress and sales progress With every month increase , there is a gain or loss of 100 In both the cases, R Squared value is equal to 1
  • 58.
    This is alsoa perfect Correlation! The R Squared value , if measured must be 1 !!
  • 59.
    Some time ago,Wal-Mart decided to combine the data Once combined, the data was mined extensively and many correlations appeared. Some of these were obvious; people who buy gin are also likely to buy tonic. They often also buy lemons. However, one correlation stood out like a sore thumb because it was so unexpected.
  • 60.
    Those queries revealedthat, between 5pm and 7pm, customers tended to co-purchase beer and diapers.
  • 61.
    It seems ,they found out that parents who wants to babysit and also watch football and drink beer do not want to be disturbed by their babies!
  • 62.
    62 Wal-Mart moved the beernext to the diapers and beer sales went up.
  • 63.
    Trend line types 1.Logarithmic 2. Polynomial 3. Power 4. Exponential 5. Moving Average
  • 64.
     Do Remember,that for every trend line type you select, you will get different equation and R Squared value Equation and R Squared Values- various trend lines
  • 65.
    Rule of thumbto use type of Trend line 1.Linear trend line : Use it if data values are increasing or decreasing at a steady rate.
  • 66.
    2. Logarithmic trendline : Useful when the rate of change in the data increases or decreases quickly and then levels out. Rule of thumb to use type of Trend line
  • 67.
    3. Polynomial trendline : Used when there are data fluctuations like the sales following seasonal trends Rule of thumb to use type of Trend line
  • 68.
    4. Power trendline : Use with data that has values that increase at specific rate at regular intervals. Rule of thumb to use type of Trend line
  • 69.
    5. Exponential trendline : Use when data values increase or decrease rates that are constantly increasing. Rule of thumb to use type of Trend line
  • 70.
    6. Moving averagetrend line : Use it when uneven fluctuations are in data values Rule of thumb to use type of Trend line
  • 71.
    Best fit Trendline • We have learnt that if R2 Value is near to 1, the reliability of trend line is better. • So, now we need to use a trend line from the five available trend lines in excel menu to arrive at the most appropriate one to ensure that our forecast is most reliable. • The other trend line left out is Moving average for which ,you will neither get the equation nor the R2 value. • Simplest way to find the best fit trend line is to check every trend line’s R2 Value and use the trend line with highest R2 value ( Which is nearest to 1- out of 5 types)
  • 72.
    Forecasting : 3Simple Factors Use these 3 factors to forecast the sales Season Time series Trend
  • 73.
  • 74.
    Measuring Seasonality issimple Sales Year 1 Year 2 Year 3 Year 4 Year 5 Year 1 Year 2 Year 3 Year 4 Year 5 5 Year Avg. Jan 205 293 380 468 565 6.2% 6.7% 7.0% 7.1% 7.2% 6.9% Feb 296 387 482 571 663 8.9% 8.9% 8.8% 8.7% 8.5% 8.7% Mar 368 453 544 635 795 11.1% 10.4% 10.0% 9.7% 10.2% 10.2% Apr 396 483 568 657 770 11.9% 11.1% 10.4% 10.0% 9.9% 10.4% May 388 480 571 669 789 11.7% 11.0% 10.5% 10.2% 10.1% 10.5% Jun 248 338 425 524 613 7.5% 7.7% 7.8% 8.0% 7.9% 7.8% Jul 214 301 387 484 578 6.4% 6.9% 7.1% 7.4% 7.4% 7.1% Aug 245 332 426 525 621 7.4% 7.6% 7.8% 8.0% 8.0% 7.8% Sep 241 322 407 505 597 7.2% 7.4% 7.5% 7.7% 7.7% 7.5% Oct 244 334 422 515 611 7.3% 7.6% 7.7% 7.8% 7.8% 7.7% Nov 265 348 446 542 629 8.0% 8.0% 8.2% 8.2% 8.1% 8.1% Dec 217 299 393 483 564 6.5% 6.8% 7.2% 7.3% 7.2% 7.1% Year 3,327 4,370 5,451 6,578 7,795 100.0% 100.0% 100.0% 100.0% 100.0% 100.0%
  • 75.
    So, these threefactors can help us forecast Use these 3 factors to forecast the sales Season Time series Trend
  • 76.
    Here is atool I created for you… using all 3 factors Please download it in the downloads section or click the link below Forecasting tool
  • 77.
    Pharma Factors toconsider • Price variations – Better to forecast on units than value • Sales Closings and Incentives – Cyclical patterns ? • Campaigns – Special campaigns ? • Trade offers - Seasonality? • Market – Localized Seasonality ? ( Local festivals in zones e.g. Diwali, Puja etc.)
  • 78.
  • 79.
    Select the data, click forecast and Create
  • 80.
  • 81.