Download to read offline

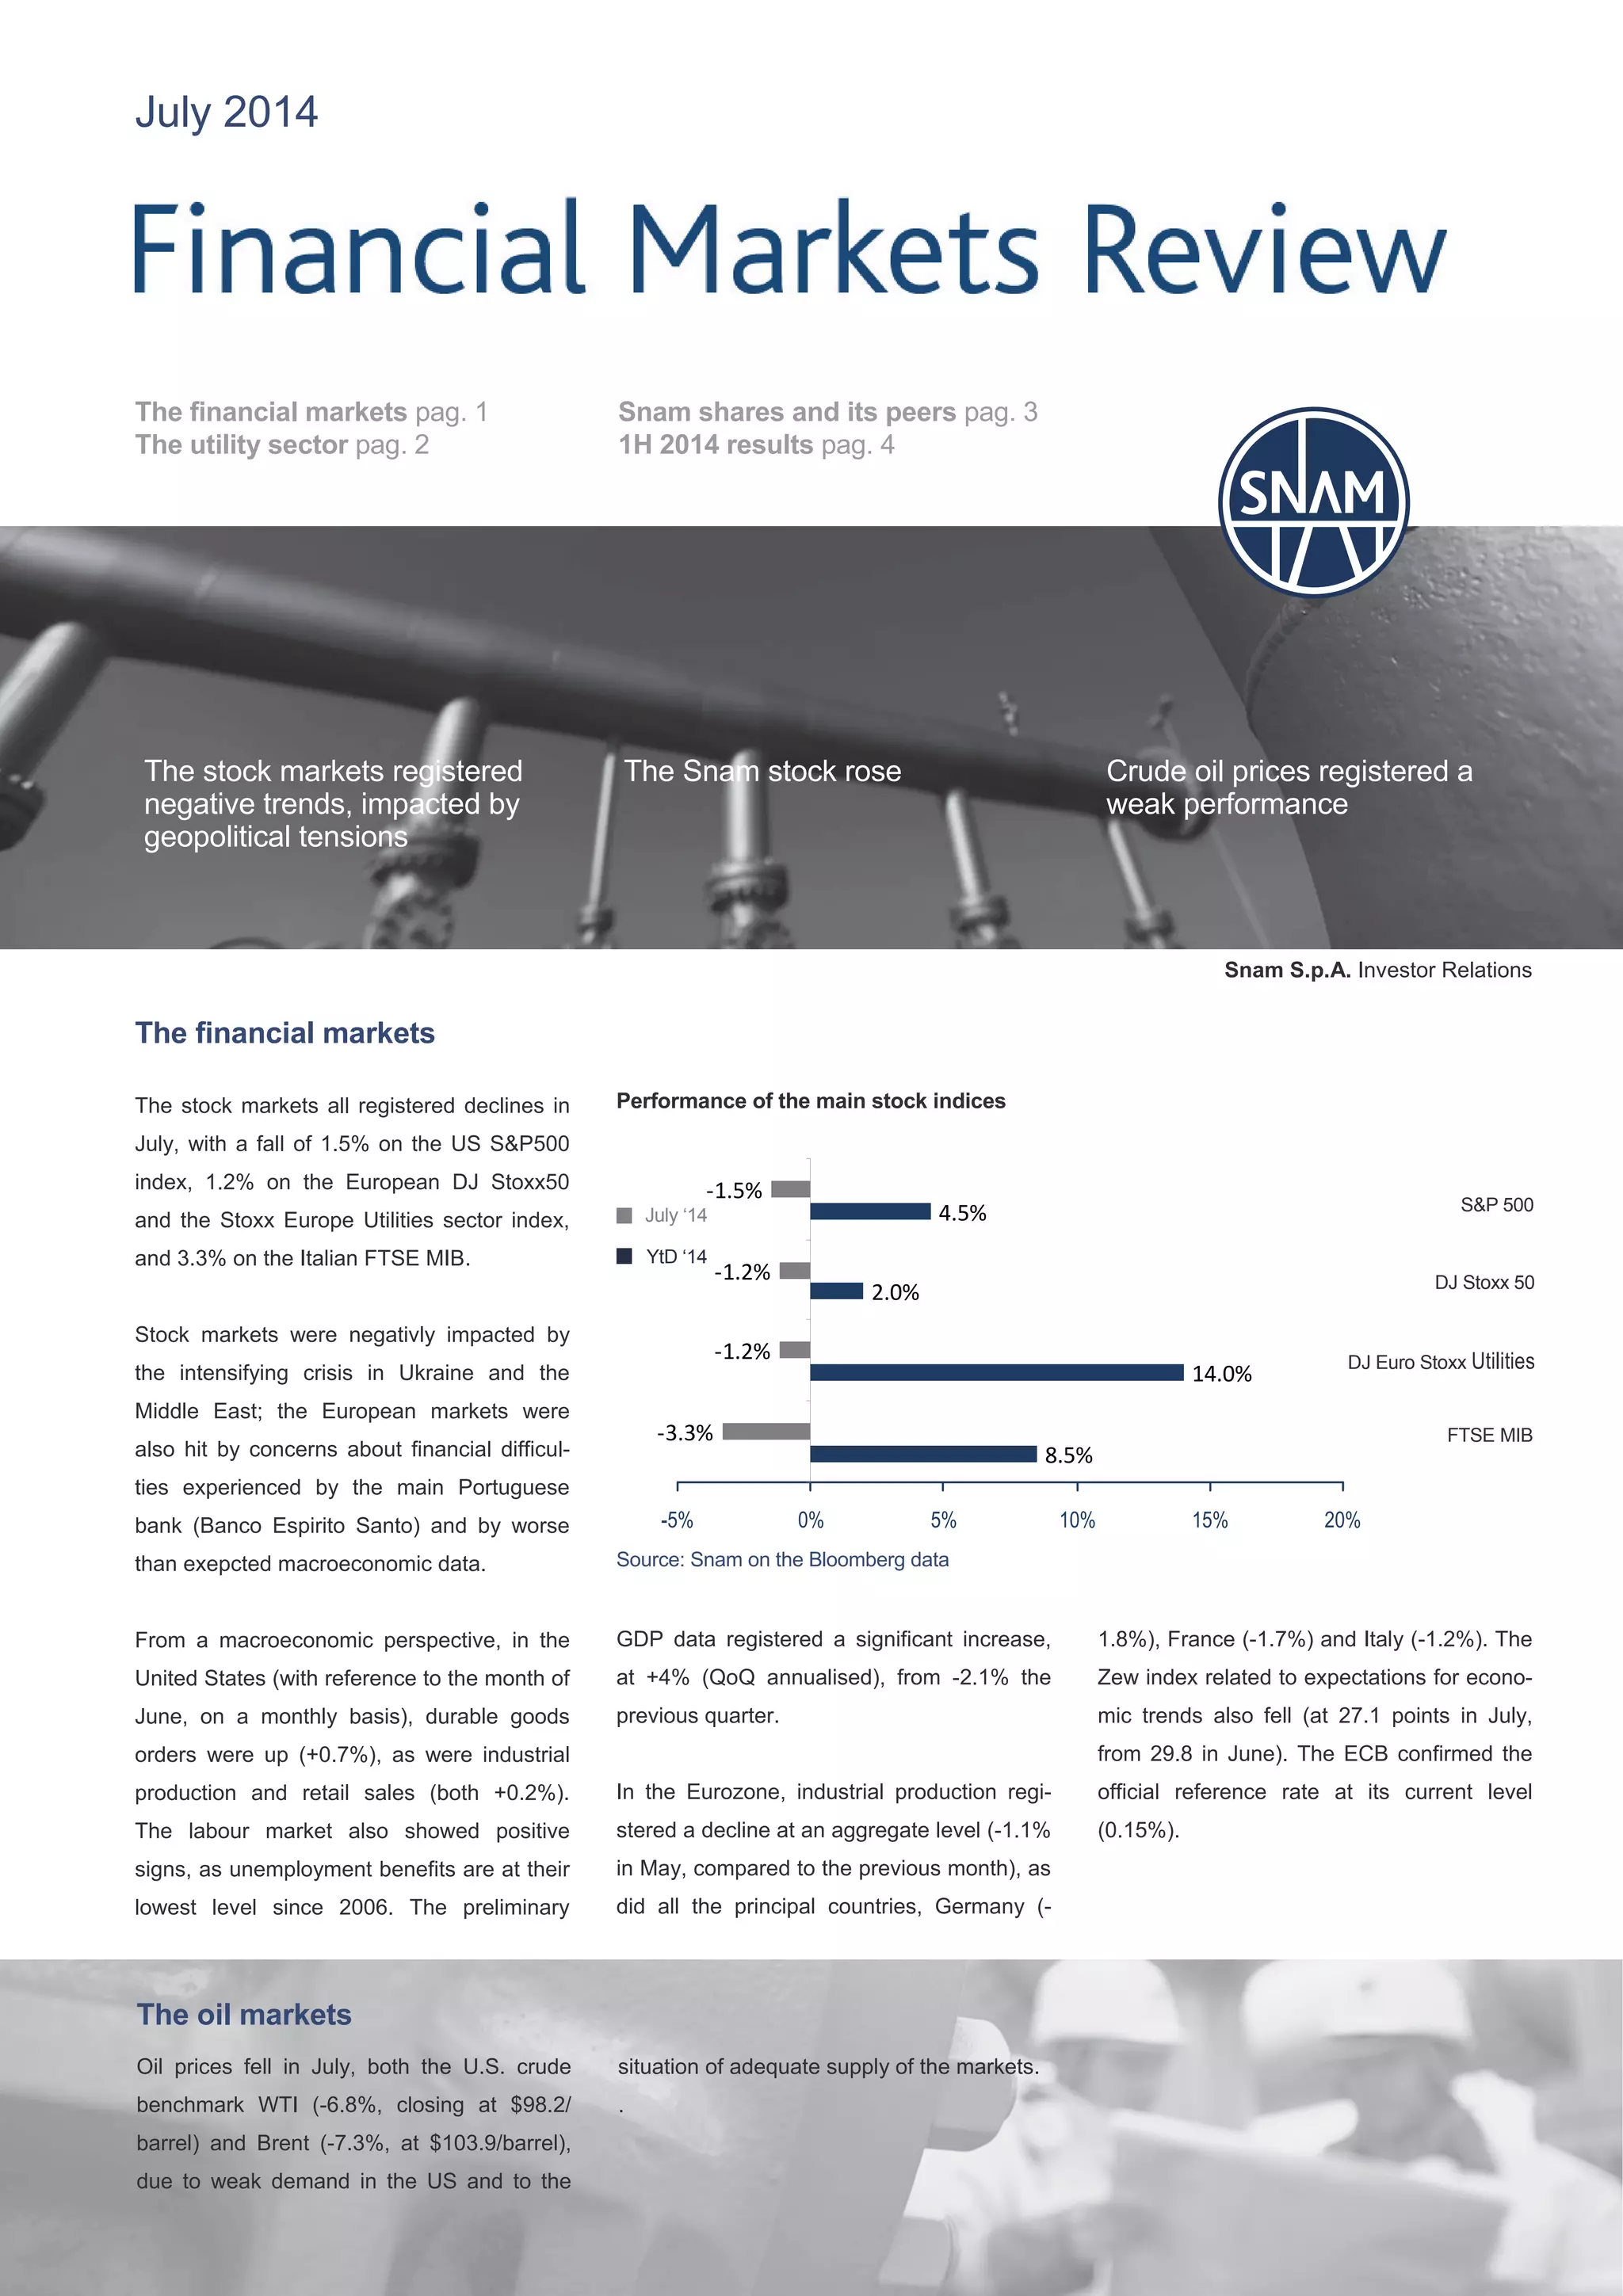
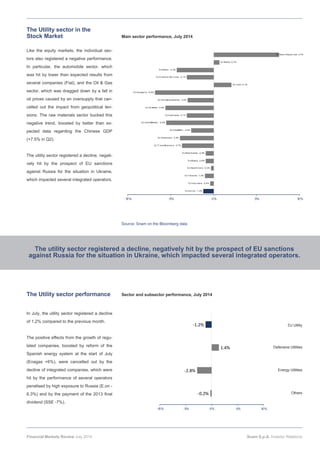
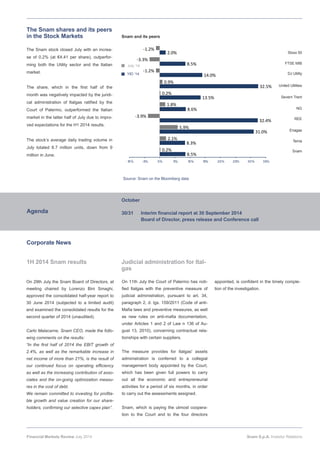
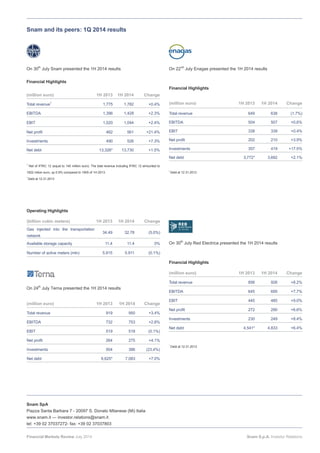

The stock markets registered declines in July due to geopolitical tensions. Crude oil prices also fell significantly due to oversupply concerns. The utility sector declined by 1.2% due to concerns about EU sanctions against Russia impacting integrated operators. Snam shares closed July up 0.2%, outperforming the utility sector and Italian market, as expectations improved for its upcoming 1H 2014 results announcement. Snam reported a 2.4% increase in EBIT and 21.4% rise in net profit for 1H 2014 due to operating efficiencies and lower debt costs.


