Download to read offline


![Honolulu High Capacity Trans;l Corridor Projecl
Honolulu, Hawaii
The City is a body politic and corporate, as provided in Section 1-101 of the Charter of the City and
County of Honolulu 1973, as amended (RCH). The City's governmental structure consists of the
Legislative Branch and the Executive Branch. The legislative power of the City is vested in and exercised
by an elected nine-member City Council whose terms are staggered and limited to no more than two
consecutive four-year terms. The executive power of the City is vested in and exercised by an elected
Mayor, whose term is limited to no more than two consecutive full four-year terms. The City is
authorized under Chapter 51 of the Hawai'i Revised Statutes to "acquire, condenm, purchase, lease,
construct, extend, own, maintain, and operate mass transit systems, including, without being limited to,
motor buses, street railroads, fixed rail facilities such as monorails or subways, whether surface,
substu-face, or elevated, tax.is, and other forms of transportation for hire for passengers and their personal
baggage." This authority may be carried out either directly, jointly, or under contract with private parties.
The City is the designated recipient of FfA Urbanized Area Formula Funds apportioned to the Honolulu
and Kailua-Kaneohe urbanized areas.
The DTS is authorized under RCH Chapter 17 and consists of an appointed DTS Director who is the
administrative head of the department, a transportation commission, and necessary staff. The DTS
Director's powers, duties, and functions include planning, operating, and maintaining transportation
systems, including transit. The DTS Director reports to the City Managing Director who is the principal
administrative aide to the Mayor. Section 2-12.1 of the Revised Ordinances of Honolulu, as amended
(ROH), assigns to the DTS Director the responsibility of planning, designing, operating, and maintaining
the automated fixed guideway rapid transit system and for planning, administering, and coordinating
those programs and projects that are proposed to be funded under the Federal Transit Act, as amended.
The DTS' Rapid Transit Division will be responsible for planning, designing, implementing, and
operating the Project. The Public Transit Division of DTS is responsible for the City's fixed route and
paratransit services operated under contract by O'ahu Transit Services, Inc. The City's fixed route bus
system is referred to as 'TheBus." TheBus serves the entire island of O'ahu with 91 bus routes, and
carries more than 70 million unlinked passenger trips each ye:u. O'ahu Transit Services operates the
City's paratransit services, referred to as the 'TheHandi-Van." TheHandi-Van serves over 13,000
eligible customers, and caJ.Ties 750,000 unlinked passenger trips per year.
The local funding source for the Project is a one-half percent (0.5 percent) surchaJ.·ge on the State of
Hawai'i's General Excise Tax and Use (GET), first authorized in 2005, and adopted by the City in
Ordinance No. 05-027, which established a 0.5 percent GET surcharge. The GET surchaJ.·ge commenced
on January I, 2007, and will be levied through December 31, 2022. Business activities that are subject to
the 4% GE tax. rate, such as retailing of goods and services, contracting, renting real property or tangible
personal property, and interest income, are also subject to the GET surcharge. This source of revenue is
to be exclusively used for operating and/or capital expenditures of a fixed guideway system. The
Hawai'i State Department of Taxation collects the GET sW'charge and remits it to the City, net of a 10
percent administrative charge.
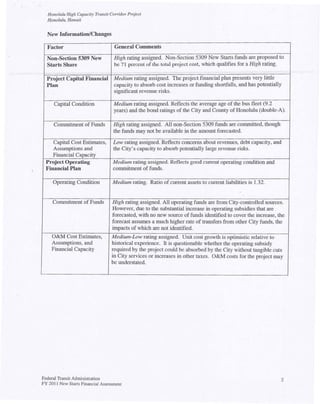
PROJECT FINANCIAL SUMMARY
Total capital cost ($YOE) $ 5,347,681,000
(including $290,300,000 in financing charges)
Section 5309 New Starts Share $ 1,550,000,000 29.0%
Non-Section 5309 New Starts Share $ 3,797,681,000 71.0%
Annual project O&M costs (first full year of operation [FY 2020]) $ 85,908,000
Total systemwide annual O&M costs (cunent year) $ 189,513,000
Total systemwide annual O&M costs (first full year of New Starts Operation) $ 356,951,000
Federal Transit Administration 4
FY 20 II New Starts Financial Assessment](https://image.slidesharecdn.com/fmocreportnov-2009-101214222514-phpapp02/85/FMOC-Report-4-320.jpg)


![Honolulu High Capacity Transit Corridor Project
Honolulu, Hawaii
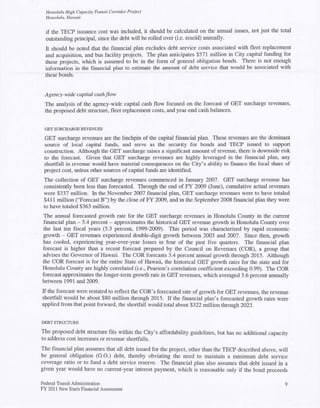
Project O&M costs
The Project is projected to cost $85.9 million in its first full year of operation (2020). Approximately 6.8
million annual vehicle revenue miles will be operated, yielding a unit cost in 2020 of $12.56 per vehicle
revenue mile. The rail operating cost estimate was reviewed by an FT A consultant in June 2009. The
cost estimate was developed from an operating analysis of the Washington, DC, Metrorail system, from
which a series of adjustments were made to make the model representative of conditions in Honolulu.
The Metrorail system was not a first choice, nor the only choice, to use as a base for the operating cost
model. In fact, the Honolulu rail line was said in the repOit to be analogous to rapid transit operations in
Vancouver, BC and Kennedy International Airport (Air Train). The repOit noted the difficulty in using
the Metrorail data to approximate the Honolulu operation, and questioned some of the cost adjustments.
A comparison of the unit cost ($12.56, 2020$) to the unit cost of heavy rail and high-speed light rail
operators indicates that the financial plan assumptions are optimistic. The 2020 unit cost was discounted
to 2007 dollars, at a 2.5 percent annual discount rate, yielding a unit cost of $9.11. This was compared to
2007 actual results for a collection of heavy rail systems - WMATA Metrorail ($10.39); Los Angeles
MTA ($14.59); Baltimore ($10.68); and Miami ($9.65). The average of these systems was $11.33.
BART was considered but excluded due to its very high operating speed (34.9 mph). The'Honolulu unit
cost estimate was also compared to two high-speed light rail operations - Dallas ($15.28) and Los
Angeles MTA ($16.63). The estimated unit cost for Honolulu ($9.11) is lower than any of these systems.
It is 20 percent lower than the heavy rail average, and is 43 percent lower than the light rail average.
Although more information is needed about the planned operation, these results suggest that the rail
operating cost estimate has much more upside risk than downside risk. Also worth noting is the
relativelY low rate of growth in rail unit costs - between 2019 and 2030, rail unit cost is forecast to grow
at 1.5 percent annually, a full point below inflation.
The Project will have a significant operating impact. Its net cost at 2020 ($85.9 million) is about 32
percent of the cost of bus and Handi-Van services. The Project will add 6.8 million revenue vehicle
miles, a 26 percent increase relative to bus and Handi-Vanservices.
Operating trends
The review of operating trends focused on inflation assumptions, unit costs, the firebox recovery ratio,
and operating subsidies.
The forecasted rate of inflation is 2.5 percent annually beginning in 2012 and continuing tln'ough the
horizon year of the forecast (2030). The inflation rate for the period 2010-2012 was not cited. The
Honolulu cpr-u, as reported by the Bureau of Labor Statistics, averaged 3.1 percent between 1999 and
2008. In the first half of calendar year 2009, Honolulu inflation fell to just 0.8 percent (nationally, there
was a 0.5 percent decline). The long-term inflation assumption may be slightly optimistic.
The financial plan assumes a steady increase in bus and demand-response services throughout the
forecast. Bus vehicle revenue miles are assumed to grow from about 19.4 million miles currently to 21.6
million miles at 2030, or a growth rate of about 0.5 percent annually. In contrast, bus service levels were
nearly constant between 2003 and 2008.
The operating costs of bus and demand-response services were based on a cost build-up model, calibrated
to current operations. The disaggregate unii costs were escalated at the assumed rates of growtb in the
cpr. The average unit costs that result from this procedure show a lower compound annual growth rate
than near-term history indicates. Bus operating cost per vehicle revenue mile is forecasted to grow at 2.8
percent between 2009 and 2030, whereas the actual rate of growth between 2004 and 2008 was 4.1
percent. Demand-response cost per vehicle revenue mile is forecasted to grow at 2.4 percent between
2009 and 2030, whereas the actual rate of growth between 2004 and 2008 was 10.7 percent. Thus, the
operating cost forecast for both bus and demand-response service is considered to be optimistic.
Federal Transit Administration 14
FY 201] New Starts Financial Assessment](https://image.slidesharecdn.com/fmocreportnov-2009-101214222514-phpapp02/85/FMOC-Report-14-320.jpg)


The document provides a financial assessment of Honolulu's High Capacity Transit Corridor Project from the 2011 fiscal year. It finds that the project receives a rating of 3 out of 5 for its overall financial plan, non-New Starts share, capital plan, and operating plan. Specifically, it gives the project high marks for the commitment of its capital funds but medium or low marks for its capital and operating cost estimates and assumptions. The project seeks to build a 20-mile light rail line from East Kapolei to Ala Moana Center to be completed in 2019 at a total cost of $5.3 billion.


![Movie-Collection-Database.pptx[2].pptx for biotech](https://cdn.slidesharecdn.com/ss_thumbnails/movie-collection-database-260110184349-6042841d-thumbnail.jpg?width=640&height=640&fit=bounds)