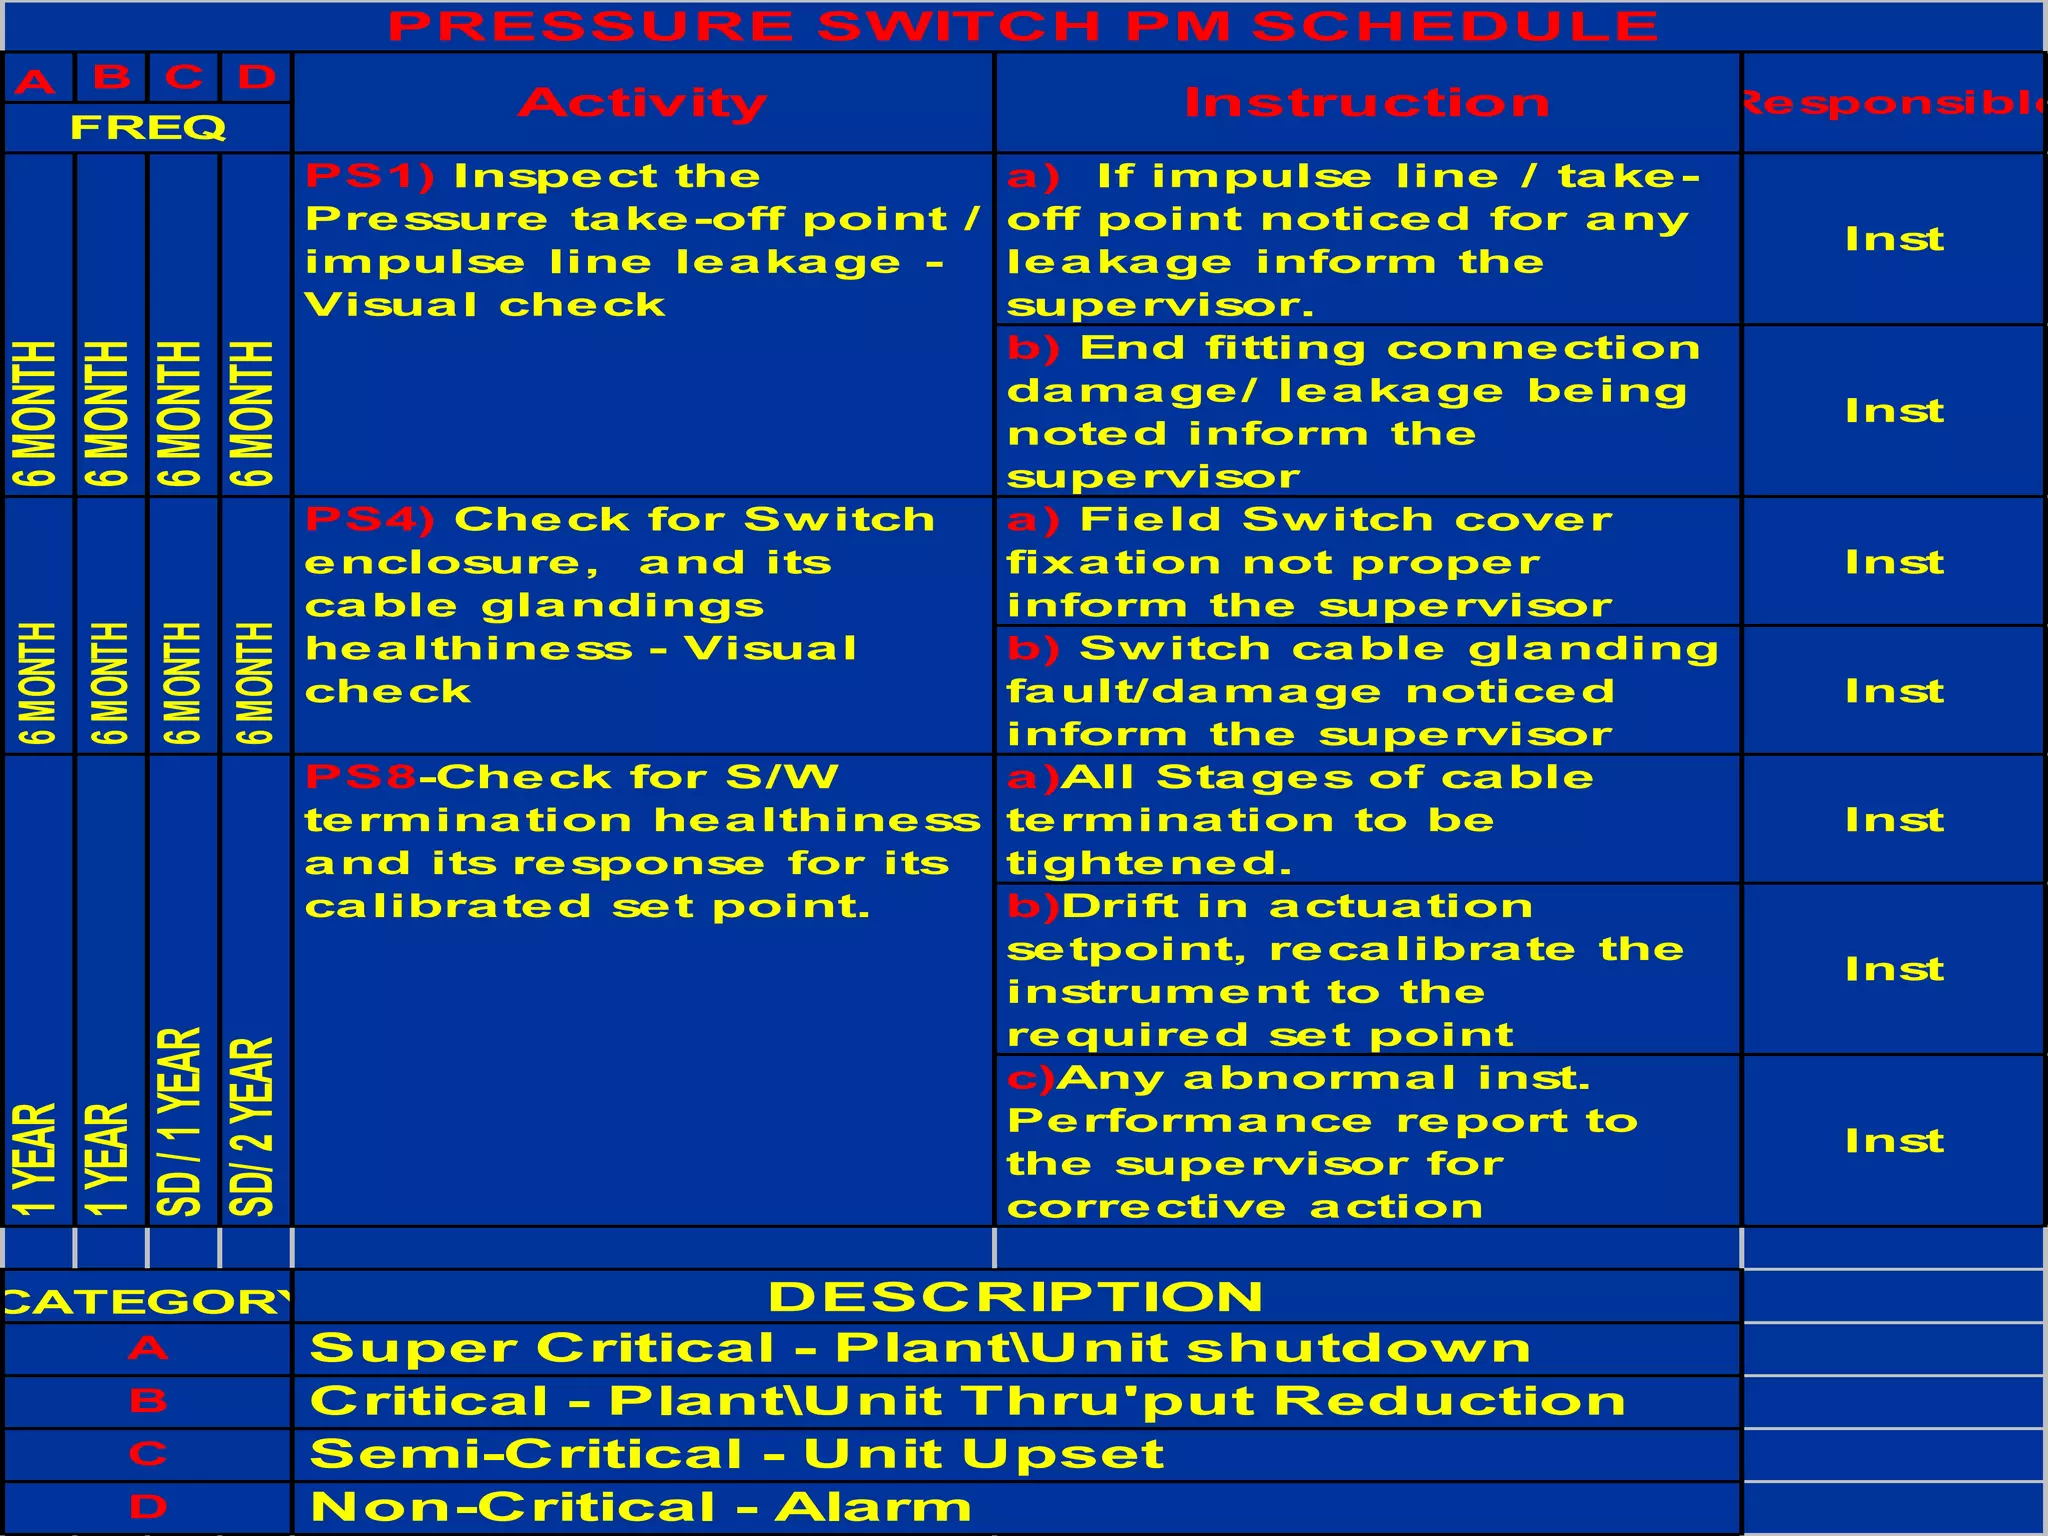
FMEA is a methodology that documents how an asset can fail and the consequences of each failure. It is used to identify critical assets, failure modes, and their effects. The document outlines the FMEA process which includes identifying failure modes and calculating a Risk Priority Number for each. Preventative maintenance tasks are then matched to failure modes to reduce risk. An example FMEA is provided for a pressure switch that lists potential failure modes, likelihood, severity, criticality ranking, and matched preventative maintenance tasks.
The FMEA relates to a very broad spectrum on how effective this tool can be utilized as solver aid in dealing with the histories/pattern of failure in the product.
And how well can it be hierarchically deal with analysis the root cause of the problem.
This methodology is widely adopted in almost all manufacturing branch industries, due to its efficiency is tracking down all the possibilities occurrence in failure with the severity, occurrence, etc and other parameters to define the intensity of the failure being occurred.
To understand the tools usage a bit further, I have enumerated a case study via a example in this slides.
FMEA failure-mode-and-effect-analysis_Occupational safety and healthJing Jing Cheng
Failure mode and effect analysis (FMEA) is one of the methods of hazard analysis. Through FMEA, failures in a system that may lead to undesirable situation can be identified
To identify which failures in a system can lead to undesirable situation.
CADmantra Technologies Pvt. Ltd. is one of the best Cad training company in northern zone in India . which are provided many types of courses in cad field i.e AUTOCAD,SOLIDWORK,CATIA,CRE-O,Uniraphics-NX, CNC, REVIT, STAAD.Pro. And many courses
Contact: www.cadmantra.com
www.cadmantra.blogspot.com
www.cadmantra.wix.com
FMEA has been around for many decades and has a long history as a method to support product designs, manufacturing processes, service, and maintenance. The plain truth is FMEA has the potential to be a very powerful tool to achieve high reliability in products and processes; and when done well, it is remarkably effective. Yet in practice, FMEA does not always achieve the expected results. Based on the experience of over two thousand FMEAs and working with many companies in a wide variety of applications, certain common mistakes show up repeatedly. What are the primary ways that FMEAs can be done wrongly (mistakes made), and what are the quality characteristics that make for effective FMEAs (quality objectives)? These questions are answered in this new short course on FMEA
This presentation provides a nice introduction to Failure Mode, Effects and Criticality Analysis (FMECA). Includes history and background, definitions, timelines for implementing and describes the FMEA methodology.
Hi @All,
This is a 30 minute introductory presentation of FMEA according to my personal professional view. I have chosen only those references that aligns with what I think best describe this analytical method.
FMEA is a technique developed by military reliability engineers between 1940 2) to 1950 using inductive reasoning (forward logic) single point of systematic failure analysis. FMEA helps to identify potential failure modes based on experience with similar products and processes - or based on common physics of failure logic. Effects Analysis refers to studying the consequences of those failures on different system. FMEA is an examination of all possible failures.
Cheers,
Rufran (091914)
Failure Mode and Effect Analysis (FMEA) Manual.
- The role and function of FMEA.
- Concepts and techniques of Design FMEA and how to apply it.
- Concepts and techniques of Process FMEA and how to apply it.
- The role and function of FTA.
- Concepts of Zero Quality Control and Mistake Proofing and its implications for FMEA.
tOTAL QUALITY MANAGEMENT - FMEA, FINAL YEAR B.E.CS- PRESENTED BY DR. K. BARANIDHARAN, SAIRAM INSTITUTE OF MANAGEMENT STUDIES (sims) SRI SAI RAM INSTITUTE OF TECHNOLOGY (sit) CHENNAI
How to used an automatic method for the execution of a Failure Mode, Effects and Criticality Analysis (F.M.E.C.A). The F.M.E.C.A is carried out based on the F.M.E.A approach reported by Bull, Stecki, Edge and Burrows [1] in 1997 and by Stecki [2] in 1998 combined with a Markov analysis in order to obtained complete F.M.E.C.A. Linear Graph Theory, is introduced in order to achieve an automated assembly of the governing differential equations needed for the Markov analysis.
CADmantra Technologies Pvt. Ltd. is one of the best Cad training company in northern zone in India . which are provided many types of courses in cad field i.e AUTOCAD,SOLIDWORK,CATIA,CRE-O,Uniraphics-NX, CNC, REVIT, STAAD.Pro. And many courses
Contact: www.cadmantra.com
www.cadmantra.blogspot.com
www.cadmantra.wix.com
This standard defines methods for calculating the early life failure rate of a product, using accelerated
testing, whose failure rate is constant or decreasing over time. For technologies where there is adequate
field failure data, alternative methods may be used to establish the early life failure rate.
The purpose of this standard is to define a procedure for performing measurement and calculation of early
life failure rates. Projections can be used to compare reliability performance with objectives, provide line
feedback, support service cost estimates, and set product test and screen strategies to ensure that the
Early life Failure Rate meets customers' requirements.
Grid Event Analysis In Indian Power SystemChandan Kumar
The Presentation discusses how Grid Events in Indian Power System are detected, classified, Analysed and Reported with various practical studies. It also discusses the challenges faced in the process and associated regulation.
Episode 6 : HAZARD IDENTIFICATION (FMEA & HAZOP)
FMEA - Failure Modes and Effects Analysis
Systematically identifies the potential failure of a system and its effects
Assesses the significance of each failure mode to determine
actions that would eliminate the chance of occurrence
Documents the potential failures
Oriented towards equipment rather than process
Harnessing WebAssembly for Real-time Stateless Streaming PipelinesChristina Lin
Traditionally, dealing with real-time data pipelines has involved significant overhead, even for straightforward tasks like data transformation or masking. However, in this talk, we’ll venture into the dynamic realm of WebAssembly (WASM) and discover how it can revolutionize the creation of stateless streaming pipelines within a Kafka (Redpanda) broker. These pipelines are adept at managing low-latency, high-data-volume scenarios.
We have compiled the most important slides from each speaker's presentation. This year’s compilation, available for free, captures the key insights and contributions shared during the DfMAy 2024 conference.
Sachpazis:Terzaghi Bearing Capacity Estimation in simple terms with Calculati...Dr.Costas Sachpazis
Terzaghi's soil bearing capacity theory, developed by Karl Terzaghi, is a fundamental principle in geotechnical engineering used to determine the bearing capacity of shallow foundations. This theory provides a method to calculate the ultimate bearing capacity of soil, which is the maximum load per unit area that the soil can support without undergoing shear failure. The Calculation HTML Code included.
Using recycled concrete aggregates (RCA) for pavements is crucial to achieving sustainability. Implementing RCA for new pavement can minimize carbon footprint, conserve natural resources, reduce harmful emissions, and lower life cycle costs. Compared to natural aggregate (NA), RCA pavement has fewer comprehensive studies and sustainability assessments.
Cosmetic shop management system project report.pdfKamal Acharya
Buying new cosmetic products is difficult. It can even be scary for those who have sensitive skin and are prone to skin trouble. The information needed to alleviate this problem is on the back of each product, but it's thought to interpret those ingredient lists unless you have a background in chemistry.
Instead of buying and hoping for the best, we can use data science to help us predict which products may be good fits for us. It includes various function programs to do the above mentioned tasks.
Data file handling has been effectively used in the program.
The automated cosmetic shop management system should deal with the automation of general workflow and administration process of the shop. The main processes of the system focus on customer's request where the system is able to search the most appropriate products and deliver it to the customers. It should help the employees to quickly identify the list of cosmetic product that have reached the minimum quantity and also keep a track of expired date for each cosmetic product. It should help the employees to find the rack number in which the product is placed.It is also Faster and more efficient way.
2. Failure Modes and Effects
Analysis
is a methodology that
documents the manners in
which an asset can fail, as
well as the consequences
of each failure with regard
to production and safety.
3. Use of FMEA
• is to Identify the Asset Criticality
Ranking
4. What is Asset Criticality
Ranking?
Numeric rank of an asset with
respect to its importance to safety
and production; based on the
likelihood of a failure mode to occur,
as well as on the effects of the failure
and costs to repair
5. SCOPE OF ASSET
CRITICALITY RANKING
is to provide the means
necessary to determine the
criticality of rotating equipment
and other assets with respect to the
asset’s importance to safety, the
environment and production
6. FMEA Methodology
1 All the possible failure modes for an
equipment is identified
2 Risk Priority Number is calculated for each
failure mode and equipment as a whole
3 All possible PM tasks for each failure mode
is identified with man-hour requirement
4 Failure Mode – PM Task matrix is
developed
5 PM tasks are selected to cover more than 70
% of risk assessed with optimum man-hour
requirement
7. FMEA - RPN
Calculation of Risk Priority
Number for the purpose of
criticality assessment.
Factors
Likelihood of Failure
Severity of the failure effects
Cost to repair
8. FEMA RANKING CHART
A B C D E F G H I J K L
1
2 X Z T
3
4
N
SUM (A TO L) = Y
CRITICALITY RANKING
Sl.No. Failure mode LOF
Effect
CTR Ranking
T = X * Y * Z
CRITICALITY RANKING (N) = sum of T’s
9. Functional Failure
• Failure that results in the loss of an
asset’s ability to perform its intended
function at its desired level of
performance. A functional failure may
be a failure that results in a complete, or
partial, loss of asset performance.
10. Failure Mode
Manner in which a functional
failure is realized; may or may
not be the root cause of the
functional failure. A functional
failure can possess one or more
failure modes.
Failure modes should be based
on those that are plausible, or
most likely to occur, based on
the past history of the
component.
11. CONTROL VALVE
S.No Functional Failure Failure Mode
INST AIR LEAKAGE
INST AIR FAILURE
PRESSURE REGULATOR FAILURE
I/P CONVERTOR FAILURE
DIAPHRAGM FAILURE
CONTROL SYSTEM FAILURE
POSITIONER FAILURE
SOLENOID VALVE FAILURE
CONTROLLER PROBLEM
TUNNING PROBLEM
PROCESS PROBLEM
AIR REGULATOR FAULT
C/V ACCESSORIES FAULT
VALVE PASSING
ERROSION (PLUG / SEAT RING)
MECHANICAL FAULT
BLOCKAGE
MECHANICAL FAULT
DROPPING OF PLUG.
GONE TO FAIL SAFE CONDITION
VALVE HUNTING
MORE THAN REQUIRED FLOW
LESS FLOW
1
2
3
4
12. Likelihood of Failure
LIKELIHOOD CRITERIA
1
REMOTE: Failure is unlikely to occur
No evidence (i.e. work order) of prior occurrence; staff unaware of
it occurring on any similar piece of equipment.
2
LOW: Relatively few failures
Evidence (i.e. work order) of prior occurrence; staff aware of this
occurring on a similar piece of equipment, but not on the specific
equipment being analyzed, and the conditions resulting in the
previous failure do not exist in this case.
4
MODERATE: Occasional failures
Evidence (i.e. work order) of this failure mechanism with
occasional occurrence; staff aware that this failure mechanism
has occurred several times in the past.
8
HIGH: Repeated failures
Evidence (i.e. work order) of prior repeated occurrences; staff
aware that this failure mechanism has occurred many times in the
past.
10
VERY HIGH: Failure is almost inevitable
Evidence (i.e. work order) of continuous occurrence; staff aware
that this failure mechanism has occurred many times in the past.
13. Failure Effects
• The consequences of a
functional failure of an installed
asset. Failure effects are usually
described in terms of impact on
the asset, process, production,
and safety or environmental
issues.
Each failure mode may have more than one failure
effect. Identify all applicable failure effects for each
failure mode by inserting the proper weighting factor in
the appropriate column.
14. Failure Effects
FAILURE
CODE
DESCRIPTION
WEIGHTING
FACTOR
A FIRE / EXPLOSION 10
B TOTAL REFINERY SHUTDOWN 10
C HHC / FLAMMABLE SUBSTANCE RELEASE 10
D ENVIRONMENTAL EXCEEDANCE 10
E PLANT SHUTDOWN 8
F UNIT SHUTDOWN 7
G THRO'PUT REDUCTION (>5 %) 7
H THRO'PUT REDUCTION (<5 %) 5
I POWER IMPORT 5
J PLANT / UNIT UPSET 4
K LOSS OF REDUNDANCY 4
L ENERGY LOSS 4
15. Cost-to-Repair
• Preparer shall use best judgement or
component repair knowledge for this
estimate (Item L). Refer the Table
for the CTR value.
Cost to Repair
WEIGHTING FACTOR REPAIR COST
1 Minimal to moderate repair costs
3 Moderate to high repair costs
5 High to excessive repair costs
16. Determination of Critical Asset
Ranking
To determine the equipment criticality, list
out all the equipment's in the ascending form
depending upon their RPN value calculated
through failure mode criticality analysis
Prepare a bar chart using FEMA NO: in the
x axis and the risk priority no. in the y axis
Identify/classify the equipment's under three
categories viz. Most critical, critical and least
critical in the above chart.
18. Identification of applicable CD and
TD PM Task
1 List out the entire CD and TD preventive
maintenance task for the particular type of
equipment from the available sources.
2 Based on Equipment Criticality Ranking of
the equipment the required CD and TD PM tasks
shall be selected.
3 If one task eliminates more number of
failure modes that task shall also be included in
applicable CD and TD PM tasks.
1/2
19. 4 If the risk priority number of a particular
failure mode is very high the task that
eliminates the failure mode shall also be
included in applicable CD and TD PM tasks.
5 Based on equipment history the task
performed frequently on a particular type of
equipment shall also be included in
applicable CD and TD PM tasks.
6 The task need to be performed on
particular type of equipment to meet statutory
requirement shall also be included in
applicable CD and TD PM tasks.
Identification of applicable CD and
TD PM Task
2/2
20. FMEA Benefits
٭ Improves the quality, reliability & safety of the
products, or service.
٭ Generate input data for use in system safety and
maintainability analysis
٭ Reduces product development time and costs.
٭ Systematic approach to classifying failures
٭ Identifies all possible failure modes and their
effects on objectives, personnel, system
٭ Helps error identification and prevention
٭ Helps establish the forum for defect prevention
٭ Helps define the corrective action
٭ Helps determine the redundancy of the system
21. A B C D E F G H I J K L
PRIMARY ELEMENT
1 Impulse line take -off leakage 4 4 1 16 16
2 Impulse line choked 1 4 1 4 4
3 Impulse line steam tracing failure
SECONDARY ELEMENT
4 Micro Switch unit failure 1 4 3 12 12
5 Switch Repeatability failure 2 4 5 40 40
6 Calibration Setting drift 4 4 1 16 16
7 Switch mechanism malfunction 1 4 5 20 20
8 Switch cable termination/block fault 2 4 1 8 8
Branch Cable
9
Cable fault due to improper cable
glanding 1 4 3 12 12
10 Cable fault due to physical damage 1 4 3 12 0
Multi-Core cable fault
11 Cable fault due to physical damage 1 4 5 20 0
12
Cable termination fault at Marshall
Rack 1 4 1 4 4
13
Cable termination fault at Barrier
Rack 2 4 1 8 8
14 Cable termination fault at PLC opto-
coupler side 1 4 1 4 4
Switch Power supply
15 Barrier failure 2 4 3 24 24
16 Fuse blown at Power distribution
Unit due to earthing fault 1 4 1 4 4
204 172
CTR Ranking
PRESSURE SWITCH (TRIP) ---- UNIT/PLANT UPSET
Coverage
Effect
Sl.No. Failure mode LOF
22. Failure mode
A B C D E F G H I J K L
PRIMARY ELEMENT
1
Impulse line take -off
leakage 4 7 1 28 28
2 Impulse line choked 1 7 1 7 7
3
Impulse line steam
tracing failure
SECONDARY
ELEMENT
4
Micro Switch unit
failure 1 7 3 21 21
5
Switch Repeatability
failure 2 7 5 70 70
6
Calibration Setting
drift 4 7 1 28 28
7
Switch mechanism
malfunction 1 7 5 35 35
8
Switch cable
termination/block fault 2 7 1 14 14
Branch Cable
9
Cable fault due to
improper cable
glanding 1 7 3 21 21
10
Cable fault due to
physical damage 1 7 3 21 0
Multi-Core cable fault
11
Cable fault due to
physical damage 1 7 5 35 0
12
Cable termination fault
at Marshall Rack 1 7 1 7 7
13
Cable termination fault
at Barrier Rack 2 7 1 14 14
14 Cable termination fault
at PLC opto-coupler
side 1 7 1 7 7
Switch Power supply
15 Barrier failure 2 7 3 42 42
16 Fuse blown at Power
distribution Unit due to
earthing fault 1 7 1 7 7
357 301
Coverage
PRESSURE SWITCH (TRIP) ---- THRU'PUT RDn.
Ranking
Sl.No. LOF
Effect
CTR
26. 8
Switch cable
termination/block
fault 8 8 8 8 8
Branch Cable
9
Cable fault due to
improper cable
glanding 12 12 12
10
Cable fault due to
physical damage 12 12
Multi-Core cable
fault
11
Cable fault due to
physical damage 20
12
Cable termination
fault at Marshall
Rack 4 4 4
13
Cable termination
fault at Barrier Rack 8 8 8
14 Cable termination
fault at PLC opto-
coupler side 4 4 4
Switch Power
supply
15 Barrier failure 24 24
16 Fuse blown at
Power distribution
Unit due to earthing
fault 4 4
204 16 60 60 68 52 12 44 144
27. A B C D
a) If impulse line / take-
off point noticed for any
leakage inform the
supervisor.
Inst
b) End fitting connection
damage/ leakage being
noted inform the
supervisor
Inst
a) Field Switch cover
fixation not proper
inform the supervisor
Inst
b) Switch cable glanding
fault/damage noticed
inform the supervisor
Inst
a)All Stages of cable
termination to be
tightened.
Inst
b)Drift in actuation
setpoint, recalibrate the
instrument to the
required set point
Inst
c)Any abnormal inst.
Performance report to
the supervisor for
corrective action
Inst
PS8-Check for S/W
termination healthiness
and its response for its
calibrated set point.
C
Critical - PlantUnit Thru'put Reduction
Semi-Critical - Unit Upset
Super Critical - PlantUnit shutdown
Non-Critical - Alarm
B
D
PRESSURE SWITCH PM SCHEDULE
PS1) Inspect the
Pressure take-off point /
impulse line leakage -
Visual check
6
MONTH
PS4) Check for Switch
enclosure, and its
cable glandings
healthiness - Visual
check
6
MONTH
Responsible
DESCRIPTION
6
MONTH
CATEGORY
A
6
MONTH
1
YEAR
1
YEAR
SD
/
1
YEAR
SD/
2
YEAR
Instruction
6
MONTH
6
MONTH
FREQ
6
MONTH
6
MONTH
Activity
28. Routines Activity Details Responsible
Daily Activity: Nil
Weekly Activity : Nil
Monthly Activity
a) Condition the
impulse line
Inst
b) Proper action to be
taken for end fitting
connections if any
damage being noted
Inst
a) Fix the Switch
cover properly
Inst
b) Close the Jn. Box
door with proper
fixing screws
Inst
a) Proper cable
glanding to the
Switch & Jn.Box to
be done if needed
Inst
b) Replace the Jn.
Box Gasket if
needed/damage
observed
Inst
PRESSURE SWITCH PM ACTIVITY
IP1) Observe for
Impluse line
condition and its
end fittings
IP2) Check for
Switch enclosure,
Jn. Box cover &
door fixed properly
IP3) Check Switch,
Jn. Box cable
glandings and its
Gasket to avoid
water entry
1/2
29. Routines Activity Details Responsible
IP4) Check for Inst.
Cable tray and Jn. Box
external painting
condition and its rain
hood fixation
a) Report any damage
noticed towards cable
tray / Junction Box Inst
IP6) Check for S/W
actuation to its
calibrated set point
a) Any drift from set point
corrective action to be
done
Inst
a) Any malfunction noted
service the switch
Inst
b) Repeatability problem
replace the switch
Inst
a) All Stages of Cable
terminations to be
tightened if any loose
connections noted
Inst
b) Barrier grounding
terminal connections and
its power supply to be
inspected, any
abnormality report to the
supervisor
Inst
PRESSURE SWITCH PM ACTIVITY
Yearly Activity
IP7) Shop Service /
calibrating the switch /
S/d
IP5) Check for loop
termination tightness
from field S/W to FPR
Half-Yearly Activity
30. S.NO
TAG NO
CATEGORY
Manhours/Yr
FMEA
FMEA
COVERED
FMEA
%
COVERAGE
1 76X
V411 C 1.17 256 224 87.5
2 76X
V412 C 1.17 256 224 87.5
3 76X
CV413 C 1.50 256 224 87.5
4 76X
CV414 C 1.50 256 224 87.5
5 76X
CV415 C 1.50 256 224 87.5
6 76X
Y411 C 0.17 240 196 81.67
7 76X
Y412 C 0.17 240 196 81.67
8 76ZSL411 C 0.17 276 244 88.41
9 76ZSL412 C 0.17 276 244 88.41
10 76ZSL413 C 0.17 276 244 88.41
11 76ZSL414 C 0.17 276 244 88.41
12 76ZSL415 C 0.17 276 244 88.41
13 76PT411 C 0.67 466 434 93.13
14 76PT403 A 4.67 784 728 92.86
15 LHH19276 A 8.67 448 392 87.5
16 THH19176 A 4.67 721 560 77.67
26.70 87.13
76 C 31 ADSORBER UNIT